The Role of the Capital Markets in Economic Development & Cytonn Weekly #12 2019
By Cytonn Research Team, Mar 24, 2019
Executive Summary
Fixed Income
T-bills recorded an oversubscription during the week, with the subscription rate rising to 198.9%, from 156.9% recorded the previous week. The oversubscription is partly attributable to improved liquidity conditions in the money market during the week as evidenced by the declining interbank rate that averaged 2.6% during the week, lower than the 3.8% recorded the previous week. The yields on the 91-day papers rose by 86.0 bps to 7.7%, while those of 182-day and 364-day papers dropped by 4.4 bps and 3.0 bps to 8.2%, and 9.4%, respectively. During the week, the Federal Open Market Committee (FOMC) maintained its benchmark policy rate within the band 2.25% - 2.5%. The Fed also discarded earlier promises it had made on further gradual rate increases, owing to fears of an economic slowdown in the U.S.;
Equities
During the week, the equities market recorded mixed performances with NASI and NSE 25 gaining by 1.2% and 1.0%, respectively, while NSE 20 declined by 0.3%, taking their YTD performance to gains of 13.9%, 1.9% and 12.0% for NASI, NSE 20 and NSE 25, respectively. Standard Chartered Bank Kenya, Co-operative Bank of Kenya, Diamond Trust Bank Kenya and NIC Group released their FY’2018 financial results, recording core earnings per share growths of 17.1%, 11.6%, 2.3% and 2.0%, respectively;
Private Equity
In the FinTech sector, OneFi, a Nigeria-based FinTech firm that provides mobile loans to clients, announced plans to buy out Amplified Payment System Limited (Amplify), a mobile payment solutions firm that provides platforms to connect banks, telcos and businesses based in Nigeria for an undisclosed amount. According to the announcement, OneFi will acquire Amplify’s intellectual property, staff and clientele, comprising of more than 1,000 merchants who transact on the platform. The new acquisition is expected to fasten OneFi’s transition from a primary mobile lender to a fully-fledged mobile-based consumer finance platform, and differentiate its services both locally and in the African region. There has been a rise in competition in the African FinTech sector from other FinTech start-ups such as Kenya’s M-PESA, that has expanded its mobile-money services to the global market in partnership with Western Union, the American financial services and communication company, thereby becoming the primary technology enabler for digital financial services across Africa;
Real Estate
During the week, Beijing Damei Investment Company, a Chinese construction firm, announced plans to construct a master-planned development on 1,200-acres in Athi River, with construction set to begin within the year. In other real estate matters, the Kenyan Government announced plans to incorporate blockchain technology in the process of digitizing the Lands Ministry, while South African retailer, Shoprite, launched its second store in Kenya, at the Garden City Mall located along the Thika Superhighway, Nairobi;
Focus of the Week
Capital mobilization is an integral part of a country’s economic structure. In Kenya, as is the case for majority of developing countries, economic growth has been largely dependent on the growth of the Industrial, Agriculture, Tourism and Service sectors. However, capital markets provide an avenue for capital formation and has an impact on businesses across the world. In this week’s focus, we analyze the long-run impact of capital markets on a country’s economic growth, and examine the extent to which developments in the capital markets can positively or negatively influence economic growth; this is especially important for Kenya as the country seeks to fund the President’s Big Four Agenda.
- On Monday, 18th March 2019, Cytonn Investments officially signed a Kshs. 650 million loan facility agreement with State Bank of Mauritius Bank Kenya (SBM Bank Kenya) to bring in long-term debt to complement its private markets funding. Bank Debt and Regulated Funds will now increasingly be part of the funding mix. Read the press release here.
- We have successfully rolled out our agency distribution model. You can now find us in 11 locations. This will bring us closer to clients, and enable us to serve our clients while also reducing office set up and running costs. You can now reach us at 11 locations, namely: Nairobi, Nakuru, Nyeri, Eldoret, Embu, Kakamega, Kericho, Kisii, Kisumu, Meru, Mombasa, Naivasha, Nanyuki and Nyahururu.
- Faith Maina – Investment Analyst, was on KBC to discuss women and investments. Watch the interview here.
- Shiv Arora – Head of Private Equity, was on Citizen to discuss the bank interest rate divide. Watch the interview here.
- Natasha Gichuki – Legal Assistant, was on KBC to discuss property and financial management. Watch the interview here.
- For an exclusive tour of the developments, visit: Sharp Investor’s Tour and for more information, email us at sales@cytonn.com;
- Following the recent approval by Retirement Benefits Authority (RBA), for Cytonn Asset Managers to manage pension funds, we are looking for business development consultants and agents with networks in the pensions industry to build our pensions business at very attractive commissions. If interested in being an agent or know someone who can be an agent, kindly contact us at pensions@cytonn.com;
- Following the completion and handover of Amara Ridge in Karen, we have now launched our next Karen project, dubbed Applewood, a Kshs 2.5 bn residential development located in Miotoni, Karen. This signature development shall comprise luxury homes, each sitting on 1/2 acre. We invite you to the exhibition of Applewood which is ongoing at the Amara Ridge Clubhouse (Location pin: https://goo.gl/maps/B3GVnu8pHyn) or at the Applewood Sales Centre on Miotoni Road (Location pin: https://goo.gl/maps/ZfABuGjFo1z) from 9:00 am to 5:00 pm daily. Call 0709 101 000 or email resales@cytonn.com to reserve a villa! See Video here;
- We continue to hold weekly workshops and site visits on how to build wealth through real estate investments. The weekly workshops and site visits target both investors looking to invest in real estate directly and those interested in high yield investment products to familiarize themselves with how we support our high yields. Watch progress videos and pictures of The Alma, Amara Ridge, and The Ridge. Key to note is that our cost of capital is priced off the loan markets, where all-in pricing ranges from 16.0% to 20.0%, and our returns on real estate developments range from 23.0% to 25.0%, hence our top-line gross spread is about 6.0%. If interested in attending the site visits, kindly register here;
- We continue to see very strong interest in our weekly Private Wealth Management Training (largely covering financial planning and structured products). The training is at no cost and is open only to pre-screened participants. We also continue to see institutions and investment groups interested in the training for their teams. Cytonn Foundation, under its financial literacy pillar, runs the Wealth Management Training. If interested in our Private Wealth Management Training for your employees or investment group, please get in touch with us through wmt@cytonn.com. To view the Wealth Management Training topics, click here;
- For recent news about the company, see our news section here;
- We have 10 investment-ready projects, offering attractive development and buyer targeted returns of around 23.0% to 25.0% p.a. See further details here: Summary of Investment-Ready Projects;
- We continue to beef up the team with ongoing hires for Financial and Real Estate Advisors for our offices in Nairobi, Nakuru, Kisumu, and Nyeri. Visit the Careers Section on our website to apply.
T-Bills & T-Bonds Primary Auction:
T-bills recorded an oversubscription during the week, with the subscription rate rising to 198.9%, from 156.9% recorded the previous week. The oversubscription is partly attributable to improved liquidity conditions in the money market during the week as evidenced by the declining interbank rate that averaged 2.6% during the week, lower than the 3.8% recorded in the previous week. The yields on the 91-day papers rose by 86.0 bps to 7.7%, while those of 182-day and 364-day papers dropped by 4.4 bps and 3.0 bps to 8.2%, and 9.4%, respectively. The acceptance rate for T-bills rose to 73.3%, from 63.5% the previous week, with the government accepting Kshs 35.0 bn of the Kshs 47.7 bn worth of bids received. The subscription rate for the 91-day paper declined to 68.4%, from 76.7% recorded the previous week, while that of the 182-day and 364-day papers rose to 90.6% and 359.3% from 79.6% and 266.2%, recorded the previous week, respectively, with investors’ participation remaining skewed towards the longer dated paper. The demand for the longer-dated paper is attributable to the scarcity of newer short-term bonds in the primary market.
The newly issued 25-year (IFB1/2019/25) infrastructure bond for the month of March was undersubscribed at an overall subscription rate of 58.8%, attributable to the duration risk associated with long-term papers. The yield came in at 12.7%, in line with our expectations of 12.5% - 12.7%. The government accepted Kshs 16.3 bn out of the Kshs 29.4 bn worth of bids received, against Kshs 50.0 bn on offer, translating to an acceptance rate of 55.5%, indicating that bids were largely not within ranges the Central Bank of Kenya (CBK) deemed acceptable.
Liquidity:
The average interbank rate declined to 2.6%, from 3.8% the previous week, while the average volumes traded in the interbank market rose by 17.7% to Kshs 3.5 bn, from Kshs 3.0 bn the previous week. This decline in the interbank rate points towards favorable liquidity conditions, driven partly by government payments, which offset tax remittances by banks.
Kenya Eurobonds:
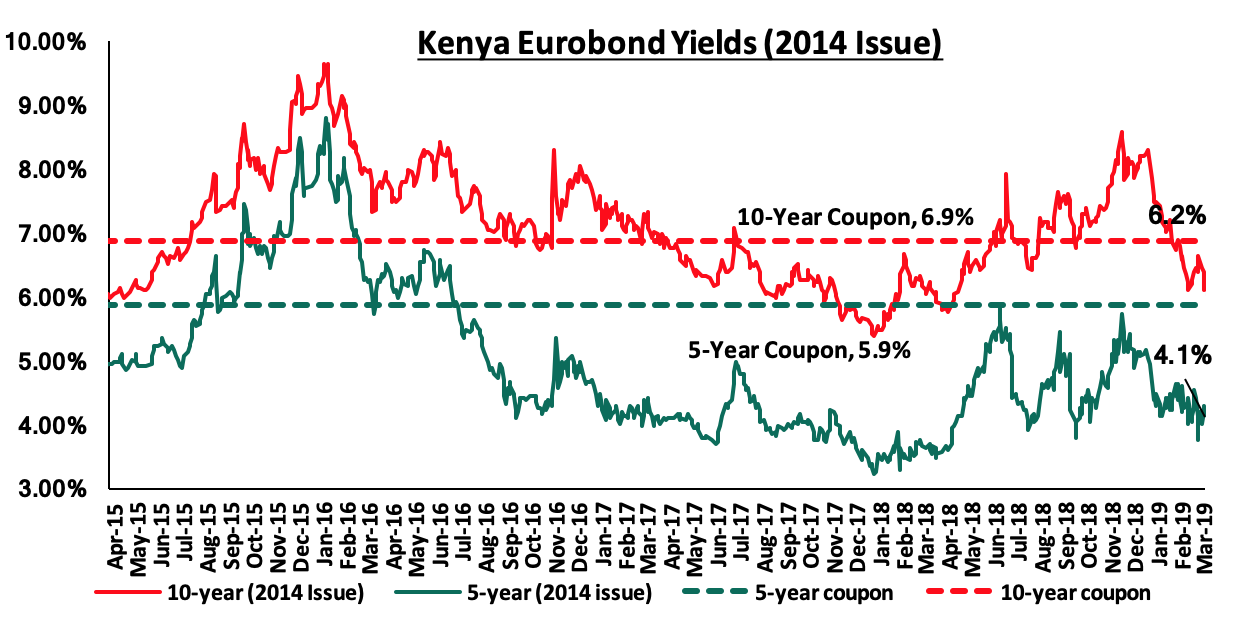
According to Bloomberg, the yield on the 10-year Eurobonds issued in 2014 declined by 0.1% points to 6.2% from 6.3%, while that of the 5-year remained unchanged at 4.1%. Since the mid-January 2016 peak, yields on the Kenyan Eurobonds have declined by 4.7% points and 3.5% points for the 5-year and 10-year Eurobonds, respectively, an indication of the relatively stable macroeconomic conditions in the country. Key to note is that these bonds have 0.3-years and 5.3-years to maturity for the 5-year and 10-year, respectively.
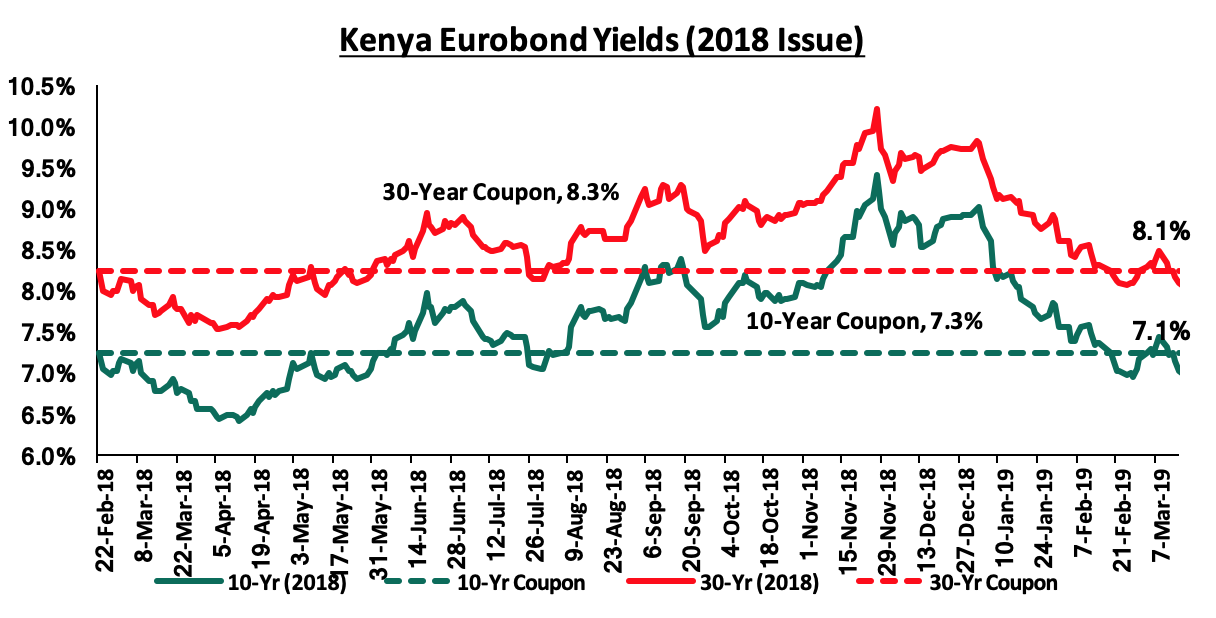
For the February 2018 Eurobond issue, during the week, the yields on 10-year Eurobonds rose by 0.1% points to 7.1%, from 7.0% the previous week, while that of the 30-year Eurobond remained unchanged at 8.1%. Since the issue date, the yields on both the 10-year and 30-year Eurobond have both declined by 0.2% points.
The Kenya Shilling:
During the week, the Kenya Shilling edged down by 0.6% against the US Dollar to Kshs 100.8, from Kshs 100.2 the previous week. The Kenya Shilling has appreciated by 1.0% year to date, and in our view the shilling should remain relatively stable to the dollar in the short term, supported by:
- The narrowing of the current account deficit with preliminary data on balance of payments indicating continued narrowing to 4.6% of GDP in the 12-months to January 2019, from 5.5% recorded in January 2018. The decline has been attributed to improved agriculture exports, increased diaspora remittances, strong receipts from tourism, and lower food and SGR-related equipment relative to 2017,
- Improving diaspora remittances, which increased by 38.6% in 2018 to USD 2.7 bn, from USD 1.9 bn recorded in 2017. The rise is due to:
- Increased uptake of financial products by the diaspora due to financial services firms, particularly banks, targeting the diaspora, and,
- New partnerships between international money remittance providers and local commercial banks making the process more convenient,
- CBK’s supportive activities in the money market, such as repurchase agreements and selling of dollars, and,
- High levels of forex reserves, currently at USD 8.1 bn, equivalent to 5.3-months of import cover, above the statutory requirement of maintaining at least 4-months of import cover, and the EAC region’s convergence criteria of 4.5-months of import cover.
Monetary Policy:
The Monetary Policy Committee (MPC) is set to meet on Wednesday, 27th March 2019, to review the prevailing macroeconomic conditions and decide on the direction of the Central Bank Rate (CBR). In their previous meeting held on 28th January 2019, the MPC maintained the CBR at 9.0%, citing that the economy was operating close to it's potential and inflation expectations remained anchored within the target range, thus the prevailing monetary policy stance remained appropriate. This was informed by the country’s macroeconomic fundamentals, which remained stable as well as sustained optimism on the economic growth prospects, as evidenced by:
- Inflation expectations, which have remained well anchored within the target range, declining to 4.7% in January 2019, from 5.7% recorded in December 2018, mainly driven by a 1.4% decline in the transport index attributable to a decline in pump prices of petrol and diesel, and,
- Increased private sector optimism as per the MPC Private Sector Market Perception Survey conducted in January 2019, which indicated that the private sector was optimistic about local economic prospects. The private sector expects stronger economic growth in 2019, driven by a better investment climate, continued infrastructure development, expectations of increased agricultural production, the continued decline in international oil prices, and strong tourism performance.
The Monetary Policy Committee also noted that the current account deficit had narrowed to 5.1% in the 12-months to November 2018, compared to 6.5% in November 2017, supported by strong growth of agricultural exports particularly tea and horticulture, improved diaspora remittances, and tourism receipts. The decline was also partly supported by higher tea and horticultural exports coupled with the slower growth in imports due to lower food and SGR–related equipment imports and declining international oil prices.
We believe that the MPC will maintain the current policy stance, given the macro-economic environment is relatively stable. We, therefore, expect the MPC to hold the CBR at 9.0% with their decision being supported by:
- Expectations of muted inflationary pressure in 2019, anchored by the declining food prices going forward with the expectations of long rains starting in late March as well as lower global fuel prices,
- The stability of the Kenyan Shilling, having already gained by 1.0% YTD in 2019 and recording a 4-year high of Kshs 99.7 against the dollar during the period under review, reflecting a more stable economic environment,
- Considering the government is currently behind its domestic borrowing schedule having borrowed Kshs 220.4 bn against a pro-rated target of Kshs 226.6 bn, we believe the MPC will maintain the CBR at the current rate with a bias to further easing in order to continue accessing domestic debt at cheaper rates. This, however, might have adverse effects of further crowding out of the private sector.
For more information on our expectation for the MPC meeting decision, see our March MPC note.
The Federal Reserve Bank (Fed) of the U.S, through its Federal Open Market Committee (FOMC), has maintained its benchmark policy rate within a band of 2.25% - 2.50% during its March meeting. The Fed also discarded earlier promises it had made on further gradual rate increases. The decision rides on the back of fears of an economic slowdown, highlighted by the Fed. This slowdown has been attributed to the growing uncertainty around trade relations between the US and China, further triggering falling factory output. In addition, the Fed also highlighted that beginning May it would slow down the monthly reduction of its Treasury bonds holdings to USD 15.0 bn, from the previous USD 30.0 bn, a move aimed at adjusting to the weaker global economic growth. We expect the Fed’s decision not to hike the rates further to offer a reprieve for emerging markets, which would have had to contend with foreign investors repatriating their capital seeking more favorable terms in the US market and a strengthening US Dollar.
Inflation Projection:
We are projecting the y/y inflation rate for the month of March to come in within the range of 3.6% - 4.0%, a decline compared to 4.1% recorded in February. The m/m inflation for the month of February is however expected to rise due to the following factors:
- A rise in the food and non-alcoholic beverages index, which has a weighting of 36.0%, mainly driven by the rise in food prices with a significant rise being recorded in tomato prices,
- A rise in the transport index, which has a weight of 8.7%, with petrol prices having increased by 1.3% to Kshs 101.4, from Kshs 100.1 per litre previously, while diesel recorded a 0.7% rise to Kshs 96.6 from Kshs 96.0 per litre, previously,
- A rise in the housing, water, electricity, gas and other fuels index, following the 3.1% rise in kerosene prices to Kshs 99.5 per litre from Kshs 96.5 per litre, previously.
Rates in the fixed income market have remained stable as the government rejects expensive bids, being currently 4.1% ahead of its domestic borrowing target for the current financial year, having borrowed Kshs 242.2 bn against a pro-rated target of Kshs 232.6 bn. A budget deficit is likely to result from depressed revenue collection, creating uncertainty in the interest rate environment as additional borrowing from the domestic market goes to plug the deficit. Despite this, we do not expect upward pressure on interest rates due to increased demand for government securities, driven by improved liquidity in the market owing to the relatively high debt maturities. Our view is that investors should be biased towards medium-term fixed income instruments to reduce duration risk associated with long-term debt, coupled with the relatively flat yield curve on the long-end due to saturation of long-term bonds.
Market Performance:
During the week, the equities market recorded mixed performances with NASI and NSE 25 gaining by 1.2% and 1.0%, respectively, while NSE 20 declined by 0.3%, taking their YTD performance to gains of 13.9%, 1.9%, and 12.0%, for NASI, NSE 20 and NSE 25, respectively. The performance in NASI was driven by gains in large-cap stocks such as Standard Chartered Bank Kenya, Co-operative Bank of Kenya, EABL and Safaricom, which gained by 10.0%, 4.0%, 2.9%, and 1.4%, respectively.
Equities turnover rose by 12.2% during the week to USD 34.3 mn, from USD 30.7 mn the previous week, taking the YTD turnover to USD 415.6 mn. Foreign investors remained net buyers for the week, with a net buying position of USD 2.7 mn, an 18.2% decline from last week’s net buying position of USD 3.3 mn.
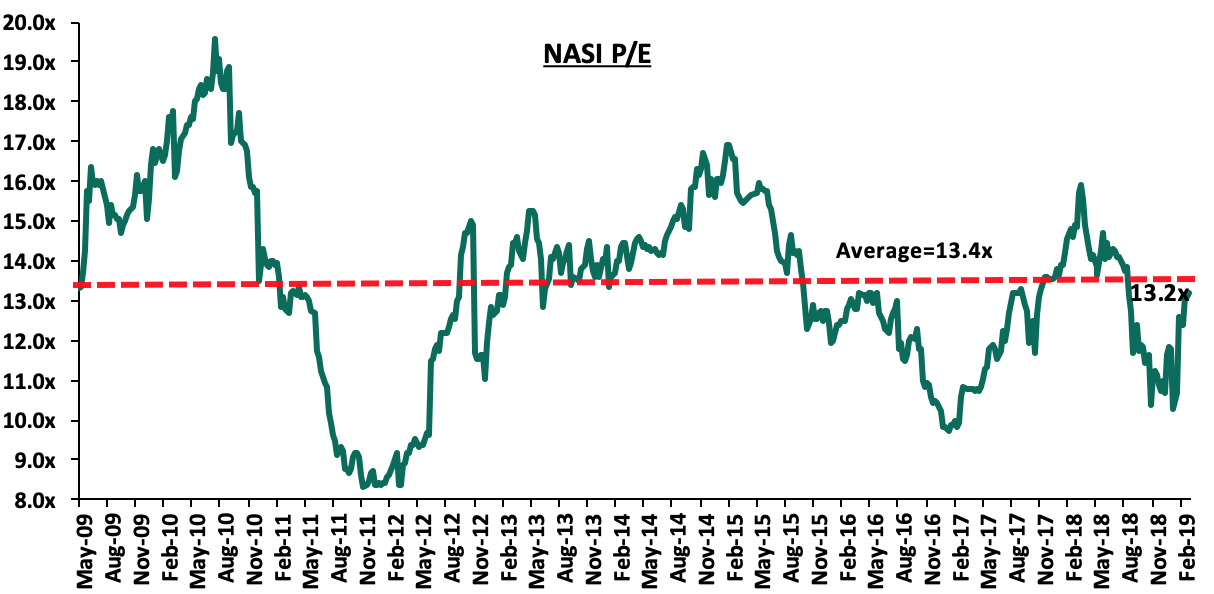
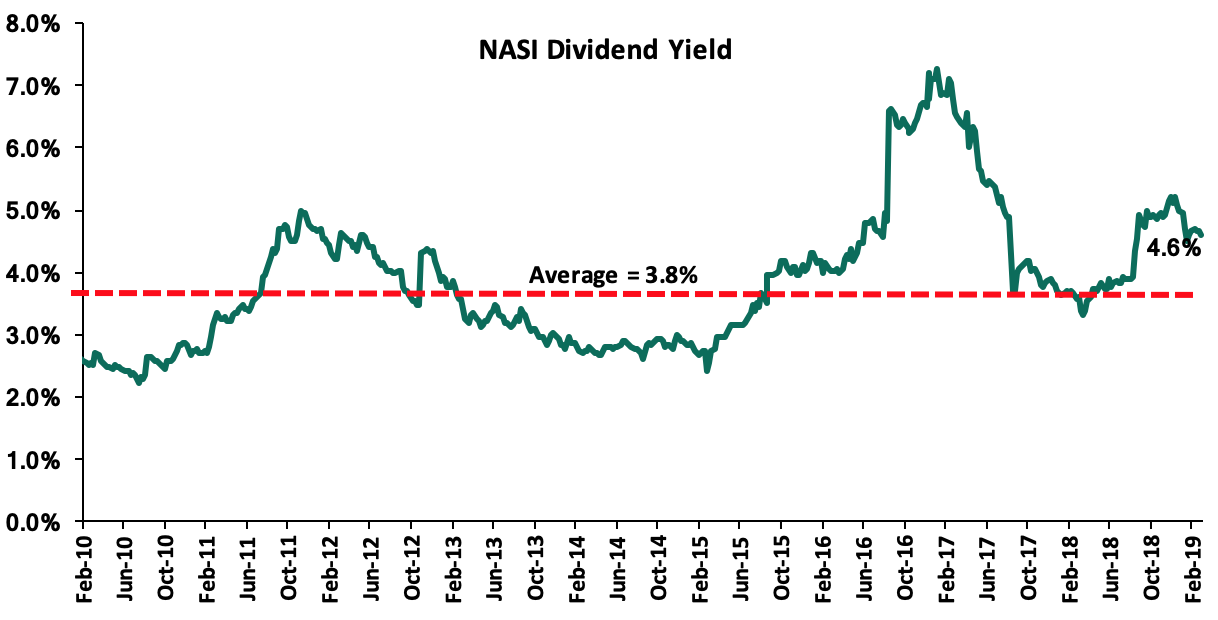
The market is currently trading at a price to earnings ratio (P/E) of 13.2x, 1.2% below the historical average of 13.4x, and a dividend yield of 4.6%, above the historical average of 3.8%. With the market trading at valuations below the historical average, we believe there is value in the market. The current P/E valuation of 13.2x is 36.2% above the most recent trough valuation of 9.7x experienced in the first week of February 2017, and 59.2% above the previous trough valuation of 8.3x experienced in December 2011. The charts below indicate the historical P/E and dividend yields of the market.
Earnings Releases
Standard Chartered Bank Kenya released their FY’2018 financial results:
Standard Chartered Bank Kenya released their FY’2018 financial results, with core earnings per share increasing by 17.1% to Kshs 23.6, from Kshs 20.1 in FY’2017, in line with our expectation of a 16.0% increase to Kshs 23.3. The performance was driven by a 4.6% increase in total operating income, coupled with a 3.0% decline in total operating expenses. The variance in core earnings per share growth against our expectations was due to the 3.0% decline in total operating expenses to Kshs 16.8 bn, from Kshs 17.3 bn in FY’2017, which slightly exceeded our expectation of a 2.0% decline. Highlights of the performance from FY’2017 to FY’2018 include:
- Total operating income increased by 4.6% to Kshs 28.6 bn from Kshs 27.3 bn in FY’2017. The rise was due to a 4.9% increase in Non-Funded Income (NFI) to Kshs 9.2 bn from Kshs 8.8 bn in FY’2017, coupled with a 4.5% increase in Net Interest Income (NII) to Kshs 19.4 bn, from Kshs 18.6 bn in FY’2017,
- Interest income rose by 2.3% to Kshs 26.9 bn, from Kshs 26.3 bn in FY’2017. This was driven by a 9.9% growth in interest income from government securities to Kshs 12.5 bn, from Kshs 11.3 bn in FY’2017. There was however a 3.2% decline in interest income on loans and advances to Kshs 13.1 bn, from Kshs 13.6 bn in FY’2017, attributable to the 6.7% decline in the loan book, coupled with the decline in yields on loans due to the two Central Bank Rate (CBR) cuts in 2018. The yield on interest-earning assets however declined to 10.5%, from 11.2% in FY’2017, attributed to a decline in yields on government securities as well as the decline in lending rates,
- Interest expense declined by 3.0% to Kshs 7.5 bn, from Kshs 7.7 bn in FY’2017, following a 10.0% decline in other interest expenses to Kshs 976.3 mn from Kshs 1.1 bn in FY’2017. Interest expense on customer deposits however rose marginally by 0.4% to Kshs 6.44 bn from Kshs 6.41 bn in FY’2017. Consequently, cost of funds declined to 3.3% from 3.7% in FY’2017, with the Net Interest Margin (NIM) declining to 7.5%, from 7.9% in FY’2017,
- Non-Funded Income (NFI) increased by 4.9% to Kshs 9.2 bn, from Kshs 8.8 bn in FY’2017. The increase was mainly driven by a 16.4% rise in other fees and commissions to Kshs 5.1 bn, from Kshs 4.4 bn in FY’2017, coupled with a 6.9% rise in forex trading income to Kshs 2.8 bn, from Kshs 2.7 bn. The revenue mix remained unchanged at 68:32 funded to non-funded income, owing to a comparable increase in NII and NFI,
- Total operating expenses declined by 3.0% to Kshs 16.8 bn, from Kshs 17.3 bn, largely driven by a 53.9% decline in loan loss provisions to Kshs 1.9 bn from Kshs 4.2 bn. The large decline in loan loss provisions was however offset by a 9.5% rise in staff costs to Kshs 7.4 bn from Kshs 6.7 bn in FY’2017, and a 17.3% rise in other operating expenses to Kshs 7.5 bn from Kshs 6.4 bn,
- The Cost to Income Ratio (CIR) improved to 58.6%, from 63.2% in FY’2017. Without LLP, the cost to income deteriorated to 51.8%, from 47.9% in FY’2017,
- Profit before tax increased by 17.6% to Kshs 11.9 bn, from Kshs 10.1 bn in FY’2017. Profit after tax grew by 17.1% to Kshs 8.1 bn in FY’2018, from Kshs 6.9 bn in FY’2017, as the effective tax rate increased marginally to 31.6% from 31.3% in FY’2017,
- The bank recommends a first and final dividend of Kshs 19.0 per share; this is an 11.8% rise from the Kshs 17.0 per share paid in FY’2017, which translates to a dividend yield of 9.4%, and a payout ratio of 80.6%,
- The balance sheet recorded a slight contraction as total assets declined by 0.1% to Kshs 285.4 bn, from Kshs 285.7 bn in FY’2017. This decline was largely driven by a 10.7% decline in government securities to Kshs 98.7 bn, from Kshs 110.5 bn in FY’2017, coupled with a 6.1% decline in net loans and advances to customers to Kshs 118.7 bn from Kshs 126.3 bn in FY’2017. The decline was however mitigated by a 74.8% increase in placements to Kshs 37.5 bn, from Kshs 21.5 bn in FY’2017,
- Total liabilities declined marginally by 0.5% to Kshs 238.8 bn from Kshs 240.1 bn in FY’2017. This was driven by a 98.8% decline in placements to Kshs 0.2 bn, from Kshs 12.7 bn in FY’2017, possibly due to the bank opting to reduce placement liabilities and consequently the associated interest expenses, on the back of a removal of the floor of interest payable on deposits, as they seek to utilize the relatively cheaper deposit funding. This was however mitigated by a 5.1% rise in deposits to Kshs 224.2 bn, from Kshs 213.4 bn in FY’2017. Deposits per branch increased by 11.1% to Kshs 6.6 bn, from Kshs 4.9 bn previously, with the number of branches as at the end of 2018 being 34, a decline from 36 as at end of 2017,
- The rise in deposits coupled with the decline in loans led to a decline in the loan to deposit ratio to 52.9%, from 59.2% in FY’2017,
- Gross Non-Performing Loans (NPLs) increased by 22.9% to Kshs 21.7 bn in FY’2018, from Kshs 17.6 bn in FY’2017. Consequently, the NPL ratio deteriorated to 16.3% in FY’2018 from 12.6% in FY’2017. The NPL coverage declined to 67.0% in FY’2018, from 74.4% in FY’2017, as provisions declined despite the rise in NPLs, as the bank utilized the shareholder's equity for the impairments, as allowed in the initial year of implementation of the new IFRS 9 accounting framework,
- Shareholders’ funds increased by 2.1% to Kshs 46.6 bn in FY’2018 from Kshs 45.7 bn in FY’2017, attributable to a 2.3% rise in capital grants to Kshs 1.93 bn, from Kshs 1.89 bn in FY’2017,
- Standard Chartered Bank is currently sufficiently capitalized with a core capital to risk-weighted assets ratio of 16.5%, 6.0% points above the statutory requirement of 10.5%. In addition, the total capital to risk-weighted assets ratio was 19.5%, exceeding the statutory requirement of 14.5% by 5.0% points. Adjusting for IFRS 9, the core capital to risk-weighted assets stood at 16.6%, while total capital to risk-weighted assets came in at 19.7%,
- The bank currently has a Return on Average Assets (ROaA) of 2.8%, and a Return on Average Equity (ROaE) of 17.5%.
Key Take-Outs:
- There was a decline in efficiency levels as the cost to income ratio without LLP worsened to 51.8% from 47.9% in FY’2017. The deterioration was largely attributable to a 9.5% rise in staff costs coupled with a 17.3% rise in other operating expenses, which depressed the bottom line. The rising inefficiency was largely due to the bank’s investment in the development of robust ICT systems so as to enhance service delivery to clients,
- The bank’s asset quality deteriorated, with the NPL ratio rising to 16.3%, from 12.6% in FY’2017. The deteriorating NPL ratio is attributable to a 22.9% rise in gross non-performing loans to Kshs 21.7 bn, from Kshs 17.6 bn in FY’2017m due to recovery problems of loans made to key troubled sectors such as real estate and manufacturing, and,
- There was an 11.4% rise in NFI to Kshs 9.2 bn, from Kshs 8.8 bn in FY’2017, despite the implementation of the Effective Interest Rate (EIR) under IFRS 9, which has seen the bank amortize fees charged on loans over future period of a loan’s tenor leading to a decline in NFI’s in FY’2018. Fees and commissions on loans and advances recorded a 112.5% rise to Kshs 326.1 mn from Kshs 153.4 mn in FY’2017.
For more information, please see our Standard Chartered Bank FY’2018 Earnings Note
Co-operative Bank of Kenya released their FY’2018 financial results:
Co-operative Bank of Kenya released their FY’2018 financial results, with core earnings per share increasing by 11.6% to Kshs 2.2 from Kshs 1.9 in FY’2017, in line with our projections. The performance was driven by a 5.0% increase in total operating income, which outpaced the 1.4% increase in total operating expenses. Highlights of the performance from FY’2017 to FY’2018 include:
- Total operating income increased by 5.0% to Kshs 43.7 bn, from Kshs 41.6 bn in FY’2017. This was due to a 9.5% increase in Net Interest Income (NII) to Kshs 30.8 bn, from Kshs 28.1 bn in FY’2017, which outweighed the 4.4% decline in Non-Funded Income (NFI) to Kshs 12.9 bn, from Kshs 13.5 bn in FY’2017,
- Interest income increased by 6.6% to Kshs 43.0 bn, from Kshs 40.4 bn in FY’2017. This was driven by a 19.2% growth in interest income from government securities to Kshs 9.8 bn, from Kshs 8.2 bn in FY’2017, a 3.1% increase in interest income from loans to Kshs 33.0 bn from Kshs 31.9 bn, and a 32.8% increase in interest income on placement assets to Kshs 0.3 bn, from Kshs 0.2 bn in FY’2017. Consequently, the yield on interest-earning assets rose marginally to 12.70%, from 12.65% in FY’2017,
- Interest expenses declined marginally by 0.2% to Kshs 12.2 bn from Kshs 12.3 bn in FY’2017, following a 40.8% decrease in the interest expense on placement liabilities to Kshs 0.1 bn from Kshs 0.2 bn in FY’2017. The decline in interest expense was however weighed down by the 1.6% increase in other interest expenses to Kshs 1.22 bn, from Kshs 1.20 bn in FY’2017, and the 0.4% increase in interest expense on customer deposits to Kshs 10.9 bn from Kshs 10.85 bn in FY’2017. Consequently, the cost of funds declined to 3.8% from 4.1% in FY’2017. Thus, the Net Interest Margin (NIM) improved to 9.5%, from 8.8% in FY’2017,
- Non-Funded Income (NFI) declined by 4.4% to Kshs 12.9 bn, from Kshs 13.5 bn in FY’2017. The decline was mainly caused by the 77.8% decline in fees and commissions on loans to Kshs 0.6 bn from Kshs 2.6 bn in FY’2017, which management attributed to the implementation of the Effective Interest Rate (EIR) model under IFRS 9, which requires banks to amortize the fees and commissions on loans, throughout the tenor of a loan. The decline in NFI was also caused by the 24.5% decline in other income, to Kshs 1.1 bn from Kshs 1.5 bn in FY’2017, which management attributed to reduced recoveries in 2018, compared to 2017. The decline in NFI was however mitigated by the 23.9% increase in other fees and commissions to Kshs 8.9 bn, from Kshs 7.2 bn in FY’2017, attributable to increased transactional revenue from agency banking, and the digital channels, coupled with the 2.4% increase in forex trading income to Kshs 2.3 bn, from Kshs 2.2 bn in FY’2017. The revenue mix shifted to 70:30 funded to non-funded income, from 68:22, owing to the decline in NFI coupled with the growth in NII,
- Total operating expenses rose by 1.4% to Kshs 25.7 bn, from Kshs 25.3 bn in FY’2017, largely driven by a 13.4% increase in staff costs to Kshs 11.4 bn in FY’2018, from Kshs 10.1 bn in FY’2017. The jump in staff costs was attributed to new specialized hires in data & big data analytics, machine learning and artificial intelligence from major IT firms such as IBM. In addition, other operating expenses also rose by 6.7% to Kshs 12.4 bn in FY’2018, from Kshs 11.6 bn in FY’2017. The increase in total operating expenses was however mitigated by the 48.9% decline in Loan Loss Provisions (LLP) to Kshs 1.8 bn from Kshs 3.6 bn in FY’2017,
- The Cost to Income Ratio (CIR) improved to 58.8%, from 60.9% in FY’2017. However, without LLP, the cost to income ratio deteriorated to 54.6%, from 52.2% in FY’2017, highlighting the significant decline in the cost of risk to 4.2% from 8.7% in FY’2017,
- Profit before tax increased by 10.7% to Kshs 18.2 bn, up from Kshs 16.4 bn in FY’2017. Profit after tax grew by 11.6% to Kshs 12.7 bn in FY’2018, from Kshs 11.4 bn in FY’2017, with the difference in growth attributable to the decline in the effective tax rate to 29.9% from 31.3% in FY’2017,
- The bank recommended a first and final dividend of Kshs 1.0 per share, a 25.0% increase from the Kshs 0.8 paid in FY’2017, which translates to a dividend yield of 6.5%, and a payout ratio of 46.1%,
- The balance sheet recorded an expansion as total assets increased by 6.9% to Kshs 413.4 bn from Kshs 386.9 bn in FY’2017. This growth was largely driven by a 10.4% increase in government securities to Kshs 80.3 bn from Kshs 72.7 bn in FY’2017, coupled with a 53.0% increase in other assets to Kshs 25.5 bn from Kshs 16.7 bn in FY’2017,
- However, the loan book contracted by 3.3% to Kshs 245.4 bn from Kshs 253.9 bn in FY’2017, which management attributed to repayment of approximately Kshs 8.0 bn by a single client in the real estate sector,
- Total liabilities rose by 8.1% to Kshs 342.2 bn from Kshs 316.6 bn in FY’2017, driven by a 6.5% increase in customer deposits to Kshs 306.1 bn from Kshs 287.4 bn in FY’2017, coupled with the 13.2% growth in borrowings to Kshs 24.0 bn, from Kshs 21.2 bn in FY’2017, as management highlighted that the bank drew Kshs 7.5 bn from the IMF facility of Kshs 15.0 bn in June 2018. The growth was however weighed down by the 89.8% decline in placement liabilities to Kshs 0.4 bn from Kshs 4.4 bn in FY’2017. Deposits per branch increased by 6.5% to Kshs 2.0 bn from Kshs 1.9 bn in FY’2017, as the number of branches remained the same at 155,
- The faster growth in deposits as compared to the decline in loans led to a decline in the loan to deposit ratio to 80.2% from 88.3% in FY’2017,
- Gross Non-Performing Loans (NPLs) increased by 56.7% to Kshs 29.4 bn in FY’2018 from Kshs 18.8 bn in FY’2017. The NPL ratio thus deteriorated to 11.3% in FY’2018 from 7.2% in FY’2017. General Loan Loss Provisions increased by 63.0% to Kshs 9.9 bn from Kshs 6.1 bn in FY’2017, and as a consequence, the NPL coverage improved to 48.1% in FY’2018 from 37.6% in FY’2017,
- Shareholders’ funds increased marginally by 0.4% to Kshs 69.9 bn in FY’2018 from Kshs 48.4 bn in FY’2017, as the 41.0% increase in the statutory loan loss reserve to Kshs 1.0 bn, from Kshs 0.7 bn in FY’2017, was weighed down by the 2.4% decline in the retained earnings to Kshs 54.0 bn from Kshs 55.3 bn in FY’2017,
- Co-operative Bank remains sufficiently capitalized with a core capital to risk-weighted assets ratio of 16.0%, 5.5% points above the statutory requirement. In addition, the total capital to risk-weighted assets ratio was 16.4%, exceeding the statutory requirement by 1.9% points. Adjusting for IFRS 9, the core capital to risk-weighted assets stood at 16.8%, while total capital to risk-weighted assets came in at 17.2%,
- The bank currently has a Return on Average Assets (ROaA) of 3.3%, and a Return on Average Equity (ROaE) of 18.3%.
Key Take-Outs:
- The bank’s asset quality deteriorated significantly, with the NPL ratio deteriorating to 11.3% from 7.2% in FY’2017, as the gross NPLs rose by 56.7%. According to management, the deterioration was largely due to major clients in the manufacturing, trade and real estate sectors. According to management, the increase in NPLs was mitigated by repayment of a Kshs 10.4 bn loan, which was almost non-performing, which highlights the relatively tougher operating environment of 2018,
- The bank’s Non-Funded Income shrunk by 4.4% y/y, with the decline attributed to the significant 77.8% decline in fees and commissions on loans. This, as earlier highlighted was largely due to the implementation of the EIR model under IFRS 9, which requires the amortization of the fees over the tenor of the loan. However, the bank’s alternative channels aided in NFI generation via transactional revenue, as alternative channels contributed to more than 88.0% of all transactions. With the banks NFI contribution to total income currently at 29.5%, this has shifted to below the current industry average of 33.8%, highlighting the existence of a headroom for the bank to grow its income this segment, and,
- The bank’s efficiency reduced as the CIR deteriorated to 54.6%, from 52.2% in FY’2017, which was mainly driven by the steep 13.4% increase in staff costs, coupled with the 6.7% increase in other operating expenses, which management attributed to increased hires especially in data analytics, machine learning and artificial intelligence, coupled with the payment of specialized licenses for the digital software and technology. Management advised that the bank would begin to reap the benefits of the digital investments from June 2019.
For more information, please see our Co-operative Bank FY’2018 Earnings Note
Diamond Trust Bank Kenya released their FY’2018 financial results:
Diamond Trust Bank Kenya released their FY’2018 financial results, with core earnings per share increasing by 2.3% to Kshs 25.3, from Kshs 24.8 in FY’2017, slower than our expectation of a 6.3% increase to Kshs 26.3 per share. The performance was driven by a 2.0% increase in total operating income, coupled with the 2.5% decline in total operating expenses. The variance in core earnings per share growth against our expectations was largely due to the slower than expected growth in total operating income, that expanded by 2.0%, against the expected 2.9%, coupled with the 4.2% points increase in the effective tax rate to 35.6% from 31.4% in FY’2017. Highlights of the performance from FY’2017 to FY’2018 include:
- Total operating income increased by 2.0% to Kshs 25.5 bn from Kshs 25.0 bn in FY’2017. This was due to a 1.8% increase in Net Interest Income (NII) to Kshs 20.0 bn, from Kshs 19.7 bn in FY’2017, coupled with the 3.0% increase in Non-Funded Income (NFI) to Kshs 5.4 bn, from Kshs 5.3 bn in FY’2017,
- Interest income increased by 1.8% to Kshs 35.3 bn from Kshs 34.6 bn in FY’2017. This was driven by a 10.8% growth in interest income from government securities to Kshs 13.0 bn, from Kshs 11.7 bn in FY’2017, coupled with a 29.8% increase in interest income from placement assets to Kshs 0.3 bn from Kshs 0.2 bn in FY’2017. The growth in interest income was however weighed down by the 3.1% decline in interest income from loans to Kshs 22.0 bn from Kshs 22.7 bn in FY’2017. However, the yield on interest-earning assets declined to 10.9% from 11.4% in FY’2017, largely due to the decline in yields on government securities, and the decline in yields on loans owing to the 100 bps cut in the Central Bank Rate (CBR),
- Interest expense rose by 2.0% to Kshs 15.3 bn from Kshs 15.0 bn in FY’2017, following a 62.1% increase in the interest expense on placement liabilities to Kshs 0.8 bn from Kshs 0.5 bn in FY’2017, coupled with the 2.4% increase in other interest expenses to Kshs 0.99 bn from Kshs 0.97 bn in FY’2017. The increase in interest expense was mitigated by the 0.3% decline in interest expense on customer deposits to Kshs 13.46 bn, from Kshs 13.50 bn in FY’2017. However, the cost of funds declined to 4.9% from 5.1% in FY’2017, due to the faster 3.5% increase in interest-bearing liabilities to Kshs 314.7 bn from Kshs 303.9 bn in FY’2017. The Net Interest Margin (NIM) declined to 6.2%, from 6.5% in FY’2017,
- Non-Funded Income (NFI) rose by 3.0% to Kshs 5.4 bn, from Kshs 5.3 bn in FY’2017. The increase was mainly driven by the 5.7% growth in the total fees and commissions to Kshs 3.4 bn from Kshs 3.2 bn in FY’2017. The growth in NFI was however weighed down by the 1.6% decline in forex trading income, to Kshs 1.57 bn from Kshs 1.6 bn in FY’2017. Owing to the comparable movement in both NII and NFI, the revenue mix remained 79:21, funded to non-funded income,
- Total operating expenses declined by 2.5% to Kshs 14.5 bn from Kshs 14.9 bn in FY’2017, largely driven by the 30.7% decline in Loan Loss Provisions (LLP) to Kshs 3.0 bn from Kshs 4.3 bn in FY’2017. Other operating expenses rose, with staff costs rising by 5.5% to Kshs 4.2 bn from Kshs 4.0 bn in FY’2017, coupled with an 11.0% increase in other operating expenses to Kshs 7.3 bn from Kshs 6.6 bn in FY’2017,
- The Cost to Income Ratio (CIR) improved to 56.9%, from 59.6% in FY’2017. However, without LLP, the cost to income ratio deteriorated to 45.2%, from 42.3% in FY’2017, highlighting the significant decline in the cost of risk to 11.7% from 17.2% in FY’2017,
- Profit before tax increased by 8.9% to Kshs 11.0 bn, up from Kshs 10.1 bn in FY’2017. Profit after tax grew by 2.3% to Kshs 7.1 bn in FY’2018, from Kshs 6.9 bn in FY’2017, with the effective tax rate rising to 35.6% from 31.4% in FY’2017,
- The bank recommended a first and final dividend of Kshs 2.6 per share, similar to that paid in FY’2017, which translates to a dividend yield of 1.9%, and a payout ratio of 10.9%,
- The balance sheet recorded an expansion as total assets increased by 4.0% to Kshs 377.7 bn from Kshs 363.3 bn in FY’2017. This growth was largely driven by a 2.6% increase in government securities to Kshs 117.3 bn from Kshs 114.4 bn in FY’2017, coupled with a 4.2% increase in other assets to Kshs 9.0 bn from Kshs 8.7 bn in FY’2017,
- However, the loan book contracted by 1.5% to Kshs 193.1 bn from Kshs 196.1 bn in FY’2017,
- Total liabilities rose by 2.9% to Kshs 318.8 bn from Kshs 309.7 bn in FY’2017, driven by a 6.2% increase in customer deposits to Kshs 282.9 bn from Kshs 266.3 bn in FY’2017. The growth was however weighed down by the 16.4% decline in placement liabilities to Kshs 17.1 bn from Kshs 20.5 bn in FY’2017, coupled with the 14.4% decline in borrowings to Kshs 14.7 bn from Kshs 17.2 bn in FY’2017. Deposits per branch increased by 4.0% to Kshs 2.0 bn from Kshs 1.9 bn in FY’2017, as the number of branches increased by 3 to 140 in 2018, from 137 in FY’2017,
- The faster growth in deposits as compared to loans led to a decline in the loan to deposit ratio to 68.3% from 73.6% in FY’2017,
- Gross Non-Performing Loans (NPLs) declined by 8.2% to Kshs 13.6 bn in FY’2018 from Kshs 14.8 bn in FY’2017. As a consequence, the NPL ratio improved to 6.7% in FY’2018 from 7.1% in FY’2017. General Loan Loss Provisions declined by 34.2% to Kshs 5.4 bn from Kshs 8.2 bn in FY’2017. Thus, the NPL coverage declined to 50.6% in FY’2018 from 67.5% in FY’2017,
- Shareholders’ funds increased by 10.9% to Kshs 53.7 bn in FY’2018 from Kshs 48.4 bn in FY’2017, largely due to the 17.1% increase in the retained earnings to Kshs 42.1 bn, from Kshs 35.9 bn in FY’2017,
- Diamond Trust Bank is currently sufficiently capitalized with a core capital to risk-weighted assets ratio of 18.7%, 8.2% points above the statutory requirement. In addition, the total capital to risk-weighted assets ratio was 21.1%, exceeding the statutory requirement by 6.6% points. Adjusting for IFRS 9, the core capital to risk-weighted assets stood at 19.6%, while total capital to risk-weighted assets came in at 22.0%,
- The bank currently has a Return on Average Assets (ROaA) of 1.8%, and a Return on Average Equity (ROaE) of 13.1%.
Key Take-Outs:
- The bank’s asset quality improved, with the NPL ratio improving to 6.7% from 7.1% in FY’2017, as the gross NPLs declined by 8.2%. This, coupled with the implementation of IFRS 9, which allowed the bank to charge a one-off provision on the equity, lead to an improved cost of risk to 11.7% from 17.2%, which was the key contributing factor to a decline in the bank’s total operating expenses, and consequently an improved bottom line,
- The bank’s Non-Funded Income expanded by 3.0% y/y, with the growth being derived largely from fees and commissions. However, the bank’s revenue remains skewed towards funded income, with NFI accounting for only 21.0% of total revenue, way below the industry average of 31.4% as at FY’2018, indicating there’s more room for the bank to exploit this income stream, and,
- The bank’s loan book shrunk by 1.5%, as the bank tightened its credit standards, opting to invest in government securities instead, which increased by 2.6%. Declining yields on government securities coupled with the 100 bps cut of the CBR have seen interest income remain compressed, as it grew by only 1.8%. This was further exacerbated by the 2.0% rise in interest expenses. Thus the bank growth may be hindered by continued preference to funded income, especially if the rate cap remains in place.
For more information, please see our Diamond Trust Bank FY’2018 Earnings Note
NIC Group released FY’2018 financial results:
NIC Group released its financial results, with core earnings per share increasing by 2.0% to Kshs 6.0 from Kshs 5.9 in FY’2017, below our expectation of a 3.9% increase to Kshs 6.1 per share. The performance was driven by a 1.9% increase in total operating income, which outweighed the 0.6% increase in total operating expenses. The variance in core earnings per share growth against our expectations was largely due to the 0.6% rise in total operating expenses to Kshs 9.4 bn, from Kshs 9.3 bn in FY’2017, which was not in line with our expectation of a 2.1% decline. Highlights of the performance from FY’2017 to FY’2018 include:
- Total operating income increased by 1.9% to Kshs 15.2 bn from Kshs 14.9 bn in FY’2017. The marginal rise was due to an 11.4% increase in Non-Funded Income (NFI), coupled with a 1.8% decline in Net Interest Income (NII) to Kshs 10.6 bn, from Kshs 10.8 bn in FY’2017,
- Interest income rose by 4.8% to Kshs 19.3 bn, from Kshs 18.4 bn in FY’2017. This was driven by a 31.2% growth in interest income from government securities to Kshs 6.8 bn, from Kshs 5.2 bn in FY’2017. The growth, however, was subdued by the 6.1% decline in interest income on loans and advances to Kshs 12.3 bn, from Kshs 13.1 bn in FY’2017. The yield on interest-earning assets, however, declined to 10.4%, from 10.8% in FY’2017, attributed to a decline in yields on government securities as well as a decline in lending rates due to the two Central Bank Rate (CBR) cuts in 2018,
- Interest expense increased by 14.1% to Kshs 17.5 bn, from Kshs 15.3 bn in FY’2017, following a 20.6% increase in the interest expense on customer deposits to Kshs 7.2 bn from Kshs 6.0 bn in FY’2017, significantly faster than the 4.0% increase in customer deposits, indicating that the bank may be paying relatively higher interest on deposits, as a strategy to attract deposits. Interest expense on deposits and placements from banking institutions however declined by 31.8% to Kshs 217.8 mn, from Kshs 319.1 mn in FY’2017. Consequently, cost of funds rose to 5.2% from 4.7% in FY’2017, with the Net Interest Margin (NIM) declining to 5.7%, from 6.3% in FY’2017,
- Non-Funded Income (NFI) increased by 11.4% to Kshs 4.6 bn, from Kshs 4.2 bn in FY’2017. The rise was mainly driven by a 10.2% rise in forex trading income to Kshs 1.3 bn from Kshs 1.2 bn, coupled with an 8.0% increase in fees and commissions on loans. Other incomes also rose by 20.2% to Kshs 853.9 mn from Kshs 710.3 mn in FY’2017. The revenue mix shifted to 70:30 funded to non-funded income, from 72:28 in FY’2017, owing to the faster growth in NFI, coupled with the decline in NII,
- Total operating expenses increased by 0.6% to Kshs 9.4 bn, from Kshs 9.3 bn, largely driven by a 13.6% rise in staff costs to Kshs 3.6 bn from Kshs 3.2 bn in FY’2017, and a 7.9% rise in other operating expenses to Kshs 3.4 bn from Kshs 3.2 bn. This offset the 21.0% decline in Loan Loss Provisions (LLP) to Kshs 2.4 bn in FY’2018, from Kshs 3.0 bn in FY’2017,
- Consequently, the Cost to Income Ratio (CIR) improved to 61.7%, from 62.5% in FY’2017. Without LLP, the cost to income however deteriorated to 46.3%, from 42.6% in FY’2017,
- Profit before tax increased by 4.0% to Kshs 5.8 bn, from Kshs 5.6 bn in FY’2017. Profit after tax grew by 2.0% to Kshs 4.2 bn in FY’2018, from Kshs 4.1 bn in FY’2017, as the effective tax rate increased to 27.4% from 26.0% in FY’2017,
- The bank recommended a first and final dividend of Kshs 1.25 per share; similar to that paid in FY’2017, which translates to a dividend yield of 3.4%, and a payout ratio of 20.8%,
- The balance sheet recorded an expansion as total assets increased by 1.1% to Kshs 208.5 bn from Kshs 206.2 bn in FY’2017. This growth was largely driven by a 12.9% increase in government securities to Kshs 61.2 bn, from Kshs 54.2 bn in FY’2017, coupled with a 25.8% increase in cash and cash balances to Kshs 12.0 bn from Kshs 9.5 bn in FY’2017. This growth was however offset by the 57.7% decline in placements to Kshs 5.3 bn from Kshs 12.4 bn in FY’2017 and a 1.4% decline in the loan book to Kshs 118.1 bn from Kshs 119.8 bn in FY’2017,
- Total liabilities rose marginally by 0.7% to Kshs 172.7 bn from Kshs 171.5 bn in FY’2017. This was driven by a 4.0% increase in deposits to Kshs 144.5 bn from Kshs 138.9 bn in FY’2017, coupled with an 18.4% decline in placements and a 12.7% decline in borrowings to Kshs 9.9 bn, and Kshs 14.9 bn from Kshs 12.1 bn, and Kshs 17.0 bn in FY’2017, respectively. Deposits per branch increased by 6.4% to Kshs 3.4 bn from Kshs 3.2bn with the number of branches as at the close of 2018 at 43 from 44 at the close of FY’2017,
- The rise in deposits coupled with the decline in loans led to a decline in the loan to deposit ratio to 81.7% from 86.2% in FY’2017,
- Gross Non-Performing Loans (NPLs) increased by 17.6% to Kshs 16.8 bn in FY’2018 from Kshs 14.3 bn in FY’2017. Consequently, the NPL ratio deteriorated to 13.4% in FY’2018 from 11.3% in FY’2017. The NPL coverage declined to 43.5% in FY’2018 from 45.7% in FY’2017, as provisions declined despite the rise in NPLs,
- Shareholders’ funds increased by 3.4% to Kshs 35.4 bn in FY’2018 from Kshs 34.3 bn in FY’2017, as retained earnings grew by 3.9% to Kshs 28.9 bn from Kshs 27.8 bn in FY’2017,
- NIC Group is currently sufficiently capitalized with a core capital to risk-weighted assets ratio of 19.5%, 9.0% points above the statutory requirement of 10.5%. In addition, the total capital to risk-weighted assets ratio was 21.2%, exceeding the statutory requirement of 14.5% by 6.7% points. Adjusting for IFRS 9, the core capital to risk-weighted assets stood at 19.3%, while total capital to risk-weighted assets came in at 20.9%,
- The bank currently has a Return on Average Assets (ROaA) of 2.0%, and a Return on Average Equity (ROaE) of 12.1%.
Key Take-Outs:
- There was an 11.4% rise in NFI’s, which is way ahead of most banks that have reported so far. This was despite the implementation of the Effective Interest Rate (EIR) under IFRS 9, which has seen the bank amortize fees charged on loans over future period of a loan’s tenor leading to a decline in NFI’s in FY’2018. NFI contribution to total operating income is slightly below the industrial average of 31.4% indicating room for growth of the income segment exists,
- The bank’s asset quality deteriorated, with the NPL ratio rising to 13.4% from 11.3% in FY’2017. The deteriorating NPL ratio is attributable to a 17.6% rise in gross non-performing loans to Kshs 16.8 bn from Kshs 14.3 bn in FY’2017, and,
- The Bank’s cost of funds continued to rise coming in at 5.2% from 4.7% in FY’2017, while the Net Interest Margin (NIM) declined to 5.7%, from 6.3% in FY’2017. This is mainly attributable to the bank accepting costly customer deposits, which saw interest in customer deposits increasing by 20.6% to Kshs 7.2 bn from Kshs 6.0% in FY’2017. It remains unclear why the bank continues to pay high cost on deposits – now at 5.2% compared to an industry average of 3.7%; and despite paying the highest cost of deposits, NIC Group is still registering the weakest deposit growth of 4.0% relative to the industry average of 7.7% deposit growth.
For more information, please see our NIC Group FY’2018 Earnings Note
A summary of the banking sector performance is highlighted in the table below:
|
Listed Banks Operating Metrics |
|||||||||||||||
|
Bank |
Core EPS Growth |
Interest Income Growth |
Interest Expense Growth |
Net Interest Income Growth |
Net Interest Margin |
Non-funded income Growth |
NFI to Total Operating Income |
Growth in Total Fee and Commissions |
Deposit Growth |
Growth in Govt Securities |
Cost to Income |
Loan to Deposit ratio |
Loan Growth |
Cost of Funds |
Return on average equity |
|
Stanbic |
45.7% |
13.8% |
19.2% |
14.0% |
5.0% |
18.3% |
45.1% |
15.5% |
13.5% |
3.7% |
59.5% |
79.7% |
22.1% |
3.5% |
14.3% |
|
KCB Group |
21.8% |
4.1% |
14.1% |
0.9% |
8.2% |
(0.1%) |
32.0% |
(25.3%) |
7.6% |
9.1% |
52.8% |
84.8% |
7.9% |
3.2% |
21.9% |
|
SCBK |
17.1% |
2.3% |
(3.0%) |
4.5% |
7.5% |
4.9% |
32.2% |
19.7% |
5.1% |
(10.7%) |
58.6% |
52.9% |
(6.1%) |
3.3% |
17.5% |
|
Co-op Bank |
11.6% |
6.6% |
(0.2%) |
9.5% |
9.5% |
(4.4%) |
29.5% |
(3.0%) |
6.5% |
10.4% |
58.8% |
80.2% |
(3.3%) |
3.8% |
18.3% |
|
Barclays Bank |
7.1% |
7.0% |
31.6% |
0.9% |
8.6% |
14.7% |
30.6% |
6.7% |
11.5% |
58.9% |
66.4% |
85.5% |
5.3% |
3.5% |
16.8% |
|
DTBK |
2.3% |
1.8% |
2.0% |
1.8% |
6.2% |
3.0% |
21.3% |
5.7% |
6.2% |
2.6% |
56.9% |
68.3% |
(1.5%) |
4.9% |
13.1% |
|
NIC Group |
2.0% |
4.8% |
14.1% |
(1.8%) |
5.7% |
11.4% |
30.5% |
9.2% |
4.0% |
12.9% |
61.7% |
81.7% |
(1.4%) |
5.2% |
12.1% |
|
2018 Mkt cap Weighted Average |
16.0% |
5.4% |
10.1% |
4.3% |
7.8% |
4.3% |
31.4% |
(0.9%) |
7.7% |
12.3% |
58.3% |
76.8% |
2.8% |
3.7% |
17.8% |
|
2017 Mkt cap Weighted Average |
(1.0%) |
(2.4%) |
2.6% |
(3.8%) |
8.4% |
9.1% |
33.6% |
13.4% |
12.5% |
22.2% |
61.1% |
80.0% |
6.1% |
3.6% |
17.6% |
Key take-outs from the table above include:
- 7 banks have released results for FY’2018, and have recorded a 16.0% average increase in core Earnings Per Share (EPS), compared to a decline of 1.0% in FY’2017, and consequently, the Return on Average Equity (RoAE) rose to 17.8%, from 17.6% in FY’2017. All the banks that have released so far have recorded growths in their core EPS, with Stanbic Holdings recording the highest growth of 45.7%, and the lowest being NIC Group, which recorded a 2.0% growth y/y,
- The sector recorded weaker deposit growth, which came in at 7.7%, slower than the 12.5% growth recorded in FY’2017. Despite the slower deposit growth, interest expenses increased by 10.1%, indicating banks have been mobilizing expensive deposits, since placement liabilities declined by an average of 5.1% y/y from a 73.8% growth in FY’2017, indicating banks’preference of deposit funding, as opposed to placements, possibly due to the relatively lower cost, especially given the removal of the floor of interest payable on deposits. However, with the removal of the limit of interest payable on deposits, the associated interest expenses on deposits is expected to improve in 2019, and possibly improve the cost of funds,
- Average loan growth was anemic coming in at 2.8%, which was lower than 6.1% recorded in FY’2017, indicating that there was an even slower credit extension to the economy, due to sustained effects of the interest rate cap. Government securities on the other hand recorded a growth of 12.3% y/y, which was faster compared to the loans, albeit slower than 22.2% recorded in FY’2017. This indicates that banks’ continued preference towards investing in government securities, which offer better risk-adjusted returns. Interest income increased by 5.4%, compared to a decline of 2.4% recorded in FY’2017, as banks adapted to the interest rate cap regime, with increased allocations in government securities. The Net Interest Income (NII) thus grew by 4.3% compared to a decline of 3.8% in FY’2017,
- The average Net Interest Margin in the banking sector currently stands at 7.8%, down from the 8.0% recorded in FY’2017, despite the Net Interest Income increasing by 4.3% y/y. The decline was mainly due to the faster 12.3% increase in allocation to relatively lower yielding government securities, coupled with the decline in yields on loans due to the 100 bps Central Bank Rate (CBR) decline, and,
- Non-funded Income grew by 4.3% y/y, slower than 9.8% recorded in FY’2017. The growth in NFI was weighed down as total fee and commission growth declined marginally by 0.9%, slower than the 13.5% growth recorded in FY’2017. The growth in fee and commission income continued to be subdued by the slow loan growth, coupled with the implementation of the Effective Interest Rate (EIR) model under IFRS 9, which requires banks to amortize the fees and commissions on loans, over the tenor of the loan.
Weekly Highlights
KCB Group has highlighted its intention to set up subsidiaries in Somalia and DRC Congo, as the bank aims to increase its regional footprint to 10 countries in the Eastern African region. This comes on the back of highlighting its intention to venture into Ethiopia, with the Ethiopian market becoming increasingly liberalized due to the reforms being implemented by the government. The bank’s entry into the Somali market will however be hindered by the lack of proper government structures on the registration of persons, which makes the implementation of international regulations on anti-money laundering and terror financing prevention difficult. KCB Group plans to complete its entry into the DRC Market inorganically within 3 years via an acquisition; similar to the method used by Equity Group to venture into the market, where Equity Group acquired 79.8% of Pro Credit Bank, before raising the stake to 86.0% in April 2017. We view KCB Group’s increased focus on geographical diversification as a possible significant growth driver for the bank going forward, given the vast untapped markets such as Ethiopia, which is the fastest growing economy in Africa, averaging 10.3% over the last 10 years, and has a rapidly growing population, currently at more than 105.0 mn, presenting a huge market for the bank to drive its retail banking strategy. Furthermore, given the lack of price controls on loan pricing in these markets, this should see the bank expand it topline interest revenue, whose growth has slowed down owing to the implementation of the interest rate cap in Kenya, which is the bank’s largest market.
Universe of Coverage
Below is a summary of our SSA universe of coverage:
|
Banks |
Price as at 15/03/2019 |
Price as at 22/03/2019 |
w/w change |
YTD Change |
Target Price* |
Dividend Yield |
Upside/Downside** |
P/TBv Multiple |
|
Diamond Trust Bank |
138.0 |
135.5 |
(1.8%) |
(13.4%) |
283.7 |
1.9% |
111.3% |
0.7x |
|
GCB Bank |
4.0 |
4.0 |
0.0% |
(13.0%) |
7.7 |
9.5% |
102.5% |
0.9x |
|
CRDB |
125.0 |
125.0 |
0.0% |
(16.7%) |
207.7 |
0.0% |
66.2% |
0.4x |
|
Zenith Bank |
22.2 |
22.1 |
(0.7%) |
(4.3%) |
33.3 |
12.2% |
63.4% |
1.0x |
|
I&M Holdings |
90.0 |
94.3 |
4.7% |
10.9% |
138.6 |
3.7% |
50.8% |
0.9x |
|
UBA Bank |
7.7 |
7.8 |
2.0% |
1.3% |
10.7 |
10.9% |
48.1% |
0.5x |
|
KCB Group*** |
44.3 |
44.7 |
0.9% |
19.4% |
61.3 |
7.8% |
45.0% |
1.4x |
|
Access Bank |
6.0 |
6.9 |
15.1% |
0.7% |
9.5 |
5.8% |
44.5% |
0.4x |
|
Ecobank |
7.7 |
7.7 |
(0.1%) |
3.1% |
10.7 |
0.0% |
38.8% |
1.7x |
|
CAL Bank |
1.0 |
1.0 |
1.0% |
6.1% |
1.4 |
0.0% |
34.6% |
0.9x |
|
NIC Group |
37.1 |
37.0 |
(0.1%) |
33.1% |
48.8 |
2.7% |
34.6% |
1.0x |
|
Co-operative Bank |
15.0 |
15.6 |
4.0% |
8.7% |
19.9 |
6.4% |
34.4% |
1.3x |
|
Equity Group |
43.0 |
43.5 |
1.2% |
24.8% |
56.2 |
4.6% |
33.8% |
2.1x |
|
HF Group |
5.4 |
5.2 |
(4.4%) |
(6.1%) |
6.6 |
6.7% |
33.7% |
0.2x |
|
Stanbic Bank Uganda |
29.0 |
29.0 |
(0.1%) |
(6.5%) |
36.3 |
4.0% |
29.2% |
2.1x |
|
Union Bank Plc |
7.0 |
6.9 |
(2.1%) |
22.3% |
8.2 |
0.0% |
19.0% |
0.7x |
|
Bank of Kigali |
265.0 |
265.0 |
0.0% |
(11.7%) |
299.9 |
5.2% |
18.4% |
1.5x |
|
SBM Holdings |
6.0 |
6.0 |
0.0% |
0.7% |
6.6 |
5.0% |
14.3% |
0.9x |
|
Barclays Bank |
11.9 |
12.0 |
0.8% |
9.1% |
12.5 |
8.4% |
13.0% |
1.6x |
|
Guaranty Trust Bank |
35.4 |
37.5 |
5.9% |
8.9% |
37.1 |
6.4% |
5.3% |
2.2x |
|
Bank of Baroda |
130.0 |
130.0 |
0.0% |
(7.1%) |
130.6 |
1.9% |
2.4% |
1.1x |
|
Stanbic Holdings |
100.0 |
97.8 |
(2.3%) |
7.7% |
92.6 |
6.0% |
0.7% |
1.0x |
|
National Bank |
5.0 |
5.0 |
(1.4%) |
(7.0%) |
4.9 |
0.0% |
(1.0%) |
0.4x |
|
Standard Chartered |
21.0 |
20.0 |
(4.8%) |
(4.8%) |
19.5 |
0.0% |
(2.7%) |
2.6x |
|
Standard Chartered |
197.5 |
217.3 |
10.0% |
11.7% |
196.3 |
5.8% |
(3.9%) |
1.6x |
|
FBN Holdings |
8.2 |
8.3 |
0.6% |
3.8% |
6.6 |
3.0% |
(16.6%) |
0.5x |
|
Stanbic IBTC Holdings |
48.1 |
45.5 |
(5.4%) |
(5.1%) |
37.0 |
1.3% |
(17.4%) |
2.5x |
|
Ecobank Transnational |
13.5 |
13.4 |
(0.7%) |
(21.2%) |
9.3 |
0.0% |
(30.7%) |
0.5x |
|
*Target Price as per Cytonn Analyst estimates **Upside / (Downside) is adjusted for Dividend Yield ***Banks in which Cytonn and/or its affiliates holds a stake. ****Stock prices indicated in respective country currencies |
||||||||
We are “Positive” on equities for investors as the sustained price declines has seen the market P/E decline to below its historical average. We expect increased market activity, and possibly increased inflows from foreign investors, as they take advantage of the attractive valuations, to support the positive performance.
OneFi, a Nigeria-based FinTech firm that provides mobile loans to clients, announced plans to buy-out Amplified Payment System Limited (Amplify), a mobile payment solutions firm that provides platforms to connect banks based in Nigeria for an undisclosed amount. According to the announcement, OneFi will acquire Amplify’s intellectual property, staff and clientele, comprising of more than 1,000 merchants who transact on the platform. Amplify was set up in 2016 with an aim of becoming the primary technology enabler for digital financial services across Africa. OneFi targets to ease access to finance by leveraging data and technology. Their lending process is fully online via their Paylater mobile application. The new acquisition is expected to fasten OneFi’s transition from a primary mobile lender to a fully-fledged mobile-based consumer finance platform, and differentiate its services both locally and in the African region. There has been a rise in competition in the African FinTech sector from other FinTech start-ups such as Kenya’s M-PESA, that has expanded its mobile-money services to the global market in partnership with Western Union, the American financial services and communication company.
In recent years, FinTech has developed to be one of the most attractive investment sectors in Africa and continues to bear even more opportunities. In 2018, FinTech ranked the highest both in deal activity and transaction value among the sectors we are tracking below, having raised Kshs 27.0 bn of the total value of reported fundraising deals, which came in at Kshs 32.7 bn, with 10 transactions out of a total of 15 in the year.
|
2018 Private Equity Fundraising Activity by Sector |
||
|
Sector |
Funding Raised (Kshs bns) |
Entities Funded |
|
FinTech |
27.0 |
10 |
|
Financial Services |
2.8 |
3 |
|
Education |
4.9 |
2 |
|
Real Estate |
None Disclosed |
|
|
Hospitality |
None Disclosed |
|
|
Total |
34.7 |
15 |
Source: Cytonn Research, 2018
As developed countries adopt new standards in mobile banking, countries in Africa need not follow the historical trajectory (widespread branch networks, ATMs, etc.) but can jump straight to the new, and more efficient mobile infrastructure. Mobile payment solutions are available to those without a traditional bank account and there lies the opportunity for African financial technology companies.
The opportunity is as a result of two key factors;
- Rising Mobile Penetration: According to Global System for Mobile Communications (GSMA), a trade association that represents the interest of mobile network stakeholders globally, mobile penetration in Sub-Saharan Africa remains low, estimated to be 44.0% in 2017, well below the global average of 66.0%, with a total subscriber base of 444 million consumers, representing only 9.0% of subscribers globally. Mobile penetration is expected to grow to 47.0% and 52.0% by 2020 and 2025, respectively, driven by a rapid growth in smartphone adoption and opening up of rural markets in the region. Below is a projection of the Sub Saharan Mobile Subscription and Penetration according to the GSMA Report, 2018;
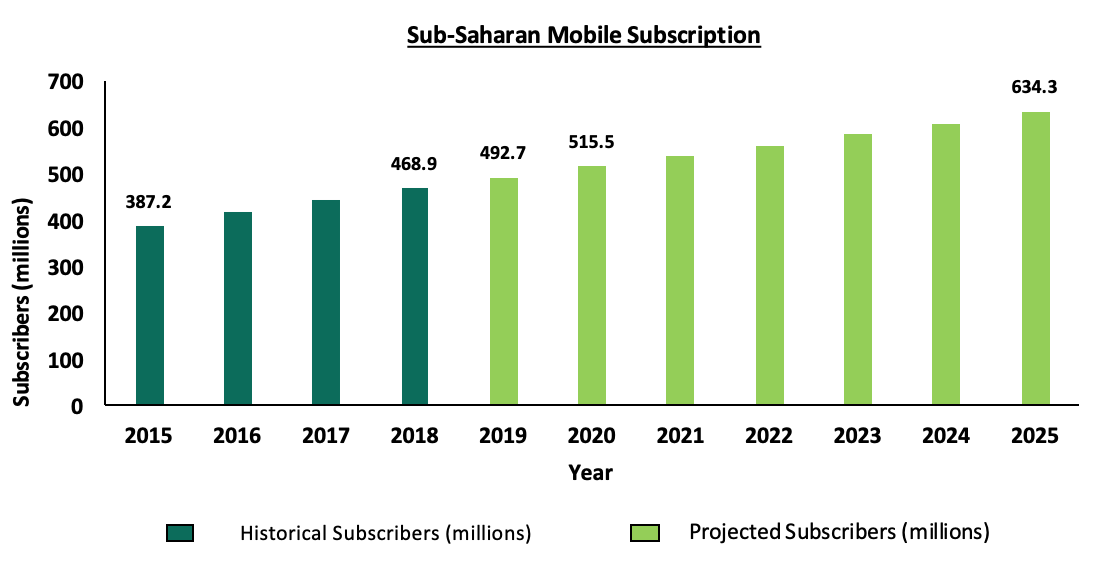
Source: The Mobile Economy Sub-Saharan Africa 2018 Report, GSMA
The regional mobile subscriber base is expected to grow at a CAGR of 4.8% between 2017 and 2022, from 443.7 mn in 2017 to 561.3 mn expected subscribers in 2022, achieving a penetration rate of 50% by 2023. High mobile penetration is expected to provide a channel for the development of mobile financial services. This is the case for Kenya where mobile penetration currently stands at 100.1% and as a result, the mobile activity has increased rapidly with the value of mobile money transactions reaching Kshs. 4.0 tn equivalent to 45.3% of the country’s GDP.
- Limited Access to Traditional Financial Services: According to the World Bank’s Global Findex Database, only 33.0% of the population in Sub-Saharan Africa have accounts in financial institutions compared to 94.0% in North America and 96.7% in Europe. In addition to this, insurance penetration is also lagging behind at 3.0% compared to 7.1% in North America and 6.4% in Europe.
Combined, these two factors present an untapped market for financial services products while also providing an efficient channel to deliver these services. As such, we expect the FinTech sector to continue to attract more investors into the African market space.
We maintain a positive outlook on private equity investments in Africa as evidenced by the increasing investor interest, which is attributed to; (i) economic growth, which is projected to improve in Africa’s most developed PE markets, (ii) attractive valuations in Sub Saharan Africa’s private markets compared to its public markets, and (iii) attractive valuations in Sub Saharan Africa’s markets compared to global markets. Going forward, the increasing investor interest, stable macro-economic and political environment will continue to boost deal flow into African markets.
- Master-Planned Developments
Beijing Damei Investment Company, a Chinese construction firm, this week, announced plans to build a master-planned development on 1,200-acres in Athi River, Machakos County, at an estimated cost of Kshs 200.0 bn. The project dubbed “Friendship City” will comprise of residential units, industrial parks, as well as social amenities such as hospitals and schools, with construction set to start this year. As lifestyles continue to evolve leaning towards convenience, master-planned developments are becoming popular in Kenya as they enable a live-work-play environment. Major master-planned developments include Tatu City, Northlands City, Leather City, Ngelani City, Cytonn’s Newtown City in Athi River and Riverrun Estates in Ruiru, and the Kenyan Government’s Konza City in Machakos County. Notably, Nairobi’s satellite towns, and in particular, Athi River, continue to attract such developments due to:
- Availability of vast supplies of land for development,
- Affordability of development land with the Satellite Towns posting an average price of Kshs 22.6 mn per acre in 2018, in comparison to Nairobi County’s average of Kshs 238.0 mn per acre,
- Better connectivity, creating easy access to industrial precincts for cargo transportation, especially with the Standard Gauge Railway and the ongoing plans of dualling Mombasa Road,
- Availability of a sewerage system in Mavoko County, allowing for densification,
- Machakos County’s designation for Special Economic Zones (SEZ), which has attracted foreign direct investments particularly in industrial developments due to the tax incentives offered to SEZs, and,
- Demand for residential units from the working class based in Mombasa Road and Athi River’s huge industrial sector. According to Cytonn Annual Markets Review 2018, Athi River’s residential market posted double-digit returns in 2018, with average total returns of 10.6% and average annual uptake of 23.6%, in comparison to the overall residential market’s average of 8.9% and 22.8%, respectively.
In spite of the factors mentioned above, the main inhibitor to the fast growth of master-planned developments has been inadequate infrastructure with most interior parts of satellite towns lacking proper passable roads and sewerage systems. Considering the ongoing drive for Special Economic Zones in line with Kenya’s Vision 2030 to industrialize to a middle-income country, as well as other mass housing projects that are underway, there is need for more emphasis on infrastructural improvement, being a critical enabler for development.
- Retail Sector
During the week, South Africa retailer, Shoprite, opened a second shop in Kenya at the Garden City Mall, along the Thika Superhighway, Nairobi, taking up a space of 40,000 SQFT, previously occupied by Nakumatt Holdings. The retailer launched their first Kenyan shop in December 2018 at the Westgate Mall with plans to launch in Mombasa County later in 2019 at the City Mall, Nyali. International retailers such as Shoprite, Game, and Carrefour have in the last 2-years tapped into prime stores vacated by poorly performing homegrown retailers such as Nakumatt and Uchumi, who have been facing operational difficulties including financial constraints, supply chain inefficiency, as well as poorly planned expansions. We attribute the increased interest by international retailers in mid-income countries like Kenya to the expanding middle-income class population, with increasing disposable incomes creating demand for differentiated retail products. In addition, there exists a huge opportunity for investment as formal retail penetration in Kenya remains relatively low at 30%—40%, according to a 2016 Oxford Business Group Report, in comparison to the developed markets such as South Africa with 60% penetration. The increased entry of multinational retailers is a welcome move for developers who have been experiencing increasing vacancy rates due to the traditional anchor tenants vacating huge spaces, which also leads to a decline in footfall for other mall occupants. This will also help in cushioning the market given the existing oversupply of retail space of 2.0 mn SQFT, as per Cytonn Research. According to our Annual Markets Review 2018, Nairobi retail market recorded an average occupancy of 79.9%, a 0.4% points decline from 80.3% in 2017, due to the oversupply in space and a tough economic environment particularly due to subdued private sector credit growth.
- Land
During the week, the Government of Kenya announced plans to incorporate blockchain technology into the lands digitization process in a bid to end human interference in the Lands Ministry. Blockchain technology refers to a decentralized public ledger that records transactions across many different computers across the internet with no central point. This makes it hard for any one individual to interfere with the data. This will help to track all land transactions in the country, leading to an efficient, transparent and fair system in a country where issues of land fraud have been rampant.
- Other Highlights:
The government has so far secured 9,800-acres across 18 Kenyan Counties, and is in a process of reclaiming grabbed state-owned land across the country, for the affordable housing programme. Furthermore, according to Housing Secretary, Mr. Patrick Bucha, Kshs 24.4 bn has also been availed for infrastructural development of roads, sewer systems and power lines on the land on which these housing units will be constructed. According to the Centre for Affordable Housing Finance in Africa, land and infrastructure costs in Kenya make up 10%-35% of total project costs, and continue to limit the development of affordable housing units given the continued increase in land prices, and inadequacy of infrastructure in several parts of the country. Therefore, by creating a land bank and providing the requisite infrastructure, this will be an impetus to the affordable housing initiative, as it will encourage joint ventures between the government and the private sector to drive the delivery of 500,000 homes by 2022.
We expect to continue witnessing innovative products being delivered within the real estate sector with the paradigm shift from conventional real estate due to (i) infrastructure improvement across all counties, (ii) cost of land in Nairobi and space oversupply in key traditional themes, and (iii) increased foreign direct investment, which demands differentiated real estate products that offer quality as well as convenience.
Ensuring economic growth and development is a primary objective of all countries. According to the World Bank, an estimated USD 4.0 trillion in annual investment is required for developing countries to achieve the Sustainable Development Goals (SDGs) by 2030. In light of the investment requirement, there is a greater need to develop and strengthen capital markets in order to mobilize commercial financing. The role that capital markets have in financing infrastructure development, large enterprises, and Small and Medium Enterprises (SMEs), and the links with economic growth, are increasingly being highlighted.
Economists traditionally have looked to factors such as capital, labor and technology as the major factors affecting economic growth. The recent financial crisis has shown that there are substantial economic effects when there is lack of confidence in the financial systems. Therefore, the functioning of financial systems has received special attention in academic literature in recent years. A well-functioning financial system permits an economy to fully exploit its growth potential, as it ensures that the best investment opportunities receive the necessary funding, while the inferior opportunities are denied capital; in this regard, we endeavor to investigate the role that capital markets play in economic development. This focus addresses the topic as follows:
- Introduction to Capital Markets, where we highlight the capital market framework, key players and products,
- How Capital Markets Facilitate Economic Development, where we look at the fundamental channels through which capital markets are connected to economic growth and development,
- Challenges of Developing Capital Markets, where we highlight the effects on the economy when capital markets don’t work as they are supposed to,
- Case Study - Capital Markets in South Africa, & Learnings for Kenya, and,
- Steps Kenya Should Take to Expand its Capital Markets as Complementary to Bank Funding
Section I: Introduction to Capital Markets
Capital markets are a general category of markets that facilitate the buying and selling of securities with medium-term and long-term maturity, of one year or more. Capital markets channel savings and investment between suppliers of capital and users of capital through intermediaries. Examples of these key players in the capital market’s process are:
- Suppliers of Capital: Also known as surplus units, suppliers receive more money than they spend or have immediate use for. They can be termed as investors. They provide their net savings to the financial markets for a return on the capital provided. Examples include retail investors and institutional investors,
- Financial Intermediaries: A financial intermediary is an institution or individual that serves as a middleman among diverse parties in order to facilitate financial transactions. Common types include commercial banks, investment banks, stockbrokers, fund managers, and stock exchanges,
- Users of Capital: Also known as deficit units, users of capital spend more money than they receive or need funds for investments or development. They are also termed as borrowers. They access funds from the capital markets. Examples include businesses, the government and individuals.
Products in the capital markets are also referred to as capital market securities. These are debt securities, with a maturity of more than one year, and equity securities. Funds received from these products are mostly used to purchase capital assets, such as buildings, equipment, or machinery. The key capital markets securities are as follows:
- Bonds: These are medium to long-term debt securities issued by firms and governments to raise large amounts of funds. Bonds are differentiated by the issuer and can be classified as Treasury bonds, municipal bonds, or corporate bonds,
- Equity Securities: An equity security represents ownership interest held by shareholders in an entity realized in the form of shares of capital stock, which includes shares of both common and preferred stock. They are classified as capital market securities because they have no maturity and therefore serve as a long-term source of funds.
Section II: How Capital Markets Facilitate Economic Development
The capital markets are a network of specialized financial institutions, series of mechanism, processes and infrastructure that in various ways facilitate the bringing together of suppliers and users of medium to long-term capital. Capital markets connect the monetary sector with the real sector, which is the sector of the economy concerned with the production of goods and services. Considering this role in the economy, the capital markets play an important role in economic development as they facilitate growth in the real sector by giving producers of goods and services, and entities tasked with infrastructure development. access to long-term financing.
The fundamental channels through which capital markets are connected to the economy, economic growth and development can be outlined as follows:
- Creating a Bridge Between Suppliers of Capital and Users: The contact between agents with a monetary deficit and the ones with monetary surplus can take place directly through direct financing, but also through a financial intermediary in form of indirect financing, which is a situation whereby specific operators facilitate the connection between the real economy and the financial market. In this case, the financial intermediaries could be banks, investment funds, pension funds, insurance companies, or other non-bank financial institutions,
- Promoting Saving and Investments: The capital markets increase the proportion of long-term savings (pensions, life covers, etc.) that is channeled to long-term investment. Capital markets enable the contractual savings industry (pension and provident funds, insurance companies, medical aid schemes, collective investment schemes, etc.) to mobilize long-term savings from small individual household and channel them into long-term investments. It fulfills the transfer function of current purchasing power, in monetary form, from surplus sectors to deficit sectors, in exchange for reimbursing a greater purchasing power in future. In this way, the capital markets enable corporations to raise funds to finance their investment in real assets. The implication will be an increase in productivity within the economy leading to more employment, increase in aggregate consumption and hence growth and development. It also helps in diffusing stress on the banking system by matching long-term investments with long-term capital. It encourages broader ownership of productive assets by small savers. It enables them to benefit from economic growth and wealth distribution, and provides avenues for investment opportunities that encourage a thrift culture critical in increasing domestic savings and investments that translate to economic growth,
- Facilitating Efficient Allocation of Scarce Financial Resources: The capital markets facilitate the efficient allocation of scarce financial resources by offering a large variety of financial instruments with different risk and return characteristics. This competitive pricing of securities and large range of financial instruments allows investors to better allocate their funds according to their respective risk and return appetites, thereby supporting economic growth,
- Financing Utility and Infrastructure Development: The capital markets also provide equity capital, debt capital and infrastructure development capital that have strong socio-economic benefits through development of essential utilities such as roads, water and sewer systems, housing, energy, telecommunications, public transport, etc. These projects are ideal for financing through the capital markets via long dated bonds and asset backed securities. Infrastructure development is a necessary condition for long-term sustainable growth and development. In addition, capital markets increase the efficiency of capital allocation by ensuring that only projects that are deemed profitable can successfully attract funds. This will, in turn, improve competitiveness of domestic industries and enhance ability of domestic industries to compete globally, given the current momentum towards global integration. The result will be an increase in domestic productivity which may spill over into an increase in exports and, therefore, economic growth and development,
- Financing Private Public Partnerships, “PPPs”: Capital markets promote PPPs, thereby encouraging participation of private sector in productive investments. The need to shift economic development from public to private sector to enhance economic productivity has become inevitable as resources continue to diminish. It assists the public sector to close the resource gap, and complement its effort in financing essential socio-economic development, through raising long-term project-based capital. It also attracts foreign portfolio investors who are critical in supplementing the domestic savings levels and who facilitate inflows of foreign financial resources into the domestic economy, thereby supporting economic growth.
Section III: Challenges of Developing Capital Markets
Economic growth in a modern economy hinges on an efficient and effective financial sector that pools domestic savings and mobilizes capital for productive projects. The absence of effective capital markets could leave most productive projects that carry developmental agendas unexploited. However, there are challenges in developing capital markets as they are to a large extent dependent on the level of economic and structural development of a country. Factors affecting the development of capital markets include;
- Country Fundamentals: The size of the economy in terms of aggregate gross domestic product and per capita income affect the development of capital markets. This explains in large part why, in general, capital markets are at an embryonic stage in smaller and low-income countries, while more developed countries have more robust capital markets. This can be explained as more developed economies have greater institutional development, a larger institutional investor base, higher levels of contractual savings such as pension funds, political stability and macroeconomic stability.
- Macroeconomic Policies Framework: An essential condition for well-functioning capital markets is the existence of sound macroeconomic policy frameworks. Capital markets depend on investor confidence. Strong institutions thrive in stable macroeconomic conditions and investors can also be confident that their capital will not be eroded by factors such as hyper-inflation and exchange rate risks when there is a strong macroeconomic framework in place.
- Access to Information: Access to information is a major factor that affects the development of capital markets. Access to information gives investors’ confidence in the functioning of the capital markets. Access to information and transparency allows for the monitoring of users of funds, which increases investor confidence.
- Regulatory Framework: To reliably extract the benefits of well-functioning markets, adequate regulation of users of funds, investors, and intermediaries in addition to robust supervisory arrangements to protect investors, promote deep and liquid markets, and manage systemic risk are critical.
- Efficient Market Infrastructure: Lack of adequate and efficient market infrastructure for issuing, trading, clearing and settlement is a major issue for capital market development as it pushes away potential investors to an economy.
- Knowledge of Retail Investors: The lack of investor education for retail investors is another factor affecting the development of capital markets. It is important to educate retail investors on investment products and the benefits of saving, in order to channel savings to the capital markets.
Section IV: Case Study - Capital Markets in South Africa, & Learnings for Kenya
According to the Africa Financial Markets Index 2018, by Absa Group, while most capital markets in African countries are relatively underdeveloped, those countries which introduced reforms that are geared towards development of capital markets have been able to grow at relatively higher and sustainable rates. The Africa Financial Markets Index tracks progress on financial market developments of selected African countries annually across a range of indicators. These indicators are; (i) market depth, (ii) access to foreign exchange, (iii) tax and regulatory environment, (iv) market transparency, (v) capacity of local investors, (vi) macroeconomic opportunity, and (vii) legality and enforceability of standard financial markets master agreements. According to the first report published in 2017 and the subsequent report in 2018, South Africa ranked first in both occasions as the most developed financial market in Africa, hence the reason we have picked it as a case study.
A summary of rankings from the report is highlighted in the table below, where the higher the score the more developed the capital markets are based on the indicators above:
|
ABSA Africa Financial Markets Index |
|||
|
2017 |
2018 |
||
|
Country |
Aggregate Score |
Country |
Aggregate Score |
|
South Africa |
92 |
South Africa |
93 |
|
Mauritius |
66 |
Botswana |
65 |
|
Botswana |
65 |
Kenya |
65 |
|
Namibia |
62 |
Mauritius |
62 |
|
Kenya |
59 |
Nigeria |
61 |
According to the African Capital Markets Watch 2018 report by PWC, South Africa again ranks as the most active capital market on the continent. This is supported by a strong financial markets infrastructure and robust legal and regulatory frameworks. The South African capital markets consists of:
- Equities: The Johannesburg Stock Exchange (JSE) is the largest exchange in Africa with over 400 listed firms and a market capitalization of USD 13.7 tn,
- Bonds: The South African-listed bond market is estimated to be ZAR 2.7 tn (USD 186.4 bn). It is largely dominated by bonds issued by National Treasury, which account for 68.4% of the outstanding debt, followed by bonds issued by the financial sector (16.0%) and state-owned entities [parastatals] (11.2%). In terms of turnover, the monthly average amount traded on the JSE is ZAR 2.3 tn (USD 158.8 bn),
- Derivatives: Derivatives are traded in exchanges under the umbrella of the JSE, and over-the-counter (OTC). Exchange-traded products are standardized, and free of counterparty risk. The JSE permits trading in equity, commodity (mainly agricultural), currency, and interest rate derivatives,
- Real Estate: South Africa has the largest and most established REITs market in Africa. The South African listed property sector has a market capitalization of approximately ZAR 380.0 bn (USD 26.2 bn) at the end of 2016, which is 6.4% of GDP.
South Africa continues to lead capital markets in Africa, supported by a strong financial markets infrastructure and a robust legal framework. South Africa has developed its capital markets by;
- Establishing Progressive Policies: South Africa has established progressive policies that support the development of financial markets such as the ‘twin peaks’ strategy for improving financial regulation, which separates regulatory functions between a regulator that performs prudential supervision and one that performs market conduct supervision. This separation clearly defines the objectives and mandates of the respective agencies and also separates the role of regulator and promoter.
- Promoting Investor Education and Financial Inclusion: South Africa has also introduced frameworks to increase financial literacy with South Africa’s newly-created Financial Sector Conduct Authority established to supervise financial markets and promote financial education. Its consumer education department holds workshops on financial literacy and investor education, particularly in rural areas and among groups that have been excluded from financial services.
- Adopting Standardized International Markets Framework: South Africa also uses international markets and standardized frameworks to develop its capital markets such as the Master Agreement of the International Swaps and Derivatives Association, the Global Master Repurchase Agreement and the Global Master Securities Lending Agreement, which helps the country to be more prepared to drive product innovation and growth in the derivatives market and open up its capital markets to international investors.
- Using Technological Innovation: South Africa also makes use of technological innovation to make its capital markets more efficient. For example, the South African Reserve Bank has set up an electronic trading platform for primary dealers in an effort to improve liquidity and transparency in the government bond market. There are plans to expand this to other market participants and for other securities, including corporate bonds.
Due to the efficiency of the South African capital markets, businesses have credible alternative sources of funding and they do not have to over-rely on banks in South Africa to have access to capital markets funding. This makes South Africa an attractive destination for businesses, including multinationals to set up operations.
Section V: Steps Kenya Should Take to Expand its Capital Markets as Complementary to Bank Funding
We look at what Kenya can learn from South Africa as South Africa has the most robust capital markets in Africa. In our view, Kenya should adopt the following recommendations that will address the existing bank dominance, reduce the funding reliance we have on banks, and support the expansion of capital markets as an alternative to banks:
- Focus Legislation and Policies to Stimulating the Capital Markets and Alternative Products, as Opposed to Focusing Mainly on Banks: A lot of legislative action has focused on the banks, yet we also need legislation to promote competing products that will diversify funding sources, which will enable borrowers to tap into alternative avenues of funding that are more flexible and pocket-friendly. This can be done through the promotion of initiatives for competing and alternative products and channels. In developed economies, 40% of business funding comes from the banking sector, with 60% coming from non-bank institutional funding such as capital markets and alternative sources. However, in Kenya, 95% of all funding is bank funding, and only 5% from non-bank institutional funding, showing that the economy is highly dominated by the banking sector and should have more capital market products for funding businesses. Not to mention that cost of bank funding is too high. To try and address cost of funding and access to funding, the legislation has focused on the wrong issues such as legislating cost of borrowing and trying to allocate a certain amount of loans to SMEs. Our view is that legislation ought to be more focused on creating a more supportive environment to capital markets and alternative funding,
- Support Product Development and Innovation: The capital markets regulators and participants need to look at how to enhance non-bank funding, by encouraging product development and innovation. The Total Assets Under Management (AUM) held by Unit Trust Fund Managers declined slightly, by 0.7%, to Kshs 56.1 bn in 2017, from Kshs 55.5 bn recorded in 2016, while commercial banks AUM grew by 8.3% over the same period, to Kshs 4.0 tn in 2017 from Kshs 3.7 tn in 2016. The capital markets regulators are already doing a lot, such as establishing REIT regimes, derivatives and exchange traded funds, but more needs to be done to encourage product development and innovation,
- Consumer Education and Protection: The implementation of a strong consumer protection, education agency and framework, to include robust disclosures on cost of credit, free and accessible consumer education, enforcement of disclosures on borrowings and interest rates, while also handling issues of contention and concerns from consumers,
- Promote an Efficient Capital Markets Infrastructure: Efficient capital markets infrastructure is crucial to developing deep and vibrant capital markets. The Capital Markets Authority (CMA) could improve market efficiency by (i) making it easier for new and structurally unique products to be introduced in the capital and financial markets. The market remains largely a plain vanilla products market with equities and fixed income products, (ii) instituting predictable and transparent timelines for processing submissions from market applicants and expedite processing of applications. For example, an online portal showing when applications come in and how long they take to be processed be helpful, and (iii) pushing for a one stop shop for applicants such that an approval from the authority on products such as REITs would suffice, as opposed to current structure where applicants have to chase other approvals from other agencies such as KRA,
- Addressing the Tax Advantages that Banks Enjoy: Level the playing field by making tax incentives available to banks to be also available to non-bank funding entities and private investment funds. For example, providing alternative and capital markets funding organizations with the same withholding tax incentives that banking deposits enjoy, of a 15% final withholding tax, so that depositors don’t feel that they have to go to a bank to enjoy the 15% withholding tax; alternatively, normalize the tax on interest for all players to 30% to level the playing field,
- Freeing Capital Markets Infrastructure from Banking Sector Control: To spur growth of capital markets in areas such as Unit Trust Funds / Mutual Funds, we need to reduce the dominance of banks in the capital markets infrastructure. For example, for a fund manager to set up a Unit Trust Fund, they require a Custodian and a Trustee as part of the governance structure. In the current capital markets governance structure framework, both the Custodian and the Trustees have to be banks. It is understandable to have custody under banks because banks traditionally play the roles of custody and safekeeping of assets. However, we should expand Trusteeship beyond banks. In Kenya, being a trustee is based on Regulation 26 (1) of the Capital Markets (Collective Investment Schemes) Regulations, 2001, which provides that a trustee must be a bank or financial institution appointed by the Capital Markets Authority. However, when we look at two other jurisdictions very relevant to us, that is South Africa and UK, the role of Trustees has been expanded to include other entities:
- In South Africa, Section 69 of the Collective Investment Scheme Control Act, 2002, a Trustee may be: (a) a public company under the Companies Act; (b) a company or institution incorporated under a special Act, excluding a close corporation referred to in the Close Corporations Act, 1984 (Act No. 69 of 1984); (c) an institution or branch of a foreign institution, which is entitled to carry on the business of a bank under the Banks Act, 1990 (Act No. 94 of 1990); or (d) an institution which is registered as an insurer under the Long-term Insurance Act, 1998 (Act No. 52 of 1998). The companies or institutions listed above must also: (a) maintain capital and reserves together amounting to not less than ZAR 10.0 mn (USD 0.7 mn); and (b) be registered by the registrar as a trustee or custodian
- In the UK, Section 55A, Part 4A of the Financial Services Act, 2012, Section 243, and the GCA Collection Investment Scheme Information Guide 2019, a Trustee may be (a) an individual; (b) a body corporate; (c) a partnership; or (d) an unincorporated association, that has received permission from the Financial Conduct Authority to act as a Trustee, and must be independent of the manager of the fund.
Looking at the above case studies, there is a compelling case to consider expanding our current closed framework where Trusteeship is only open to banks, and in fact only 4 banks currently offer Trustee services to the 18 currently registered Unit Trust Funds. It is arguably that banks may not support capital markets products that are threatening to their own core banking business, thereby curtailing the development of capital markets products that offer alternatives to banking products.
- Increased Transparency: This can be achieved through a reduction of the opacity in debt pricing. This will spur competitiveness in the banking sector and bring a halt to excessive fees and costs. Recent initiatives by the CBK and Kenya Bankers Association (KBA), such as the stringent new laws and cost of credit website being commendable initiatives,
In conclusion, a well-developed capital markets creates a sustainable, low-cost distribution mechanism for multiple financial products and services across the country. This in turn helps the business community to raise long-term funds that are used to purchase capital goods, thereby propelling their growth and supporting the country’s economic growth. Capital markets also enhance efficient financial intermediation. It increases mobilization of savings and therefore improves efficiency and volume of investments, economic growth and development. Capital markets can create greater financial inclusion by introducing new products and services tailored to suit investors’ preference for risk and return, as well as borrowers’ project needs and risk appetite. One of the key missing pillars of the President's Big Four Agenda is how to bring in private sector funding, we believe that the 7 points outlined above can play a big role in mobilizing private sector funding of the Big Four Agenda.
Disclaimer: The views expressed in this publication are those of the writers where particulars are not warranted. This publication, which is in compliance with Section 2 of the Capital Markets Authority Act Cap 485A, is meant for general information only and is not a warranty, representation, advice or solicitation of any nature. Readers are advised in all circumstances to seek the advice of a registered investment advisor.

- Talk to us
- Kenya
- P.O Box 20695 - 00200, Nairobi, Kenya
- Cell +254709101200
- Tel +254709101200
- WhatsApp +254741676635
- United States
- +254709101200
- DOWNLOAD OUR APP
-


- Kenya
- 8th Floor, Pinetree Plaza, Kaburu Drive, Ngong Road, Nairobi, Kenya
- USA
- Suite 1150, 1775 Eye Street NW, USA, Washington DC 20006, USA
- Investments
- High Yield
- Private Equity
- Real Estate
- Real Estate
- RiverRun Estates
- Cytonn Towers
- The Ridge
- Taraji Heights
- The Alma