Nov 27, 2022
In 2021, we published the Nairobi Metropolitan Area Serviced Apartments Report 2021, which highlighted that serviced apartment’s average rental yield grew by 1.5% points to 5.5%, from the 4.0% recorded in 2020. This was attributed to an increase in monthly charges per SQM by 0.7% to Kshs 2,549, from Kshs 2,533 recorded in 2020, coupled with an increase in occupancy levels by 13.5% to 61.5%, from 48.0% recorded in 2020. The improvement in performance was attributable to increased demand for hospitality facilities and services as a result of the reopening of the economy, the return of international flights, and the improved rent collection amounts by serviced apartments that had previously been issuing discounts to attract and maintain clients. This year, we update our report using 2022 market research data and by focusing on;
- Overview of the Kenyan Hospitality Sector,
- Introduction to Serviced Apartments,
- Supply and Distribution of Serviced Apartments within the NMA,
- Performance of Serviced Apartments in the NMA,
- Serviced Apartments Performance by Node
- Comparative Analysis- 2021/2022 Market Performance
- Performance per Typology
- Recommendation and Outlook.
Section I: Overview of the Kenyan Hospitality Sector
In 2022, the hospitality sector displayed a remarkable improvement in terms of activity and overall performance when compared to 2021, after having been one of the worst hit economic sectors by the pandemic. The improvement in performance was mainly on the back of a number of factors including but not limited to; increase in number of visitor arrivals into Kenya following the removal of all travel restrictions, government's commitment to marketing and developing the sector, and, the increasing number of Kenyans travelling domestically. Additionally, Central Bank of Kenya’s Monetary Policy Committee Hotels Survey-July 2022 report highlighted that out of the 80 hotels sampled around the country, all 80 of them were operating in Q2’2022, up from 90.3% and 39.0% over the same period in 2021 and 2020, respectively. The survey established that normalcy in the level of operations in most hotels around the country had returned to pre-COVID-19 levels, signaling the continued recovery of the sector. The graph below shows the overall percentage of the number of operating hotels in Kenya from Q1’2020 to Q2’2022;
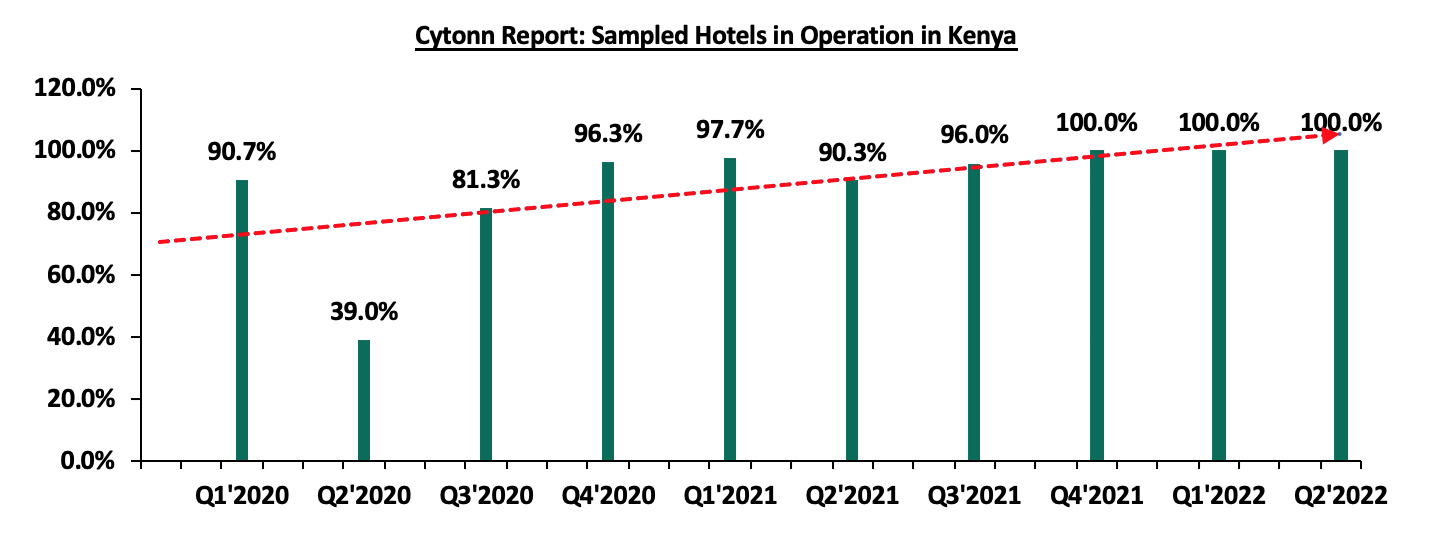
Source: Central Bank of Kenya
Consequently, the average bed occupancy rates increased by 35.7% points to 58.0% in Q2’2022 from 22.3% recorded a similar period in 2021. The graph below highlights the hotel bed occupancy rates in Kenya between Q1’2020 and Q2’2022;
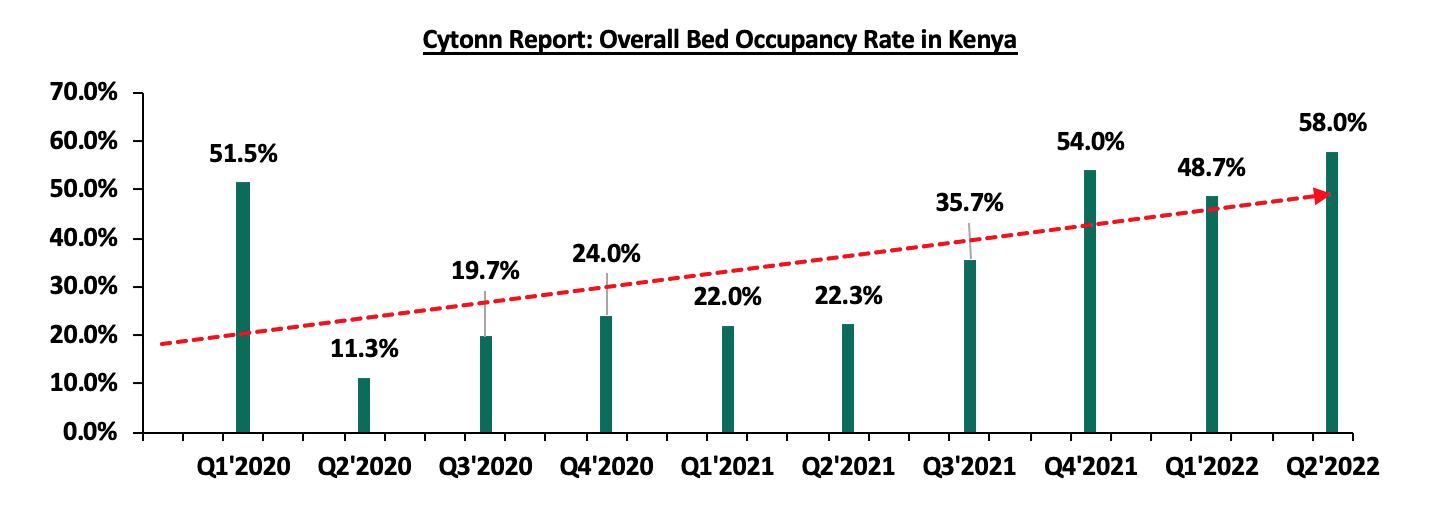
Source: Central Bank of Kenya
In terms of international arrivals, Kenya National Bureau of Statistics’ Leading Economic Indicators - August 2022 report highlights that Jomo Kenyatta International Airport (JKIA) and Moi International Airport (MIA) registered a significant increase of 147.1% to 279,981 visitors in Q2’2022 from 113,307 visitors in Q2’2021. This is as a result of the retraction of all pandemic-related restrictions and lockdowns, coupled with the aggressive efforts by the Ministry of Tourism to market the Kenyan hospitality sector to international markets, despite external shocks like the turmoil in Ukraine.
For the month of August, the number of international visitors arriving through Jomo Kenyatta (JKIA) and Moi International Airports (MIA) declined by 12.1% to 102,139 persons in August 2022 from 116,189 persons in July 2022 mainly as a result of uncertainty emanating from the heated political temperatures during the General Elections period. Nonetheless, the total number of international arrivals through JKIA and MIA from January 2022 to August 2022 was 723,630 persons, which was a significant 89.1% increase from the 382,619 persons over the same period in 2021. The graph below shows the number of international arrivals in Kenya between Q1’2020 and Q2’2022;
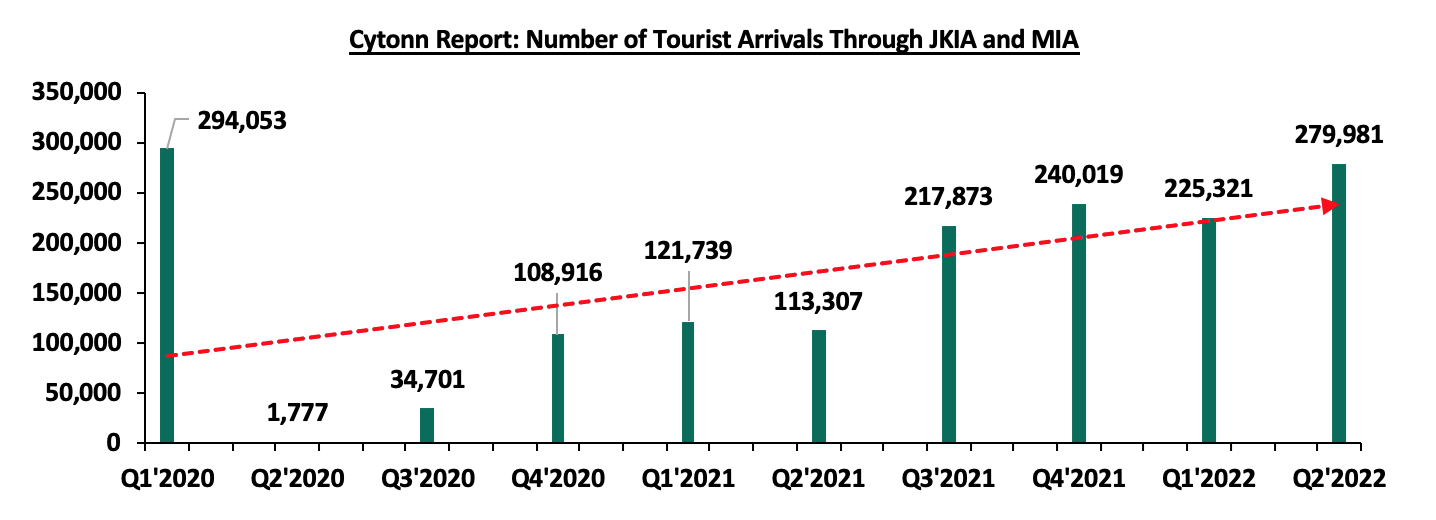
Source: Kenya National Bureau of Statistics
Some of the factors that continue to cushion the hospitality sector include;
- Retraction of all Travel Restrictions: The easing of COVID-19 pandemic prevention measures such as curfew and travel restrictions put in place both domestically and overseas, and relaxation of various travel advisories against the country contributed to the reopening of Kenya’s key tourism markets. This in turn triggered the recovery of the industry with tourist arrivals coming at 279,981 persons in Q2’2022, compared to 113,307 persons in Q2’2021 and 1,777 persons in Q2’2020,
- Peaceful Post-Electioneering Period: In spite of the uncertain political environment in the run up to the August 2022 General Elections, the country remained calm post-election. Additionally, Kenya had a smooth government transition leading to a stable business environment which promoted various activities such as the World Travel Awards – Africa and Indian Ocean Gala Ceremony that was held at the KICC in October 2022,
- World Famous Tourist Attractions: Kenya is home to 6 unique world heritage sites identified by the United Nations Educational Scientific and Cultural Organization (UNESCO) which include; Kenya’s Lake System, Lake Turkana National Park, Mijikenda Kaya Forests, Mount Kenya National Park, Lamu Old Town, and, Fort Jesus. These world heritage sites have been identified because of their cultural, historical, natural and archaeological value, thereby attracting numerous tourists from across the globe,
- Hospitality Sector Events: Kenya has continued to host various events such as the World Rally Championship (WRC) held in 2021 and 2022, and still expected to be hosted annually until 2026, and the World Under 21 Athletics Championships which were held at Moi International Sports centre in August 2021. These events continue to boost visitor arrivals, hotel bookings and the general performance of the hospitality industry,
- Positive Accolades for the Hospitality Industry: In the 29th World Travel Awards, Nairobi was voted as Africa’s leading business travel destination, with Kenya being voted Africa’s leading destination. This was supported by the presence of renowned conferencing centers such as the KICC, prestigious lodging options such as Fairmont The Norfolk, a stable business environment, favorable infrastructure, numerous historical sites, and a rich cultural heritage. The award which is the fourth consecutively per year signifies the continued confidence in the country as a hospitality destination. Other accolades won by Kenya during the year include; Africa’s leading MICE destination in the 3rd Annual World MICE Awards, and various other awards for hotels and facilities in the 16th World Luxury Hotel Awards 2022,
- Aggressive Local and International Marketing of Kenya’s Hospitality Industry: In a bid to remain competitive and attract more tourists, the industry has seen aggressive marketing initiatives both locally and internationally by industry players through various marketing strategies such as the annual Magical Kenya Travel Expo held in the KICC and organized by the Kenya Tourism Board. These strategies seek to solidify Kenya's position as a leading hospitality destination through showcasing various destinations, hospitality facilities and fostering various partnerships among industry players,
- Sustained Economic Recovery: The recovery of the economy after the wane of the COVID-19 pandemic slowdown has seen the reinstatement of hotels within the year that had previously shut down business. These include; The Mount Kenya Safari Club, Fairmont The Norfolk, and, Radisson Blu – Upperhill hotels which had exited the market, as the hospitality sector was one of the most impacted by pandemic restrictions. In terms of performance, the Accommodation and Restaurant services sector contribution to Gross Domestic Product (GDP) recorded a 22.0% y/y growth in Q2’2022, from the 90.1% and 56.2% growth recorded in Q2’2021 and Q1’2022, respectively. The slow growth mainly driven by the persistent inflationary pressures that has seen food inflation increase to 12.8% in Q2’2022 from 9.2% in Q1’2022. However, the sector’s performance continues to be cushioned by the rising tourism activities, and,
- Regional Expansion Drive through Mergers and Acquisitions: The hospitality sector has seen various mergers and acquisitions, signifying investor appetite and confidence in a bid to gain market dominance coupled by the recovery of the sector away from the pandemic lockdowns. During the year; Kasada Hospitality Fund purchased Crowne Plaza Hotel located in Nairobi’s Upperhill District for Kshs 4.6 bn, Maanzoni Lodges purchased Nairobi’s 680-Hotel for an estimated Kshs 1.2 bn, and Actis Limited completed the purchase of Fairview Hotel in Nairobi, City Lodge Hotel in Two Rivers, and, Town Lodge Hotel in Upperhill from South Africa City Lodge Hotel Group at a cost of Kshs 1.0 bn. These expansionary efforts are expected to further cushion the performance of the sector.
Nevertheless, the sector continues to face challenges, mainly;
- Increased Cost of Operation: One of the most significant challenges is the elevated cost of doing business for establishments in the sector. This is due to a number of factors, including the high cost of inputs caused by elevated inflationary pressures, coupled with continued depreciation of the Kenyan shilling against the dollar. On a year to date basis, the Kenyan shilling has depreciated by 8.1% against the dollar, higher than the 3.6% depreciation recorded in 2021. As a result, the prices of crucial products such as fuel, wheat and cooking oil have increased thereby reducing profit margins for hotels in the sector,
- Lack of Proactive Reputational Management: During crises, Kenya is vulnerable to travel warnings advising against travel into the country, which lead to reduced international arrivals. Additionally, there is currently no dedicated strategy by the government to preemptively manage this reputational risk in existence. As a result, the hospitality industry may continue to face setbacks when foreign governments issue these advisories,
- Stiff Competition: The continued expansion by players on the back of recovery of the sector has led to an increase in the number of hotels, serviced apartments, and firms in the market, which has caused stiff competition as each tries to garner a larger share of the market while maintaining dominance. This has led to a need to offer more attractive terms to customers such as by lowering prices in order to fill existing units and spending more on advertisement efforts, thereby weighing down their profitability, and,
- Increased Credit Risk: According to the latest Quarterly Economic Review Q2’2022 Report by Central Bank of Kenya (CBK), the sector’s credit risk has remained elevated, evidenced by the 6.1% increase in gross NPLs to Kshs 20.9 bn from Kshs 19.7 bn in Q1’2022. On an annual basis, the gross NPLs increased by 28.2% from Kshs 16.3 bn in 2021. Consequently, most lenders continue to lend cautiously to the sector because of increased credit risks thus slowing down the sector’s growth.
Section II: Introduction to Serviced Apartments
To bring up to date our 2021 topical, we ventured into an analysis of serviced apartments in the Nairobi Metropolitan Area. A serviced apartment is a type of furnished apartment available for short term or long-term stays. Individuals, hotels or companies rent them on a daily, weekly or monthly basis with housekeeping charges and amenities typically available in traditional hotels such as fully equipped kitchens, washers and dryers, and separate bedrooms. The serviced apartments thus offer added space, convenience and privacy just like a home, and more flexible for business travelers who need to book accommodations at the last minute. The advantages of a serviced apartment include;
- Serviced apartments offer extra services like cleaning, maintenance, staffed service, delivery of shopping goods, and chauffeur driven arrivals which are not available in some hotels. These make them more advantageous for guests who want to avoid the hassle of doing house chores during their stay,
- Serviced apartments are designed to be more appealing to a wider range of people by incorporating different preferences and tastes into their design and match the culture of specific regions. This makes them more versatile and accommodating than a typical hotel room,
- Serviced apartments are commonly located within or in close proximity to other residential developments, making it easier for guests to integrate with the wider community,
- With access to almost everything they need, clients feel at ease and relaxed during their stay as serviced apartments provide more utilities and amenities, offering a “home-from-home” feel compared to hotels, and,
- Serviced apartments offer a more attractive investment option and greater flexibility to investors than hotels do. They can be converted into furnished or normal apartments if they are not performing well.
Section III: Supply and Distribution of Serviced Apartments in the Nairobi Metropolitan Area
The number of serviced apartments within the Nairobi Metropolitan Area (NMA) increased by a 7-Year CAGR of 9.3% to 6,377 apartments in 2022, from 3,414 apartments in 2015. The key facilities brought into the market this year included the 162-room Somerset Westview Serviced Apartments and 120-room 9 Oak Residences located in Kilimani. Westlands also debuted the 51-room JW Marriot Serviced Apartments which is located in the Global Trade Centre and developed by Avic International.
In terms of distribution, Westlands and Kilimani have the largest market share of serviced apartments within the Nairobi Metropolitan Area, at 33.7% and 29.2%, respectively. This is attributed to the attractiveness of the areas due to;
- Their strategic locations near the Nairobi CBD and to other upscale business nodes such as Upperhill and Spring Valley among others,
- Relatively better infrastructure such as Nairobi Expressway promoting direct connectivity to and from the Jomo Kenyatta International Airport (JKIA), and other major roads easing accessibility from other key areas,
- Growth in presence of international organizations seeking to enhance regional presence in Africa such as the Price Water Coopers Kenya Headquarters, United Nations agencies, and various Embassies, thus providing the customer base enhancing demand for the serviced apartments,
- Availability of sufficient social amenities such as shopping malls, and well organized delivery service companies within the areas, and,
- Presence of prime serviced apartments fetching higher rents and rental yields thus increasing investors’ confidence for the regions.
The table below indicates the serviced apartment’s market share in the Nairobi Metropolitan Area;
|
Cytonn Report: Nairobi Metropolitan Area (NMA) Serviced Apartments Market Share 2022 |
|
|
Area |
Percentage Market Share |
|
Westlands |
33.7% |
|
Kilimani |
29.2% |
|
Kileleshwa & Lavington |
12.4% |
|
Upperhill |
7.9% |
|
Limuru Road |
7.8% |
|
CBD |
4.5% |
|
Thika Road |
4.5% |
|
Total |
100.0% |
Source: Online Research
For the projects in the pipeline, the Nairobi Metropolitan Area currently has approximately 4 serviced apartments or hotels with serviced apartments’ concepts in the pipeline. Some of these key development include;
|
Cytonn Report: NMA Serviced Apartments Projects in the Pipeline 2022 |
|||
|
Name |
Location |
Number of Rooms |
Estimated Completion Date |
|
Grand Hyatt |
Westlands |
225 |
2023 |
|
Britam Properties |
Kilimani |
163 |
2023 |
|
MGallery |
Gigiri |
105 |
2023 |
|
Somerset Rosslyn |
Rosslyn |
162 |
2023 |
|
Total |
|
655 |
|
Source: Online Research
Section IV: Performance of Serviced Apartments in the Nairobi Metropolitan Area
In the development of the report, the performance of seven nodes within the Nairobi Metropolitan Area was tracked, and compared to the performance in 2021, with emphasis on the following metrics;
- Charged Rates: It is the daily, weekly and monthly rates that are charged to guests for serviced apartments in specific markets. This which form the basis for evaluation of the likely rental income to be received by investors in serviced apartments,
- Occupancy Rates: It measures the number of inhabited apartments as a percentage of the total number of units available. It also guides in determining the expected rental yields for various developments, and,
- Rental Yields: It measures the Real Estate investment return from the annualized collected rental income. It provides investors with an estimate of the returns expected from the property, as well as the time it will take to recover the investment. In the calculation of rental yields, we estimate annual income from monthly revenues and deduct operational costs (assumed as 40.0% of revenues).
In the estimations for the investment value, we have calculated development costs per SQM through factoring in land costs (location-based), costs of construction, equipping costs, professional fees and other costs relating to development. The formula thus used in the calculation rental yields is as follows;
Rental Yield= Monthly Rent per SQM x Occupancy Rate x ( 1 - 40.0% operational cost ) x 12 months
Development Cost per SQM*
It is important to note that investors will generally incur varying costs depending on the actual land costs incurred, the plot ratios, and the level of finishing and equipping. In analyzing performance, we will start by the node during the year, followed by a comparison with 2021 then the performance by typology will then be covered;
- Serviced Apartments Performance by Node
The average rental yield for serviced apartments within the NMA increased by 0.7% points to 6.2% in 2022 from 5.5% in 2021, with Westlands and Kilimani being the best performing nodes, with rental yields of 9.3% and 7.2% respectively compared to the market average of 6.2%. The performance was attributed to, i) proximity to the CBD, ii) presence of high quality serviced apartments available in the nodes which attract premium rates, iii) the ease of accessing the areas through well-developed infrastructure road networks, and, iv) the proximity to international organization offered by the apartments, all of which drive the demand for serviced apartments in the nodes. On the other hand, Thika Road was the least performing node, with an average rental yield of 4.2%, 2.0% points lower than the market average of 6.2%. The performance was ascribed to, i) the relatively low charge rates for apartments in the node, ii) the low demand for its serviced apartments caused by their unpopularity, iii) the long commute to main commercial zones, and, iv) security concerns surrounding the area, given that it is not mapped within the UN Blue Zone. The table below highlights the performance of the various nodes within the NMA;
|
Cytonn Report: NMA Serviced Apartments Performance per Node - 2022 |
||||||||
|
Node |
Studio |
1 Bed |
2 Bed |
3 bed |
Monthly Charge/ |
Occupancy |
Devt Cost/SQM (Kshs) |
Rental Yield |
|
SQM (Kshs) |
||||||||
|
Westlands |
193,633 |
284,376 |
343,828 |
353,350 |
3,916 |
70.7% |
209,902 |
9.3% |
|
Kilimani |
173,062 |
248,122 |
287,174 |
449,987 |
2,937 |
69.3% |
202,662 |
7.2% |
|
Kileleshwa & Lavington |
150,000 |
250,000 |
417,593 |
498,803 |
2,811 |
66.3% |
206,132 |
6.6% |
|
Limuru Road |
145,713 |
308,725 |
327,424 |
344,500 |
2,976 |
60.6% |
231,715 |
5.8% |
|
Nairobi CBD |
171,000 |
162,680 |
271,707 |
268,620 |
2,348 |
66.2% |
224,571 |
5.2% |
|
Upperhill |
201,533 |
347,950 |
554,800 |
2,225 |
65.4% |
209,902 |
5.0% |
|
|
Thika Road |
82,381 |
208,088 |
295,000 |
1,800 |
62.1% |
200,757 |
4.2% |
|
|
Average |
166,682 |
219,688 |
314,823 |
395,008 |
2,716 |
65.8% |
212,234 |
6.2% |
Source; Cytonn Research 2022
- Comparative Analysis- 2021/2022 Market Performance
The performance of the serviced apartments improved y/y, with the occupancy rates coming in at 65.8%, a 4.3% points increase from the 61.5% recorded in 2021. The monthly charges for 2022 increased to Kshs 2,716 per SQM from Kshs 2,549 per SQM recorded in 2021, representing a 6.6% increase. Consequently, the average rental yield increased to 6.2% in 2022, a 0.7% points increase from the 5.5% recorded in 2021. The improvement in performance was primarily on the back of; i) economic recovery especially for the services and accommodation sector, ii) an increase in both local and international tourist arrivals into the country resulting in an increase in occupancies as well as the number of hotels in operation during the period, iii) the intensive marketing of Kenya’s tourism market through platforms such as the Magical Kenya platform among others, iv) the increased operation of multinationals in the city who prefer to host their employees in serviced apartments, and, v) the rising preference by various guests for extended stay options within the city. The table below shows the comparative analysis between 2021 and 2022;
|
All values in Kshs unless stated otherwise |
|||||||||
|
Cytonn Report: Comparative Analysis-2021/2022 Market Performance |
|||||||||
|
Node |
Monthly Charge/SQM 2021 |
Occupancy 2021 |
Rental Yield 2021 |
Monthly Charge/SQM 2022 |
Occupancy 2022 |
Rental Yield 2022 |
Change in Monthly Charges/SQM |
Change in Occupancy |
Change in Rental Yield |
|
Westlands |
3,569 |
68.8% |
8.3% |
3,916 |
70.7% |
9.3% |
9.7% |
1.9% |
1.0% |
|
Kilimani |
2,815 |
60.0% |
5.8% |
2,937 |
69.3% |
7.2% |
4.3% |
9.3% |
1.4% |
|
Kileleshwa & Lavington |
2,571 |
57.1% |
6.4% |
2,811 |
66.3% |
6.6% |
9.3% |
9.2% |
0.2% |
|
Limuru Road |
2,853 |
60.5% |
4.9% |
2,976 |
60.6% |
5.8% |
4.3% |
0.1% |
0.9% |
|
Nairobi CBD |
2,176 |
66.6% |
4.9% |
2,348 |
66.2% |
5.2% |
7.9% |
(0.4%) |
0.3% |
|
Upperhill |
2,109 |
61.1% |
4.5% |
2,225 |
65.4% |
5.0% |
5.5% |
4.3% |
0.5% |
|
Thika Road |
1,748 |
56.4% |
3.5% |
1,800 |
62.1% |
4.2% |
3.0% |
5.7% |
0.7% |
|
Average |
2,549 |
61.5% |
5.5% |
2,716 |
65.8% |
6.2% |
6.3% |
4.3% |
0.7% |
Source; Cytonn Research 2022
Section V: Recommendations and Outlook
After looking at the various factors driving the hospitality industry and with a particular focus on the serviced apartments sector, including challenges and current performance, we conclude with a recommendation of existing investment opportunities in the sector, and outlook as depicted below;
|
|
Cytonn Report: Serviced Apartments Sector Outlook |
|
|
Measure |
Sentiment |
Outlook |
|
Serviced Apartments Performance |
|
Positive |
|
International Tourism |
|
Neutral |
|
MICE Tourism |
|
Neutral |
|
Supply |
|
Neutral |
Given that majority of our key metrics are neutral, we have a NEUTRAL overall outlook for the hospitality sector. The Investment opportunity lies in Westlands, Kilimani, and Kileleshwa-Lavington which performed the best among all the nodes, with rental yields of 9.3%, 7.2% and 6.6% respectively, compared to the market average of 6.2%.

- Talk to us
- Kenya
- P.O Box 20695 - 00200, Nairobi, Kenya
- Cell +254709101200
- Tel +254709101200
- WhatsApp +254741676635
- United States
- +254709101200
- DOWNLOAD OUR APP
-


- Kenya
- 8th Floor, Pinetree Plaza, Kaburu Drive, Ngong Road, Nairobi, Kenya
- USA
- Suite 1150, 1775 Eye Street NW, USA, Washington DC 20006, USA
- Investments
- High Yield
- Private Equity
- Real Estate
- Real Estate
- RiverRun Estates
- Cytonn Towers
- The Ridge
- Taraji Heights
- The Alma