Jan 13, 2019
In 2018, the real estate sector recorded continued investment across all themes driven by;
- Political stability following the conclusion of the electioneering period in Q4’2017, hence increased activity across the sector,
- The continued positioning of Nairobi as a regional hub that has led to increased entry of multinationals creating demand for residential units, retail space, commercial offices and hospitality spaces,
- Kicking off of the affordable housing initiative as part of the Kenyan Government’s Big 4 Agenda, which has gained momentum with the launching of projects such as the Pangani Estate in Nairobi, and,
- An improving macroeconomic environment, with the country’s GDP growing by 6.0% in Q3’2018, higher than the 4.7% recorded in Q3’2017.
In terms of performance, however, the sector recorded an average total return of 11.2% in 2018, 2.9% points decline from 14.1% in 2017. This is attributable to a decline in effective demand for property amid the growing supply, evidenced by the 3.0% points decline in the residential sector occupancy rates, and an oversupply in the commercial sector, currently at 2.0 mn SQFT and 4.7 mn SQFT for the retail and commercial office sector, respectively. However, it is important to note that the development returns for investment grade real estate continue to average at above 20.0% p.a. For a detailed review of 2018 performance, see Cytonn Annual Markets Review 2018.
In 2019, we expect the key drivers of real estate to be as follows:
- Attractive Demographic Profile – Demographic trends such as rapid urbanization currently at 4.3% p.a. against global averages of 2.0%, an expanding middle class with increased purchasing power due to higher net disposable income, which increased to Kshs 7.1 tn in 2017 from Kshs 6.6 tn in 2016 and Kshs 5.7 tn in 2015, and rapid population growth rates currently at 2.5%, 1.3% points higher than global averages of 1.2%, will continue to drive real estate development as developers work towards serving the housing, entertainment and consumption needs, thus boosting development in the land, residential and retail themes;
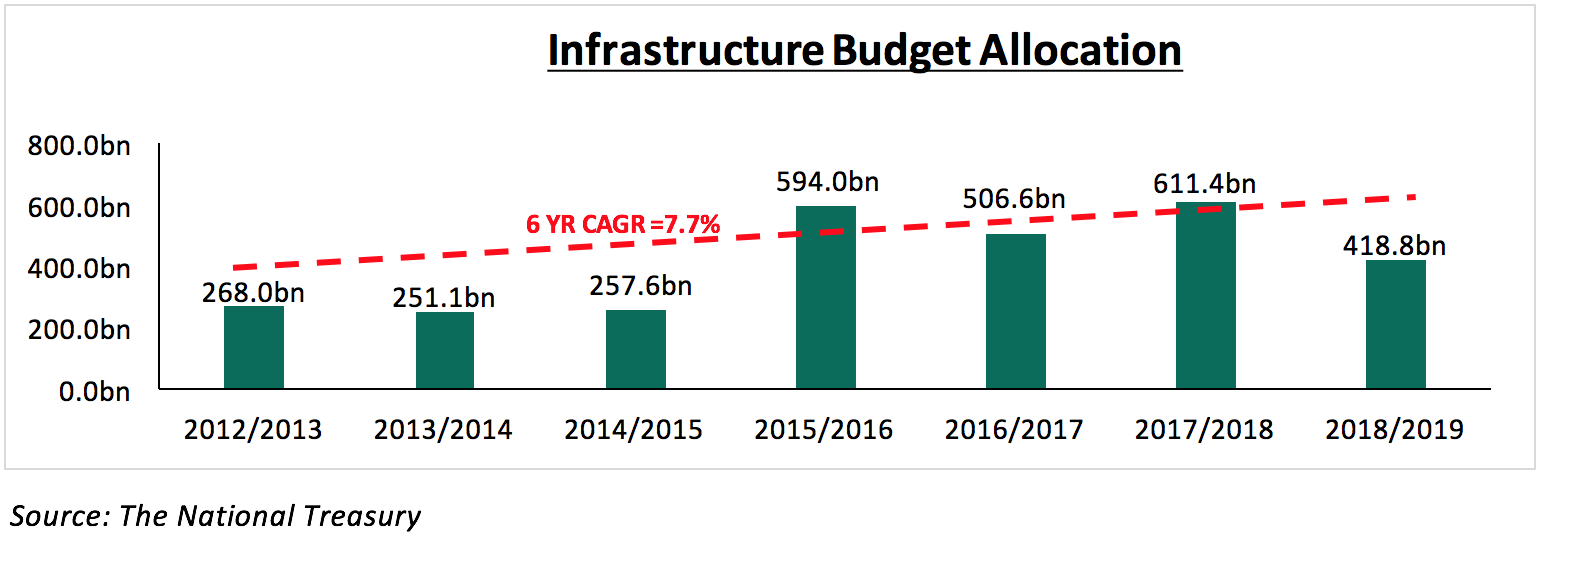
- Sustained Infrastructural Development – There has been increased government investment in infrastructure, in order to boost the country’s economic growth and open up more areas for development. For example, the budget allocation towards infrastructural development has been growing by a 6-year CAGR of 7.7% to Kshs 611.4 bn in 2018/19, from Kshs 251.1 bn in 2013/14. In addition, areas such as Ruiru and Kitengela are mapped for connection to the main sewer, which will allow for higher density construction and boost real estate development; and
- Kenya as a Regional Hub – We expect increased Foreign Direct Investments (FDI) in Kenya, with the expansion of international firms such as South African retailer Shoprite to back up the trend. FDI in Kenya increased by 70.7% to Kshs 67.1 bn in 2017, from Kshs 39.3 bn in 2016, and Kshs 61.9 bn in 2015. Kenya was also named as the East Africa US strategy “anchor” country in the United States' Africa Policy 2018, and thus is expected to attract more international investors looking to venture into East Africa.
Despite the above drivers, the sector is expected to be constrained by the following factors in 2019:
- Inadequate and High Cost of Funds - Banks have reduced credit advancement to small and medium sized companies as a result of the interest rates cap that stands at 13.0% (CBR rate at 9.0%), hence private sector credit growth came in at 4.4% in October 2018, compared to a 5-year (2013-2018) average of 14.0%. Despite the capping of interest rates, the actual cost of credit is still high averaging at 18.0% due to additional administration fees, which then raise the cost of development, thus making development expensive;
- Inaccessibility and Unaffordability of Off-take financing/Mortgages - Access to mortgages in Kenya remains low mainly due to (i) low-income levels that cannot service a mortgage, (ii) relatively high property prices, (iii) high interest rates and deposit requirements which lock out many borrowers, (iv) exclusion of the informal sector due to insufficient credit risk information, and (v) lack of capital markets funding towards real estate purchases for end buyers. According to Central Bank of Kenya, there were only 26,187 active mortgage accounts in Kenya as at December 2017 against a total adult population of approximately 23 mn persons, thus low real estate uptake using mortgages;
- Increased Supply and Competition - The real estate sector has witnessed increased space supply over the last 5-years with the market recording surplus space, which is likely to constrain market returns in 2019;
- The commercial office sector has an oversupply of 5.3 mn SQFT and this is expected to grow to 5.7 mn SQFT in 2019, with completion of buildings such as Garden City Business Park along Thika Road and Global Trade Centre in Westlands,
- The retail sector has an oversupply of 2.0mn SQFT and this is expected to increase with the opening of malls under construction such as Crystal Rivers in Athi River and Mountain View Mall along Waiyaki way, and,
- Increased supply in the middle - high end residential sector (houses with prices above Kshs.7.5 mn) with a decreasing effective demand, hence recording 3.0% points decline in occupancy rates in 2018.
Key factors expected to shape the real estate sector in 2019 include;
- Affordable Housing Initiative - The Kenyan Government’s affordable housing initiative focused on delivering 500,000 units by end of 2022, with a price range of Kshs 0.6 mn – Kshs 3.0 mn, to address the large housing deficit of approximately 2.0 mn units, according to National Housing Corporation, is expected to push developers’ effort towards provision of more housing for the lower middle- and low-income earners’ segment. The government allocated Kshs 6.5 bn in the Kenya National Budget 2018/19 and an additional Kshs 21.0 bn in the supplementary Appropriation Bill No. 2 of 2018, in support of the initiative. In addition, the government has provided incentives such as 15% tax relief on developers who deliver 100 units p.a. and policy reviews in support of affordable housing initiative;
- Increased Traction in Mortgage Market – Subject to its successful launch, the Kenya Mortgage Refinancing Company is expected to increase mortgage uptake in Kenya. We expect that mortgage home buyers will access mortgages with long tenor, pay affordable instalments and thus it will reduce the financial burden for buyers thus scaling up the rate of housing uptake;
- Government Partnerships - The government is expected to enter into various partnerships such as Public Private Partnerships (PPPs), County Government & National Government partnerships and government & government partnerships in development and financing to support the real estate sector, mainly in the housing sector and in infrastructure to open up areas for development;
- Devolution - Devolution has led to increased population at County Government headquarters and neighboring towns through the relocation of County Government officials and businesses hence created demand for office space, retail space and residential units and thus increased real estate development. In addition, the government increased its budget allocation to county governments to support infrastructural development as well as the growth of other sectors including housing. In 2018, the government increased county budget allocation by 8.9% from Kshs 345.7bn in 2017/18 to Kshs 376.4 bn in 2018/19; and
- Sustainable Developments & Technology – Developers will adopt sustainable development practices such as green buildings and embrace incorporation of technology such as alternative building technology (ABT) and virtual reality (VR) as part of value addition to differentiate their real estate offering to remain competitive.
The table below summarizes our outlook on the various real estate themes and the possible impact on the business environment in 2019. With 3 themes having a positive outlook, 3 neutral and 2 having a negative theme, the general outlook for the sector in 2019 remains as NEUTRAL. The real estate sector is mainly constrained by high financing cost for both developers and off takers, and we expect the market to pick up should the interest rate cap be lifted, or should the government establish other financing methods such as tapping into capital markets and incentives to the mortgage market. The real estate sector has pockets of value such as housing for lower-middle to low-income earners in the residential sector, serviced apartments and Mixed-Use Developments (MUDs).
|
Thematic Performance Review and Outlook |
||||
|
Theme |
2018 Performance |
2019 Outlook |
Effect |
|
|
Residential |
· The sector recorded a decline in performance with average rental yields dropping marginally by 0.5% points, from 4.7% in 2017 to 4.2% in 2018 attributable to a decline in occupancy rates, which declined by 3.0% points from 84.0% in 2017 to 81.0% in 2018, attributable to increased stock in the market against minimal uptake |
· We expect occupancy and uptake rates to stagnate at 81.0% and 22.8%, respectively owing to continued supply. Additionally, the continued housing deficit in the lower middle to low end markets and expected improvement in the mortgage market are set to boost market uptake. Prices will remain largely flat · We expect select markets to continue exhibiting a positive performance supported by their appeal to homebuyers based on location and accessibility, availability for affordable land for development, as well as availability of key amenities |
Neutral |
|
|
Commercial office |
· The performance of commercial office sector improved slightly recording 0.2% points and 0.7% points y/y increase in average rental yields and occupancy rates, to 8.1% and 83.3% from 7.9% and 82.6%, respectively, in 2017 · Various developments were launched during the year including The Federation of Kenya Employers (FKE) 8-storey office building in Upper Hill and Zamara Umbrella Solutions a 16 and 30 floor twin tower in Westlands, respectively · There’s an oversupply in the sector with the Nairobi region having an oversupply of 5.3mn SQFT in 2018, that is forecasted to increase to 5.7mn SQFT in 2019 |
· We forecast a slight decline of the average rental yield to 8.0% from 8.1% as a result of the oversupply with the average occupancy rates expected to decrease by 1.3% points from 83.3% to 82.0% · We expect monthly rental charges to stagnate at Kshs. 102 per SQFT per Month, just as the market has been charging over the last three years, as the market absorbs the current vacant stock of 5.3 mn SQFT · The sector, however, has pockets of value in differentiated concepts such as serviced offices that attract yields of upto 13.4% in locations such as Westlands, as well as prime areas with low supply office spaces such as Gigiri and Karen recording a rental yield of 10.5% and 9.2% respectively |
Negative |
|
|
Retail |
· The performance of the retail sector softened in as a result of increased supply of retail space, and the tough operating environment characterized by low private sector credit growth, · Occupancy rates declined by 9.0% points, from 80.3% to 79.8% between 2017 and 2018 in Nairobi triggered by an increase in of mall space by 4.8% y/y from 6.2mn SQFT to 6.5mn SQFT in 2018. Notable malls opened in 2018 include Waterfront in Karen and Signature Mall in Mlolongo, · Rental yields declined from 9.6% in 2017 to 9.0% as a result of lower occupancy rates, occasioned by increased supply, · There was increased entry of international retailers such as Carrefour, Shoprite and Game as well as the expansion of local retailers such as Naivas |
· Returns are expected to soften as a result of increased supply. Occupancy rates are expected to decline by 2.9% points to 76.9% from 79.8% leading to reduced yields of 8.7% from 9.0% · However, we forecast an increase in international retailer foothold such as South African based Shoprite supermarket and The Game as they try to cash in to the increasing middle-income earners in Kenya · The opportunity is in county headquarters in some markets such as Mombasa and Mt. Kenya regions that have retail space demand of 0.3mn and 0.2mn SQFT, attractive yields at 8.3% and 9.9% and occupancy rates at 96.3% and 84.5%, respectively |
Neutral |
|
|
Mixed-use Developments (MUD) |
· MUDs recorded an average weighted rental yield of 8.0%, (8.5% for retail space accounting for 30.9% of MUD lettable area on average, 8.2% for office space accounting for 58.1% of MUD lettable area on average and 5.6% for residential space accounting for 41.3% of MUD lettable area on average) outperforming single themed developments market average at 7.5%. |
· The real estate sector is to embrace the concept of MUDs as investors diversify their real estate portfolios, given the thematic real estate space surplus · The MUDs sector is expected to record an increase in performance driven by convenience value they offer thus stable occupancies · The investment opportunity within the Nairobi Metropolitan Area is in areas such as Limuru road, Karen, Upperhill and Kilimani recording the highest rental yield returns of 9.7%, 9.4%, 8.7%, and 8.6%, respectively |
Positive |
|
|
Hospitality (Serviced Apartments) |
· In 2018, serviced apartments recorded improved performance in 2018 with the average rental yield coming in at 7.4%, which is 2.1% points higher than 5.3% recorded in 2017, attributable to the increased demand, which has triggered an increase in charge rates, as well as increased occupancy rates with an average of 80.0% in 2018, compared to 72.0% in 2017 |
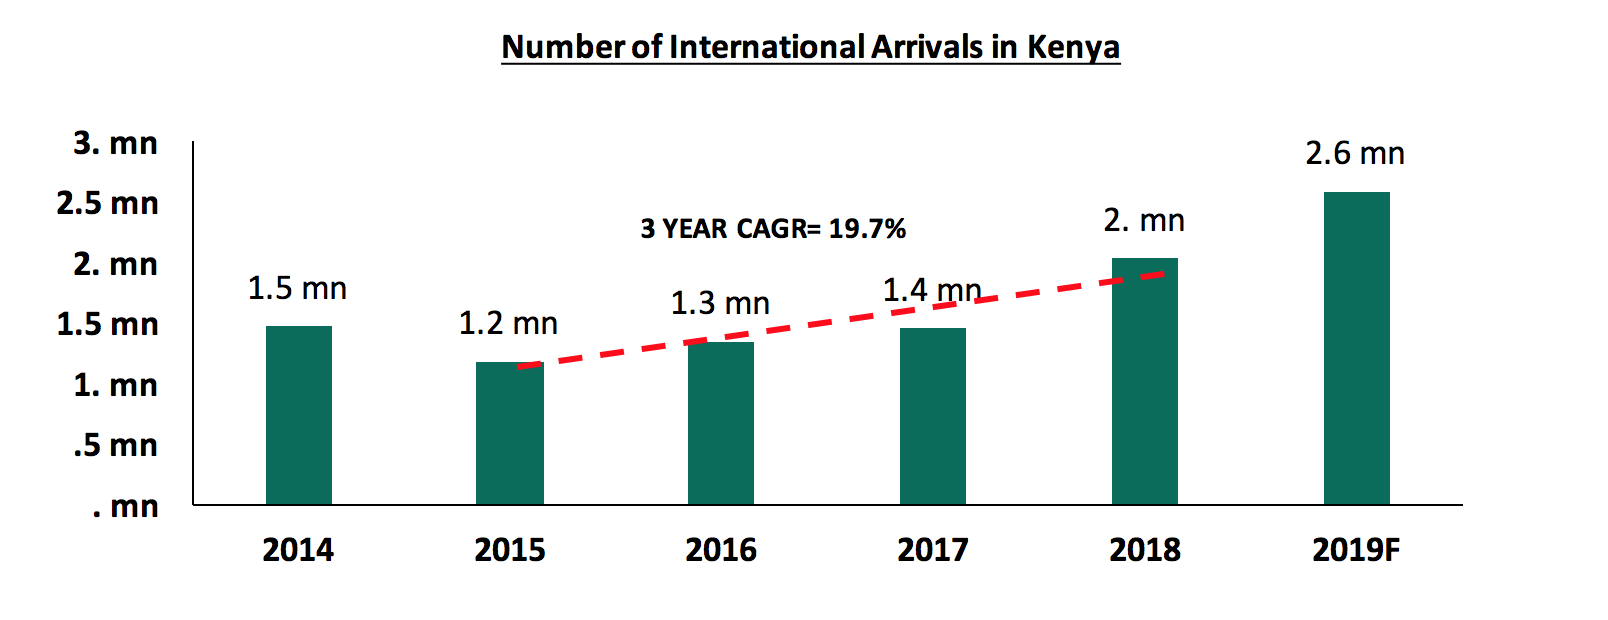
· Given the country’s political stability, the continued marketing of Kenya as an experience destination and the improved air transport with several airlines that increased their flight frequencies in and out of the country, we expect the number of international arrivals to grow to approximately 2.6 mn in 2019, resulting in a greater demand for hospitality services · We thus expect, the occupancy rates in the serviced apartments sector to remain above 80.0% and resulting in a rental yield of above 7.0%, with the investment opportunity being in Kilimani and Westlands markets with rental yields of above 10.0% |
Positive |
|
|
Land |
· The Nairobi Metropolitan Area land prices recorded a 7- year CAGR of 13.7%, and a 3.3% y/y price change in 2018, compared to a 17.4% and 4.2%, respectively recorded in 2017, uncertainty surrounding statutory approvals particularly in light of the ongoing demolitions of allegedly legally approved buildings, thus decreased transactions in the land sector |
· We expect an annual capital appreciation of 4.9% in 2019, fuelled by the availability of development land, improving infrastructure and demographics · For 2019, the investment opportunity in the Nairobi Metropolitan Area land sector lies in Satellite Towns such as Ruaka, Utawala, Ruiru and Thika, supported by high capital appreciation of 16.2%, 17.5%, 4.7%, 7.7% y/y capital appreciation, respectively, in addition to other areas such as Kilimani, Karen and Kitisuru, which had rates of 10.7%, 8.2% and 10.5% y/y capital appreciation, respectively |
Positive |
|
|
Infrastructure |
· In 2018, the infrastructure sector recorded several activities among them; the launching of the construction of Western Bypass, and the dualling of Ngong Road Phase 2, aimed at opening up areas for development · In terms of budget allocation, the sector was allocated 611.4 bn in the 2017/2018 budget and 418.8 bn in the 2018/2019 |
· We expect reduced infrastructural activities in 2019 due to the reduced budget allocation from the previous year attributable to the government’s financial constraints, given the country’s public debt which currently stands at 56.4% of the GDP, in addition to the national revenue collection deficit of 38.0% as at June 2018 · Planned infrastructure development such as sewer connection in Ruiru and Kitengela, Water improvement programm and proposed light rail which will allow for higher density construction and boost real estate |
Neutral |
|
|
Listed Real Estate |
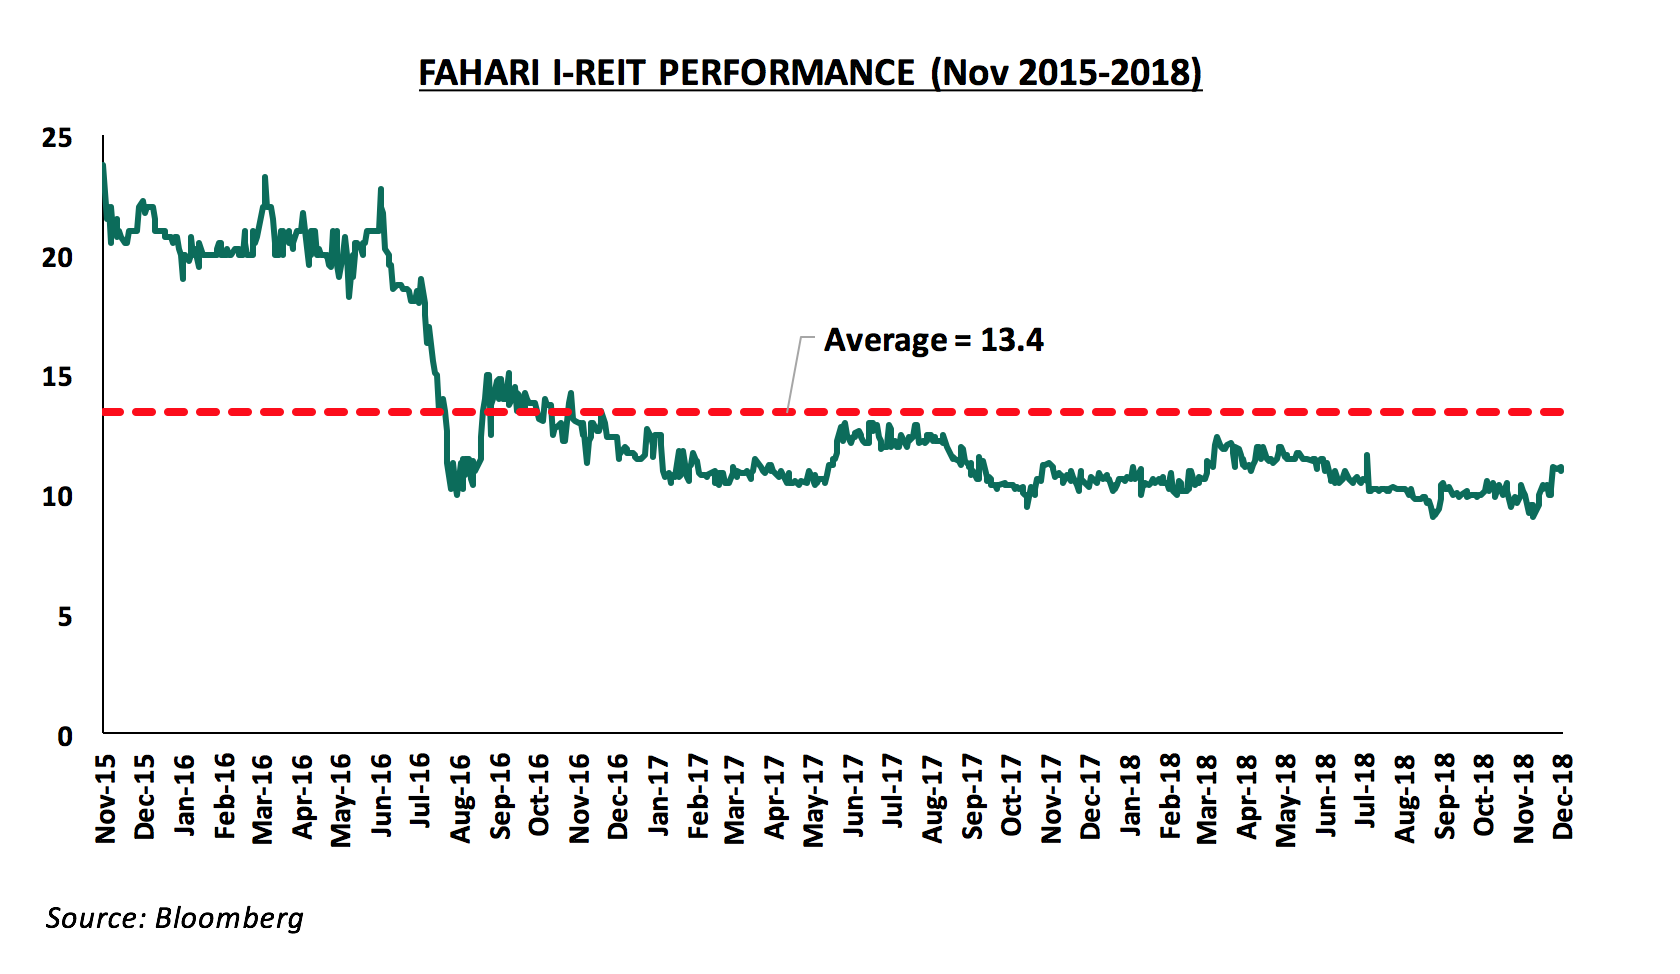
· Fahari I-REIT closed the year with a trading price of Kshs 10.95, a 4.8% rise from Kshs 10.45 at the beginning of 2018 and 47.4% decline its initial price of Kshs 20.8 in November 2015. The average share price in 2018 was Kshs 10.6, 6.0% lower than the average price of Kshs 11.3 in 2017 |
· Having opened the year with a trading price of Kshs 10.75, we expect the REIT to continue trading at low prices and in low volumes in 2019. · With the new acquisition, we expect growth in revenues and project 0.3% points increase in dividend yield to 6.8% from 2018 earnings (at a price of Kshs 10.25 per share as at 11th January 2019), from a 6.5% yield recorded from 2017 earnings |
Negative |
|
- Residential Sector
The residential sector’s performance slowed down in 2018 owing to increased supply of units, which dampened occupancy and annual uptake rates, resulting in softened annual residential market’s investor returns, which came in at 8.9% (price appreciation of 4.2%, rental yield of 4.7%) in 2018, in comparison to 10.3% in 2017 (price appreciation of 5.1%, rental yield of 5.2%). In 2019, we expect the sector’s performance to remain flat. We expect select markets to continue exhibiting a positive performance supported by their appeal to homebuyers based on location and accessibility, availability for affordable land for development, as well as availability of key amenities.
The table below summarizes the various factors that will affect the demand side of residential real estate.
Demand
Of the five factors, we expect to affect residential demand, two are positive, one is negative, and one is neutral, thus our outlook for residential demand this year is NEUTRAL with bias to positive.
|
Residential Demand |
||
|
Metric |
2019 Outlook |
Effect |
|
Demographics |
· Currently, the deficit in the Nairobi Metropolitan Area is expected to come in at 2.1 mn units in 2019, owing to a rapid population growth rate averaging at 2.6% p.a. for the last 5-years compared to a global average of 1.2% p.a. · This coupled by a relatively high urbanization rate at 4.3%, as per the World Bank, compared to the global average of 2.1%, will continue to sustain demand for more dwelling units with 70.7% of the demand being in the lower mid-end and low-end segments, who according to KNBS, earn below Kshs 50,000 per month |
Positive |
|
Infrastructure |
· In 2019, we expect the anticipated completion infrastructural projects such as parts of the ongoing Ngong Road expansion, Standard Gauge Railway Phase 2, water and sewer enhancements to boost demand for residential properties in these locations |
Positive |
|
Investor Returns |
· In 2018, the residential sector recorded a decline in investor returns to 8.9% from 10.3% in 2017 on account of increased supply amid reduced effective demand · We expect investors to focus on selected markets such as Kilimani, Riverside, Thindigua, and Runda Mumwe, which recorded attractive returns of 11.5%, 11.6%, 13.8% and 14.8%, respectively |
Neutral |
|
Purchasing Power |
· Average real earnings growth declined by 5.8% points to (2.9%) in 2017 from 2.9% in 2015 according to KNBS, implying a decline in purchasing power. With the expected growth of inflation in 2019 to an average of 5.4% from 3.8% in 2018, we expect real earnings to continue declining, thus, hampering effective demand for residential units |
Negative |
|
Access to Credit |
· Subject to the launch of the Kenya Mortgage Refinance Company (KMRC), set for February 2019, we expect growth in the local mortgage market where there are currently 26,187 mortgages out of a total adult population of 23.0 mn persons. The KMRC is expected to boost the local mortgage market by creating liquidity for primary lenders |
Neutral |
The table below summarizes the various factors that will influence the supply side of residential real estate in 2019. Of the five factors that we expect to shape residential supply, two are negative, one is neutral, whereas two are positive, and thus, our outlook is NEUTRAL.
|
Residential Supply Outlook |
||
|
Metric |
2019 Outlook |
Effect |
|
Developer Returns |
· In 2018, the residential market recorded slower uptake and occupancy of 22.8% and 81.0% compared to 2017 with 26.6% and 84.0%, respectively due to increased supply with reduced effective demand · However, we note that developer returns for institutional grade real estate remain high at above 20% p.a. Developers are likely to invest in research in order to identify market niches to ensure profitability of their projects |
Neutral |
|
Access to Credit |
· According to CBK Financial Stability Report, 73.1% of Non-performing loans in 2018 were from real estate, trade and manufacturing, highlighting developer’s financial constraints. Additionally, average private sector credit growth in 2018 came in at an average of 3.8% and is tipped to remain low in 2019 owing to the capping of interest rates. We, therefore, expect developers to continue experiencing barriers to adequate financial access, which is expected to affect housing supply in 2019 · However, the government is expected to off-take units under the affordable housing program, thus, allowing developers’ access construction financing |
Negative |
|
Development Costs |
· We expect land prices in 2019 to grow at 4.9%, 1.6% points higher than the 3.3% recorded in 2018. This, coupled with the expected rise in construction materials as a result of inflation is expected to curtail supply due to increase in construction costs |
Negative |
|
Infrastructure |
· In 2019, we expect the ongoing infrastructural projects such as the dualling of Ngong Road and the Western Bypass, and water and sewer improvement to boost new developments in these areas |
Positive |
|
Government Incentives |
· With the growing focus towards plugging the housing deficit, we expect to see more government incentives geared towards creating an enabling environment for home-buyers and developers such as the introduced 50.0% corporate tax cuts and scrapped levies, as well as statutory reforms aimed at improving the land sector’s efficiency thus cutting developers’ costs |
Positive |
Outlook:
Neutral with a positive bias outlook on demand and a neutral outlook on supply, our general outlook for the residential sector is NEUTRAL. We expect reduced developer activity in high and middle upper markets and, limited to undersupplied segments such as low-cost housing and selected markets with relatively high returns. The performance of the sector is likely to remain flat with occupancy rates and transaction rates stagnating.
|
Residential Sector Investment Opportunity in 2019 |
||||
|
Sector |
Segment |
Typology |
Locations |
Reasons |
|
Residential |
High-End |
Detached |
Kitisuru, Karen |
Annual returns at 8.9% and 8.8%, respectively against the high-end market average of 6.4%, and relatively high uptake averaging at 22.0% and 24.0%, respectively |
|
Upper Mid-End |
Detached |
Runda Mumwe |
Relatively high annual returns and annual uptake at 14.8% and 21.7% against upper mid-end market averages of 4.9% and 20.9%, respectively |
|
|
Apartments |
Riverside, Kilimani |
Relatively high annual returns of 11.8% and 11.9%, against upper mid-end market average of 10.9% |
||
|
Low-End |
Apartments |
Donholm, Thindigua |
Relatively high annual returns at 14.4% and 13.8% against lower mid-end market average of 11.9% and annual uptake of 25.0% and 24.6%, against lower mid-end market average of 23.4% |
|
|
Source: Cytonn Research Investment opportunities are in areas that continue to exhibit growing demand from homebuyers offering investors double digit returns and relatively quick uptake supported by availability for land for development, whereas demand is boosted by presence social amenities and relatively good infrastructure. |
||||
- Commercial Sector
In 2018, the commercial real estate sector recorded mixed performance with commercial office spaces recording a 0.2% points y/y increase in rental yields attributed to an improved macroeconomic environment, hence boosting economic activities, while the retail sector recorded 0.6% points decline in rental yields as a result of retail space oversupply, currently at 2.0 mn SQFT. In 2019, we expect a slowdown in performance mainly as a result of the surplus supply in the commercial office and retail theme, which have an oversupply of 5.3 mn SQFT and 2.0 mn SQFT, respectively. The sector, however, has pockets of value in differentiated concepts such as Mixed-Use Developments (MUD) with the right balance between the incorporated uses in order to achieve optimal returns and serviced offices that attract yields of 13.4%, in areas such as Westlands, as well as areas with a low supply of both retail and office spaces such as Gigiri in Nairobi and in County Government Headquarters in the Mt. Kenya region and Mombasa County recording a rental yield of 8.3% and 9.9%, respectively, in the retail sector.
- Commercial Office Sector
The commercial office sector performance in 2019 will be driven by i) Nairobi positioning itself as a regional and continental hub hence attracting multinationals who set up regional offices in Kenya thus increasing demand for office space, ii) growth of professional services and SMEs, with the formal employment growing at 4.0% in 2017 compared to 3.0% in 2016, iii) devolution that has created demand for office spaces in counties to cater for County Governments and businesses that are expanding to county headquarters, and iv) increasing foreign direct investments (FDI) recording 70.7% increase to Kshs 67.1 bn in 2017 from Kshs 39.3 bn in 2016, hence increased demand for offices, especially Grade A offices in key commercial hubs such as Westlands and Kilimani.
The main challenge that will affect the sector’s expected performance will be competition as a result of oversupply with the sector expected to have an oversupply of 5.7mn SQFT in 2019 a 7.5% increase from 2018’s oversupply of 5.3 mn SQFT.
The table below summarizes the performance for office from 2011 to 2018 and our forecast for 2019;
|
Summary of Commercial Office Returns in Nairobi Over Time |
|||||||||
|
Year |
FY'13 |
FY’15 |
FY’16 |
FY’17 |
FY'18 |
Annualized Change 2013-2018 |
2019F |
Reason for Forecast |
Outlook |
|
Occupancy (%) |
90.0% |
89.0% |
88.0% |
82.6% |
83.3% |
(1.5%) |
82.0% |
Despite the marginal increment in 2018, we do not foresee increase in occupancy given the current oversupply of 5.3mn SQFT in 2018 and expected to increase to 5.7mn in 2019, we therefore, expect occupancy rates to stagnate or decline slightly by 1.3% points to average at approximately 82.0% in 2019 |
Negative |
|
Asking Rents (Kshs/Sqft) |
95 |
97 |
103 |
101 |
102 |
1.4% |
102 |
Despite the 1.4% growth in asking prices over the last 5-years, we expect monthly rental charges to remain at Kshs. 102 per SQFT per month, just as the market has been charging over the last three-years, as the market absorbs the current stock |
Neutral |
|
Average Prices (Kshs/Sqft) |
12,433 |
12,776 |
13,003 |
12,649 |
12,573 |
0.2% |
12,485 |
Asking prices have been growing by 0.2% between 2013 and 2018, however there was a market price correction starting 2016 hence recording a 0.7% decline (2015-2018) due to the oversupply of office space. We therefore expect the prices to drop by 0.7% to average at Kshs 12,485 in 2019 |
Negative |
|
Average Rental Yields (%) |
8.3% |
8.1% |
8.4% |
7.9% |
8.1% |
(0.4%) |
8.0% |
We expect office yields to average at 8.0%, 0.1% points lower than 2018 average, in the Nairobi market mainly as a result of increase in supply and thus lower occupancy rates |
Negative |
|
We expect the performance of the commercial office theme to decline slightly in 2019 with average rent, price, occupancy and yields rates coming in at Kshs 102 per SQFT, Kshs 12,485 per SQFT, 82.0% and 8.0%, respectively, from Kshs 102 per SQFT, Kshs 12,573 per SQFT, 83.3% and 8.1%, respectively, in 2018 mainly due to the current office oversupply at 5.3mn SQFT and increasing supply with the expected opening of Garden City Business Park along Thika Road and Global Trade Centre in Westlands. There are pockets of value for investment in the sector in concepts with low supply and high returns such as Serviced offices, which have rental yields of 13.4% and a market share of 0.35%. |
|||||||||
Source: Cytonn Research
Our outlook for the commercial sector is NEGATIVE as the sector’s performance continues to be constrained by oversupply, with the Nairobi region expected to experience an oversupply of up to 5.7 mn SQFT in 2019. The sector however has pockets of value in differentiated concepts such as serviced offices that attract yields of 13.4% such as Westlands, as well as areas with low supply office spaces such as Gigiri and Karen.
- Retail Sector
The retail sector performance in 2019 will be driven by:
- The continued expansion of international retailers such as Carrefour, Shoprite and Game and local retailers such as Naivas, who will then increase retail space uptake,
- Positive demographics characterized by a high population growth rate of 2.5% p.a., urbanization rate of 4.3% and a rapidly expanding middle class who create demand for retail services, and
- Increasing purchasing power with GDP per Capita growing at a rate of 7.9% p.a. over the last 5-years, from Kshs. 113, 539 in 2013 to Kshs. 166,314 in 2017, hence high purchasing power that creates sustained demand for retail products.
The sector will, however, be constrained by the oversupply in the sector currently at 2.0 mn SQFT and the expected increase in supply as a result expected opening of malls in the pipeline such as Crystal Rivers Mall in Athi River and The Well in Karen.
The table below summarizes the performance of the retail sector starting 2016 and our outlook for 2019;
|
Nairobi’s Retail Sector Performance 2016-2019F |
|||||||
|
Item |
FY’16 |
FY’17 |
FY' 18 |
Annualized Change 2016-2018 |
2019F |
Reason for Forecast |
Outlook |
|
Asking Rents (Kshs/SQFT) |
186.9 |
185.2 |
178.2 |
(1.6%) |
175.4 |
We expect asking rents to soften, reducing by 1.6% to Kshs 175.4 from Kshs 178.2 as a result of the retail space oversupply currently at 2.0mn SQFT |
Negative |
|
Supply in Nairobi (mn SQFT) |
5.9 |
6.2 |
6.5 |
3.3% |
7.3 |
Supply of retail space has grown at an average rate of 3.3% p.a from 2016 to 2018 and is expected to increase by 12.3% to 7.3mn SQFT in 2019 due to opening of malls such as The Well in Karen and Mt. View mall along Waiyaki way that will add 78,000 SQFT and 91,000 SQFT, respectively. |
Negative |
|
Occupancy (%) |
89.30% |
80.30% |
79.80% |
(3.7%) |
76.9% |
Due to the current oversupply of retail space and expected opening of malls in the pipeline, we expect occupancy rates to decline by 2.9% points to 76.9% |
Negative |
|
Average Rental Yields |
10.00% |
9.60% |
9.00% |
(3.3%) |
8.7% |
Mainly as a result of increase in supply and thus lower occupancy rates, we expect retail yields in Nairobi to soften slightly by 0.3% points to an average of 8.7% |
Negative |
|
The performance of the retail sector is expected to soften, with asking rents, occupancy rates and yields declining by 1.6%, 2.9% points and 0.3% points, respectively, to average at Kshs. 175.4, 76.9% and 8.7% |
|||||||
Source: Cytonn Research
From the above table, retail operators’ performance outlook is negative; however, we expect the continued entry of international retailers and expansion of local retailers, who will cushion the market hence have a general NEUTRAL outlook for the sector. The opportunity is in county headquarters in some markets such as Mombasa and Mt. Kenya regions that have retail space demand of 0.3mn and 0.2mn SQFT, attractive yields at 8.3% and 9.9% and occupancy rates at 96.3% and 84.5%, respectively.
- Mixed Use Development (MUD) Sector
In 2018, MUDs encompassing office, retail and residential themes recorded an average weighted rental yield of 8.0% in 2018. In 2019, we expect to see increased Mixed Use Developments as investors diversify their real estate portfolios, given the real estate space surplus with office and retail theme recording an oversupply of 5.3 mn and 2.0 mn SQFT space, respectively in Nairobi Metropolitan Area. MUDs are suitable for developers and investors looking to diversify their real estate portfolio driven by the following advantages; i) operational synergies whereby one’s theme performance complements the others, ii) multiple revenue streams that help to diversify the risk of a project, for example in case uptake for one of the themes is low, the developer or property manager will continue to receive revenues from the other themes, iii) economies of scale achieved through effective use of space/land hence maximization of returns as well as shared infrastructure and facilities such as lifts, parking, and lobbies resulting in savings on construction and operational costs, and iv) greater efficiency for occupants where MUDs create an environment where occupants can live, work, play and invest all in one location, hence reducing time and cost incurred while commuting.
Based on the above advantages, our outlook for MUD is POSITIVE, therefore, a viable investment suitable for developers and investors looking to diversify their real estate portfolio. Key to note is that the success of a Mixed-Use Development significantly depends on how the right balance between the incorporated uses in a Mixed-Use Development in order to achieve optimal returns. The investment opportunity within the Nairobi Metropolitan Area is in areas such as Limuru Road, Karen, Upperhill and Kilimani recording the highest rental yield returns of 9.7%, 9.4%, 8.7%, and 8.6%, respectively.
- Hospitality Sector
In 2018, the hospitality sector registered improvement in performance, evidenced by the 2.1% points increase in the serviced apartments rental yield to 7.4%, from 5.3% recorded in 2017, attributable to increased demand, which has triggered an increase in charge rates, as well as increased occupancy rates with an average of 80.0% in 2018, compared to 72.0% in 2017. The improved performance was fueled by the stable political environment and improved security, making Nairobi an ideal destination for both business and holiday travelers, resulting to a 39.8% increase in international arrivals to 2.0 mn recorded in 2018, from 1.4 mn in 2017, according to Leading Economic Indicators October 2018.
In 2019, we expect the sector, the sector to record increased activities, driven by;
- Continued Marketing Efforts - Continued marketing of the country as a destination for experiences including the free visa on arrival for Africans countries, continues to enhance the growth of international arrivals. For 2019, we expect the marketing to continue enhancing tourism, with the allocation of Kshs 1.0 bn in the 2018/2019 national budget, similar to the amount allocated in the 2017/2018 budget aimed at to scaling up promotion of tourism,
- Improving Air Transport - 2018 recorded improved flight operations and systems making it easier and more convenient for travelers with several airlines increasing their frequencies in and out of the country. We expect this to result in increased arrivals in 2019, thus a rise in demand for hospitality services. Some this include, Kenya Airways which launched direct flights to the US from Kenya the airline will be operating daily flights to and from New York and Nairobi,
- Sustained Domestic Tourism - Domestic tourism continues to grow with Kenyans accounting for more than 50.0% of the total hotel bed nights in Kenya. According to Economic Survey 2018, Kenyans occupied 50.8% of the total beds in 2017, 54.2% in 2016 and 53.7% in 2015. We expect this to continue resulting in growth of demand for accommodation and conference services, and
- An Increase in International Arrivals - The number of tourist arrivals recorded a 39.8% increase in tourist arrivals from 1.4 mn 2017 to 2.0 mn in 2018, fueled by the return of political calm following the completion of the electioneering period in 2017. We expect the trend to continue given the political stability in the country, thus attracting tourists for both holiday and business.
Source: KNBS, Cytonn Research 2018
The hospitality sector recorded a 5-year slump between 2011 and 2015 caused by insecurity and terrorism. However, the number of international arrivals into the country has been on the rise growing by a 3-year CAGR of 19.7% since 2015, and by an annual rate of 39.8% to 2.0 mn in 2018. For 2019, we expect the number of international arrivals to grow by an annual appreciation of 30.0% to approximately 2.6 mn, resulting in a greater demand for hospitality services, with the investment opportunity being in Kilimani and Westlands markets, which recorded relatively high rental yields of above 10.0%.
We therefore retain a POSITIVE outlook for the hospitality sector, as we expect continued demand for hospitality services thus the occupancy rates in the serviced apartments sector coming in above 80.0%, and a resultant rental yield of above 7.0%.
- Land
In 2018, the land sector recorded a slowdown in performance with an annual appreciation of 3.3% and a 7-year CAGR of 13.7%, compared to annual appreciation of 4.2% and a 7-year CAGR of 17.4%, respectively, in 2017, attributed to the uncertainty surrounding statutory approvals particularly in light of the demolitions of allegedly illegally approved buildings in 2018, thus decreased transactions in the land sector. In 2019, we expect the performance to remain positive, fueled by:
- investor demand for development land especially in satellite towns where infrastructure has been improving, in addition to land in these areas being relatively affordable and available in bulk,
- Kenya’s population growth rate at 2.5% p.a, rapid urbanization at 4.3% p.a, and the growing middle class, which has continued to create demand for development land. In addition, according to a Home Ownership Survey by Kenya Bankers Association, 68.0% of home ownership is mainly through building, and
- the improving infrastructure such as road networks as the Kenyan Government continues to intensify efforts to improve infrastructure in the country, evidenced by the significant 2018/2019 national budget allocation of Kshs 418.8 bn, which is 13.6% of the budget, to infrastructural development.
As a result, in 2019, we expect an annual capital appreciation of 4.9%, as the market slowly recovers from the 3.3% appreciation recorded in 2017/2018. Unserviced land in satellite towns such as Ruiru and Syokimau are expected to record the highest capital appreciation of 6.7%, attributable to high demand as developers and investors prefer to buy unserviced plots and service instead of paying a premium charged by land sellers for the services, facilities and amenities provided, the affordability compared to land in urban areas and the availability of land in bulk.
However, main challenges likely to face the sector include; i) a possible decline in land transactions attributed to the uncertainty surrounding statutory approvals following demolition of allegedly approved buildings in 2018, ii) relatively high land costs of up to Kshs 500 mn per acre in areas such as Upperhill, hence impacting on financial viability on returns to investors as rental charges remain flat, and iii) limited access to financing for developers and investors as the effective cost of credit remains high, averaging at 18.0%, despite the capping of interest rates.
The summary of the previous performance of the theme and 2019 outlook is as outlined below:
|
All values in Kshs unless stated otherwise |
|||||||||||
|
Summary of the Performance Review and Outlook |
|||||||||||
|
Location |
*Price 2011 |
*Price 2015 |
*Price 2016 |
*Price 2017 |
2018 |
2019f |
7-year CAGR |
% Price Change from 2011 |
Annual Capital Appreciation (2018) |
Annual Capital Appreciation (2019) f |
|
|
Satellite Towns - Unserviced Land |
9m |
16m |
21m |
22m |
23m |
24m |
14.1% |
3.5 |
5.7% |
6.7% |
|
|
Nairobi Suburbs - Low Rise Residential Areas |
56m |
91m |
106m |
109m |
86m |
91m |
6.5% |
2.6 |
4.6% |
5.3% |
|
|
Nairobi Suburbs - Commercial Areas |
156m |
377m |
458m |
478m |
493m |
517m |
17.8% |
3.3 |
5.4% |
4.9% |
|
|
Nairobi Suburbs - High Rise Residential Areas |
46m |
80m |
97m |
103m |
135m |
140m |
16.8% |
2.4 |
0.2% |
3.9% |
|
|
Satellite Towns - Site and Service Schemes |
6m |
13m |
14m |
15m |
14m |
15m |
13.3% |
3.5 |
0.6% |
3.5% |
|
|
Average |
13.7% |
3.1 |
3.3% |
4.9% |
|||||||
|
• In 2019, we expect the performance to remain positive, informed by the historical performance over 7-years, as from 2011 to 2018 |
|||||||||||
|
Source: Cytonn Research |
|||||||||||
The investment opportunity in the Nairobi Metropolitan Area land sector lies in Satellite Towns such as Ruaka, Utawala, Ruiru and Thika, supported by high capital appreciation of 16.2%, 17.5%, 4.7%, 7.7% y/y capital appreciation, respectively, in addition to other areas such as Kilimani, Karen and Kitisuru, which had rates of 10.7%, 8.2% and 10.5% y/y capital appreciation, respectively.
We retain a POSITIVE outlook for the land sector with a bias to satellite towns, with unserviced land prices expected to record a 6.7% annual appreciation in 2019, due to the high demand boosted by their affordability, availability of development land and the improving infrastructure in the areas.
- Infrastructure Sector
The infrastructure sector was vibrant in 2018 supported by significant investment by the Kenyan Government as part of its expansion plans in line with the Big Four Agenda. The budget allocation towards infrastructural development has been growing by a 6-year CAGR of 7.7% to Kshs 611.4 bn in 2018/19 from Kshs 251.1 bn in 2013/14. The increased allocation shows the government’s efforts aimed at transforming the country to middle-income status by 2030. In 2018, the infrastructure sector recorded several activities among them; the launching of the construction of Western Bypass, and the dualling of Ngong Road Phase 2.
For financial year 2018/19, Kshs 418.8 bn, which is 13.6% of the budget, was allocated to the infrastructure sector. The allocation was in a bid to increase the average Gross Domestic Product (GDP) rate from the 4.9% recorded in 2017, to 5.5% in 2018 as forecasted by the World Bank. However, the budget allocation towards infrastructure development was 31.5% lower than the Kshs 611.4 bn allocated for the financial year 2017/18 as shown below:
Our outlook for the infrastructural sector is NEUTRAL as we expect reduced infrastructural activities during H’1 2019 due to the reduced budget allocation from the previous year attributable to the government’s financial constraints, given the country’s public debt which currently stands at 56.4% of the GDP, in addition to the national revenue collection deficit of 38.0% as at June 2018. We however expect execution of the planned infrastructure development such as sewer connection in Ruiru and Kitengela, water improvement program and proposed light rail, which will allow for higher density construction and boost real estate.
Nairobi and Kiambu Counties offer the best real estate investment opportunity due to presence of a relatively adequate transport network and good water & sewerage coverage. In 2019, we expect the counties to remain attractive and real estate developers to align their projects with the ongoing infrastructural projects given the expected benefits including higher demand, price appreciation and savings on construction costs.
- Listed Real Estate Outlook
In 2018, the Fahari I-REIT closed the year with a trading price of Kshs 10.95, a 4.8% rise from Kshs 10.45 at the beginning of 2018 and 47.4% decline its initial price of Kshs 20.8 in November 2015. The average share price in 2018 was Kshs 10.6, 6.0% lower than the average price of Kshs 11.3 in 2017.
The REIT’s performance in 2018 was largely limited by a poor market sentiment with investors inclining towards brick and mortar real estate which offered higher yields for retail, office sector and government securities at 9.0%, 8.1% and 8.7% respectively in 2018, against an average yield of 5.7% earned from the REIT in H1’2018. The low yield is attributable to the poor performance of assets in its portfolio, e.g Greenspan Mall which has an occupancy of 74.0% compared to the market average at 79.8%, and also due to a large portion of revenues, at approximately 54.4% going into professional fees.
In May 2018, the REIT acquired an additional 3,780 SQM property, 67 Gitanga Place in Lavington, at Kshs 850.0 mn bringing the total share of assets invested in real estate to 90% and the total properties owned by the REIT to four the others being: (i) Greenspan Mall, (ii) Signature International Limited, and (iii) Bay Holdings Limited. The new acquisition is expected to generate an income of Kshs 73.8 mn annually and thus generate a rental yield of 8.7%.
Having opened the year with a trading price of Kshs 10.75, we expect the REIT to continue trading at low prices and in low volumes in 2019. With the new acquisition, we expect growth in revenues and project 0.3% points increase in dividend yield to 6.8% from 2018 earnings (at a price of Kshs 10.25 per share as at 11th January 2019), from a 6.5% yield recorded from 2017 earnings.
Our outlook for listed real estate is NEGATIVE as the performance is constrained by continued lack of investor appetite for the instrument and poor performance of the assets in its portfolio.
THE KEY AREAS OF OPPORTUNITIES BY THEME IN REAL ESTATE SECTOR
Based on returns, factors such as supply, demand, infrastructure, land prices and availability of social amenities the following are the ideal areas for investment;
|
The Key Areas of Opportunities by Theme in Real Estate Sector |
|||
|
Sector |
Themes |
Locations |
Reasons |
|
Residential Sector |
Detached Units |
Runda Mumwe, Juja, Kitisuru, and Karen |
Relatively high returns of approximately 14.8%, 10.3%, 8.9% and 8.8% respectively |
|
Apartments |
Riverside, Kilimani, Donholm/Komarock |
Relatively high returns of approximately 11.6%, 11.5& and 14.4% respectively, availability of amenities, infrastructural development |
|
|
Commercial Office Sector |
Grade A Offices |
Gigiri, Karen |
Relatively low supply, proximity to commercial hubs and high yields of 10.5% and 9.2%, respectively |
|
Serviced Offices |
Westlands |
Prime commercial hubs with high occupancy of 85.5% and yields of 15.8% |
|
|
Retail Sector |
Suburban Malls |
Counties such as Mombasa and Mt. Kenya Regions |
Mombasa and Mt. Kenya regions, record attractive yields at 8.3% and 9.9% and occupancy rates at 96.3% and 84.5%, respectively |
|
Mixed Use Developments (MUDs) |
MUD |
Limuru Road, Karen |
Affluent neighbourhoods with high rental yield return of 9.7% and 9.4%, respectively |
|
Hospitality Sector |
Serviced apartments |
Kilimani and Westlands |
Attractive rental yields of 10.9% and 10.6% respectively, easy access from Jomo Kenyatta International Airport (JKIA), proximity to business nodes such as Upperhill, and the good transport network thus ease of accessibility |
|
Land Sector |
Satellite towns |
Ruaka, Utawala, Ruiru and Thika |
The relatively high capital appreciation of above 10.0% y/y, the provision of trunk infrastructure such as road networks and the growing demand for development land |
|
Suburbs |
Kilimani, Karen and Kitisuru |
The relatively high capital appreciation of above 10.0% y/y, proximity to amenities |
|
Source: Cytonn Research 2018
Disclaimer: The Cytonn Weekly is a market commentary published by Cytonn Asset Managers Limited, “CAML”, which is regulated by the Capital Markets Authority. However, the views expressed in this publication are those of the writers where particulars are not warranted. This publication is meant for general information only, and is not a warranty, representation, advice or solicitation of any nature. Readers are advised in all circumstances to seek the advice of a registered investment advisor.

- Talk to us
- Kenya
- P.O Box 20695 - 00200, Nairobi, Kenya
- Cell +254709101200
- Tel +254709101200
- WhatsApp +254741676635
- United States
- +254709101200
- DOWNLOAD OUR APP
-


- Kenya
- 8th Floor, Pinetree Plaza, Kaburu Drive, Ngong Road, Nairobi, Kenya
- USA
- Suite 1150, 1775 Eye Street NW, USA, Washington DC 20006, USA
- Investments
- High Yield
- Private Equity
- Real Estate
- Real Estate
- RiverRun Estates
- Cytonn Towers
- The Ridge
- Taraji Heights
- The Alma