Cytonn Annual Markets Review – 2019
By Research Team, Jan 5, 2020
Executive Summary
Global Markets Review
Global economic growth is expected to come in at 3.0% in 2019 as per data from the International Monetary Fund (IMF), significantly lower than the 3.6% recorded in 2018. This performance has mainly been driven by increased policy uncertainty across major economies amidst trade tensions such as the ongoing US – China Trade War, which has weakened business sentiments, hence causing a reduction in industrial output. Central Banks’ policy stance in advanced economies adjusted towards economic easing, with the US Federal Reserve cutting the Federal Funds rate in July and September. The European Central Bank also reduced its deposit rate and announced the resumption of quantitative easing;
Sub-Saharan Africa Region Review
According to World Bank’s latest African Pulse Issue, Sub-Saharan Africa’s economic performance remained sluggish in 2019 with their preliminary projections indicating that the region grew marginally by 2.6% in 2019 from 2.5% in 2018. The growth was hampered by a challenging external environment, which saw the softening of global growth, falling commodity prices, increased trade tensions leading to heightened uncertainty, and subdued agricultural production partly due to drought in various countries in the region, coupled with security concerns, which affected production in some countries;
Kenya Macro Economic Review
The Kenyan economy recorded slower levels of economic growth, averaging 5.4% for the first three quarters of 2019, compared to an average of 6.0% in a similar period in 2018, which was driven by (i) a slowdown in agricultural activities, which saw the sector record an average growth of 4.2% for the first 3 quarters of 2019, representing a 1.1% points decline from the 5.3% recorded in the same period of review in 2018, and (ii) decreased output in transport and electricity activities, which grew on average by 7.0% and 5.5% in the first 3 quarters of 2019, representing declines of 1.6% points and 2.1% points, respectively, compared to the 8.6% and 7.6% recorded in the same period of review in 2018, respectively;
Fixed Income
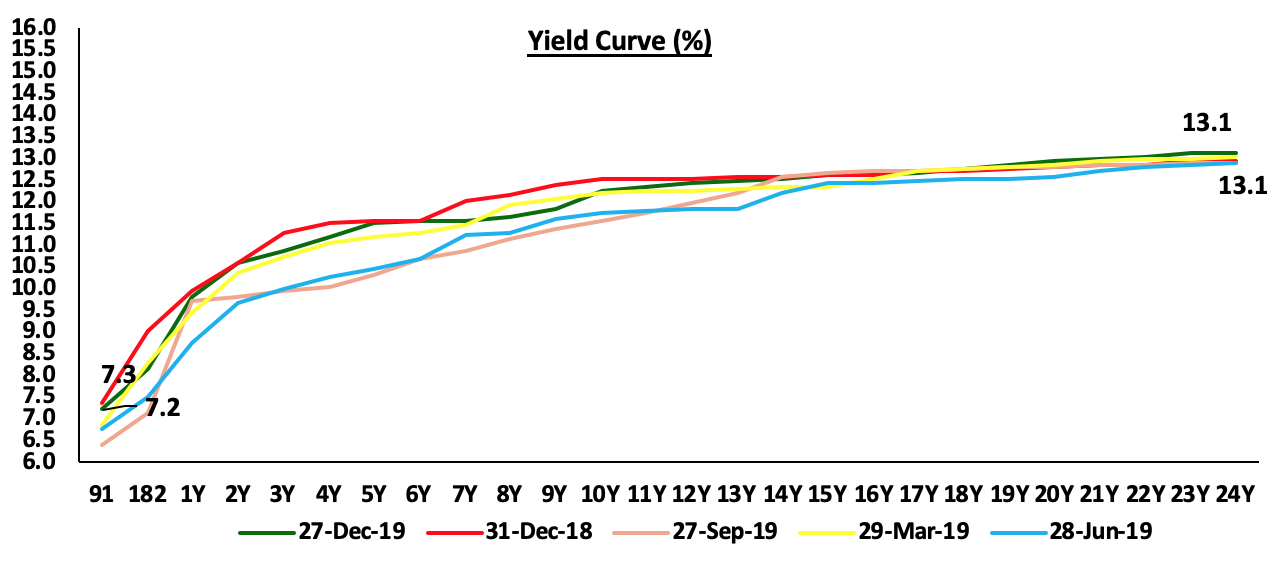
During the year 2019, T-bill auctions remained oversubscribed, with the average subscription rate coming in at 118.7%, a slight decline from 123.2% recorded in 2018. The yield on the 91-day, 182-day and 364-day T-bills declined by 10 bps, 80 bps and 20 bps to close at 7.2%, 8.2% and 9.8% in 2019 from 7.3%, 9.0% and 10.0% at the end of 2018, respectively. This is mainly attributed to the Central Bank of Kenya’s (CBK’s) efforts to keep rates low by rejecting expensive bids in the auction market. Primary T-bond auctions in 2019 were oversubscribed with the subscription rate averaging 109.7%, which is higher than the average subscription rate for 2018, which came in at 75.8%. The yield curve experienced downward pressure for the better part of the year as the Kenyan Government contained rates by rejecting expensive bids in the auction market. The repeal of the rate cap, however, led to the gain of some long-term government securities such as the 20 and 23-year papers, which gained by 0.8% points and 1.4% points in 2019;
Equities
During the year, the Kenyan equities market recorded mixed performance, with NASI and NSE 25 gaining by 18.5% and 15.5%, respectively, while NSE 20 declined by 6.3%. Large cap gainers during the year included Equity Group, KCB Group, Safaricom, NCBA, Barclays, Co-operative Bank and EABL which gained by 53.5%, 44.2%, 41.9%, 32.6%, 21.9%, 14.3% and 13.6%, respectively. Listed banks recorded an average increase in core earnings per share of 8.7%, slower compared to an average growth of 16.2% in Q3’2018, while listed insurers recorded an average increase in core earnings per share of 3.2%, an improvement compared to an average decline of 0.6% in H1’2018. This year, 10 companies issued profit warnings to investors compared to 8 companies in 2018, while 2 companies, namely KenolKobil and Atlas Development and Support Services were delisted from trading at the Nairobi Stock Exchange, with Mumias Sugar being suspended from the bourse. The major legislative change that affected the equities market during the year was the repeal of the rate cap law in the last quarter of 2019;
Real Estate
In 2019, the real estate sector registered an average growth rate of 4.8% in the first three quarters, 0.3% points higher than the average growth rate recorded over the same period in 2018, as per the Kenya National Bureau of Statistics (KNBS) Quarterly Gross Domestic Product Report Q3'2019. The growth is attributable to factors such as the continued enhancement of infrastructure boosting Nairobi’s positioning as a regional hub, attracting foreign direct investment, as well as positive demographic growth. In terms of sector performance, commercial office, retail, residential, mixed-use developments and serviced apartments sectors registered average rental yields of 7.5%, 7.8%, 5.0%, 7.3%, and 7.6%, respectively, resulting to an average rental yield for the real estate market of 7.0%, 0.4% points lower compared to 7.4% recorded in 2018. Therefore, with a capital appreciation for existing properties at 2.0%, average total returns came in at 9.0%, which is a 2.2% points decline from 11.2% recorded in 2018, attributable to a decline in effective demand for property amidst tough economic times.
- Weekly Rates:
Cytonn Money Market Fund closed the week at a yield of 10.9% p.a. To subscribe, just dial *809#;
Cytonn High Yield Fund closed the week at a yield of 13.9% p.a. To subscribe, email us at sales@cytonn.com;
- Phase 1 of The Alma is now 100% sold with early buyers having achieved up to 55% capital appreciation. For inquiries, please email us on clientservices@cytonn.com. The site is open between 8 am - 5 pm, 7-days a week for site visits;
- For an exclusive tour of Cytonn’s real estate developments, visit: Sharp Investor's Tour and for more information, email us at sales@cytonn.com;
- We continue to hold weekly workshops and site visits on how to build wealth through real estate investments. The weekly workshops and site visits target both investors looking to invest in real estate directly and those interested in high yield investment products to familiarize themselves with how we support our high yields. Watch progress videos and pictures of The Alma, Amara Ridge, and The Ridge;
- We continue to see very strong interest in our weekly Private Wealth Management Training (largely covering financial planning and structured products). The training is at no cost and is open only to pre-screened participants. We also continue to see institutions and investment groups interested in the training for their teams. Cytonn Foundation, under its financial literacy pillar, runs the Wealth Management Training. If interested in our Private Wealth Management Training for your employees or investment group, please get in touch with us through wmt@cytonn.com. To view the Wealth Management Training topics, click here;
- For recent news about the company, see our news section here;
We have 10 investment-ready projects, offering attractive development and buyer targeted returns. See further details here: Summary of Investment-Ready Projects
The year 2019 was characterized by a slow-down in global growth, which was weighed down by the negative effects of the trade conflicts among the major economies. These include:
- An on-going trade dispute between the US and China,
- Uncertainty in Britain over its exit from the European Union (“Brexit”),
- Geopolitical tension between the US and Iran, disrupting the mid-stream and down-stream oil supply channel, and,
- Overall slowing global trade, which, according to the World Trade Organization, is forecasted to grow by 1.2% in 2019.
According to IMF, global GDP growth in 2019 is expected to come in at 3.0%, a 0.3% point downgrade from their initial projection from the April 2019 World Economic Outlook, and lower than the 5-year average of 3.5%. The IMF downgraded their expectations mainly as a result of uncertainty about prospects for some economies in the Eurozone, which include the slowdown in the German economy, and a projected slowdown in China and the United States, which have resulted in a much more subdued pace of global activity.
The World Trade Organization (WTO) lowered their outlook for world trade growth in 2019 to 1.2%, from their 2.6% expectation in April 2019, citing that the ongoing trade conflicts pose the biggest downside risk. The uncertainty generated by the continuous trade conflicts has had the impact of reducing international trade as export and import growth slowed down across all regions.
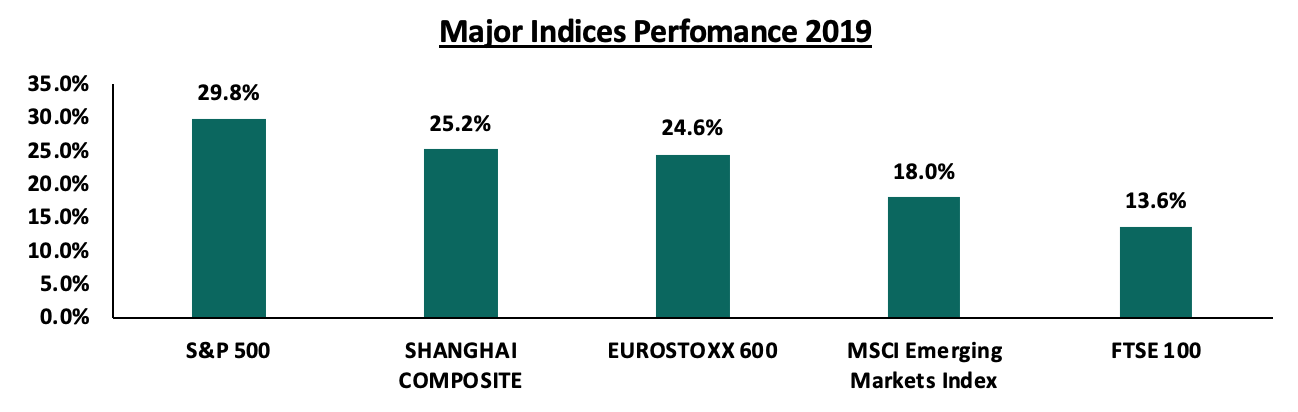
Global equity markets registered gains during the year, as shown in the chart below, as gains were realized by US technology giants, a recovery in the Eurozone supported by the late inflow of funds resulting from the December general election, and Asian stocks that have benefited from the government’s hiked spending on construction and infrastructure projects. Stock markets surged despite the ongoing trade disputes and warnings of a slowing growth in major economies such as Germany.
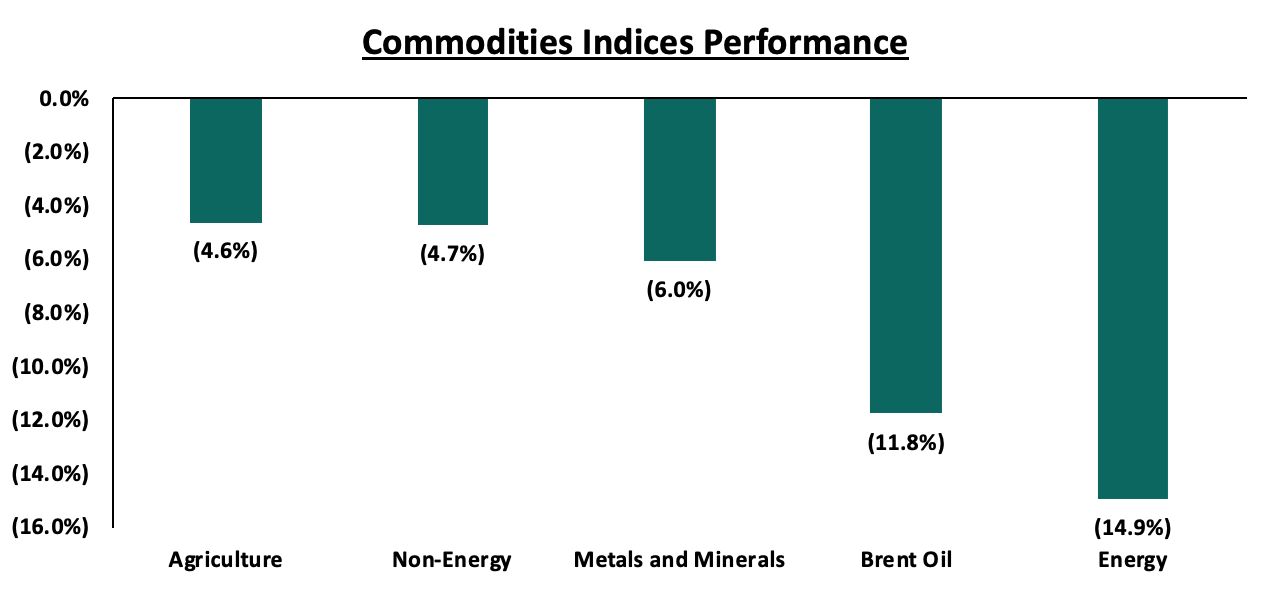
Global commodities registered declines in 2019, with agriculture, non-energy commodities, metals & minerals and Brent oil registering declines of 4.6%, 4.7%, 6.0%, and 11.8%, respectively, while energy was the biggest decliner falling by 14.9%, according to the World Bank Commodity Prices Index. The decline in energy was largely driven by slowing global demand during the year. Below is a chart highlighting the performance of select commodity indices:
United States
The US economy grew at a rate of 2.1% in Q3’2019, weaker than the 3.0% recorded in Q3’2018, and lower than the expected growth for 2019 at 2.6% (as per the IMF). This performance was driven by gains in the labor market, which picked up towards the end of the year. Also, trade tensions between the US and China cooled down as the UK elections cleared the uncertainty around the Brexit. The economy held-up well considering the economic slowdown is being experienced worldwide. Business investment was low during the year as a result of the global slowdown in manufacturing activity and the trade dispute with China. The labor market has remained strong, with Non-Farm Payroll (NFP) increasing by 266,000 in November 2019. This has seen the unemployment rate fall to a 49-year low of 3.6%.
The Federal Open Monetary Committee, for the first half of the year, maintained the Federal Funds Rate at a range of 2.25% - 2.50% and slashed the same in the July meeting to 2.00% - 2.25%, in the September meeting to 1.75% - 2.00% and in the December meeting to the current range of 1.50% - 1.75%. This was in an effort to spur spending amid the global economic uncertainty experienced through the year. Compared to 2018, where in the beginning of the year the range started at 1.25% - 1.50% and ended the year at 2.25% - 2.50%, there has been an easing in monetary policy evidenced by the lowering of the Federal Funds Rate. This move was driven by:
- Weakened business investment and international trade amid falling manufacturing as a result of slower global growth and trade policy tensions, and,
- Muted inflationary pressure with the November inflation rate of 1.8%, being below the government’s target of 2.0%
The stock market registered gains, with the S&P 500 gaining by 29.8% in 2019, which is the best performance since 2013. This performance was mainly supported by a surge in technology stocks and the renewed hope from the phase-one trade deal between the US and China, which is set to be signed early 2020. In terms of valuations, the Cyclically Adjusted Price/Earnings (CAPE) ratio is currently at 30.0x, 78.6% above the historical average of 16.8x, indicating the market remains overvalued relative to historical levels.
Eurozone
Economic growth in the Eurozone remained resilient towards the end of the year despite the expectations of a slowdown from the Brexit uncertainty and trade tensions. GDP expanded by 0.2% in Q3’2019, taking the expected growth to 1.1% in 2019, weaker than the 1.8% growth seen in 2018. This modest growth was underpinned by healthy consumer spending despite the significant drop in industrial production.
The European Central Bank (ECB) maintained the base lending rate at 0.0%, and the rates on the marginal lending facility at 0.25%, while it reduced its deposit rates by 10 bps to (0.5%) from (0.4%), and introduced a fresh stimulus package by restarting its bond purchases of EUR 20.0 bn a month from November.
The Stoxx 600 index gained by 24.6% in 2019. This performance was mainly supported by late inflows that came in after the General Election in the UK which aided in clearing uncertainties around the Brexit. Also, easing trade tensions as a result of the proposed phase-one trade deal between the US and China. The P/E ratio currently at 15.0x, is 23.1% below the historical average of 19.5x, indicating markets are currently trading at relatively cheaper valuations.
China
China’s economic growth slowed down to a near 30-year low of 6.0% in Q3’2019, lower than the expected GDP growth for 2019, 6.2% (according to the IMF), although still within the government’s target of 6.0% - 6.5%. This performance is partly attributable to the effects of the trade-conflicts with the US and poor volumes in-terms of industrial production.
The Shanghai Composite index gained by 25.2% during the year 2019. The gains were mainly supported by expectations of a positive outcome following resumption of trade talks with the United States, coupled with increased capital injection by the government, which improved investor confidence. The P/E ratio currently at 14.7x, is 0.2% above the historical average of 14.5x, indicating that the market is currently trading at slightly more expensive valuations.
According to World Bank’s latest African Pulse Issue, Sub-Saharan Africa’s economic performance remained sluggish in 2019 with the preliminary projections indicating that the region grew marginally by 2.6% in 2019 from 2.5% in 2018. The growth was hampered by a challenging external environment, which saw the softening of global growth, falling commodity prices, increased trade tensions leading to heightened uncertainty, and subdued agricultural production partly due to drought in various countries in the region, coupled with security concerns, which affected production in some countries.
Currency Performance
Regional currencies were relatively volatile in 2019, which saw mixed performance against the US Dollar in various countries. The volatility was partly attributable to:
- Uncertainty in the global markets, which included the trade war between China and the US that put pressure on emerging market currencies, and,
- The sustained series of US Fed rate cuts, which saw three interest rate cuts in the second half of 2019 leading to improved performance of various currencies in the African region compared to the first of the year driven by the cash outflows by yield seeking investors channeling funds to emerging markets due to the low interest rate environment in the US, thus putting additional pressure on the US Dollar.
Below is a table showing the performance of select African currencies, ranked by 2019 y/y change:
|
Select Sub Saharan Africa Currency Performance vs USD |
|||||||||
|
Currency |
Dec-17 |
Dec-18 |
Dec-19 |
2018 y/y change (%) |
2019 y/y change (%) |
||||
|
South African Rand |
12.4 |
14.3 |
14.0 |
(16.1%) |
2.5% |
||||
|
Botswana Pula |
9.8 |
10.7 |
10.5 |
(8.9%) |
1.8% |
||||
|
Ugandan Shilling |
3632.0 |
3699.3 |
3660.0 |
(1.9%) |
1.1% |
||||
|
Kenyan Shilling |
103.1 |
101.8 |
101.3 |
1.3% |
0.5% |
||||
|
Nigerian Naira |
306.4 |
307.0 |
306.0 |
(0.2%) |
0.3% |
||||
|
Tanzanian Shilling |
2235.0 |
2295.0 |
2293.0 |
(2.7%) |
0.1% |
||||
|
Malawian Kwacha |
713.5 |
719.8 |
729.1 |
(0.9%) |
(1.3%) |
||||
|
Mauritius Rupee |
33.4 |
34.2 |
36.2 |
(2.2%) |
(6.0%) |
||||
|
Ghanaian Cedi |
4.5 |
4.8 |
5.7 |
(6.6%) |
(17.4%) |
||||
|
Zambian Kwacha |
10.0 |
11.9 |
14.1 |
(19.2%) |
(18.1%) |
||||
Source: Reuters
African Eurobonds:
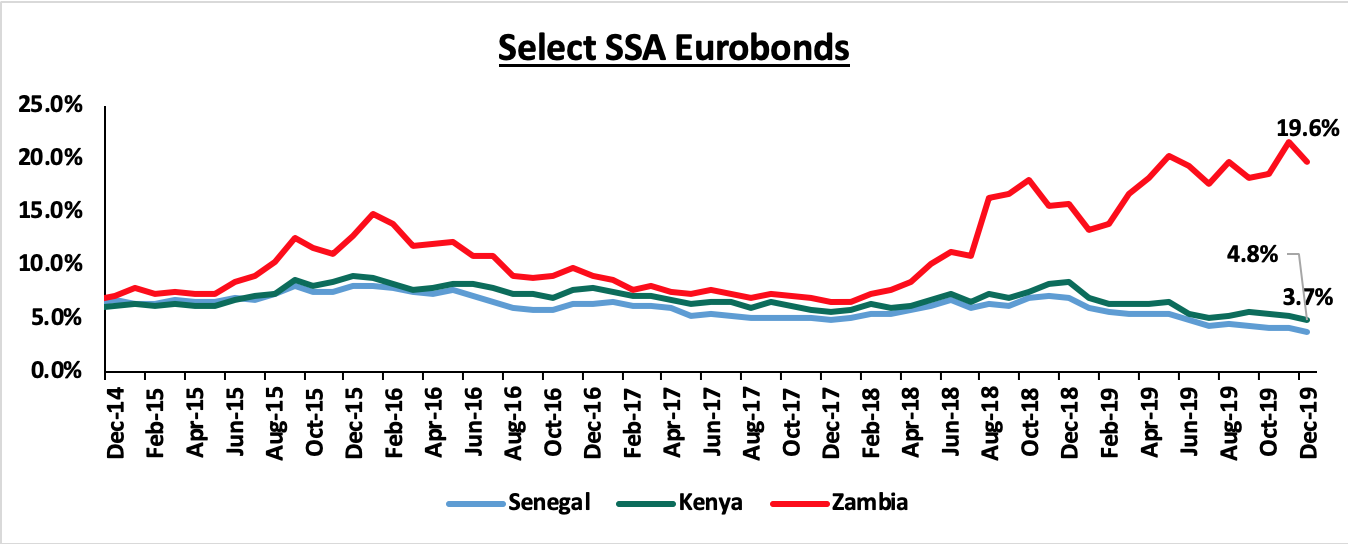
Yields on African Eurobonds generally declined in 2019. This was partly attributed to the adoption of a looser monetary policy regime in the Eurozone and the United States, thus leading to a decline in yields in advanced economies. As a result, there was increased investor interest in Africa’s debt market. Yields on the Zambia Eurobond however recorded a rise during the year, attributable to the exodus of foreign investors amid fears of the country’s debt sustainability, with most believing it to be close to default as the country is struggling with high debt levels. The debt to GDP ratio was estimated at 74.4%, further raising fears of a debt crisis in the country. This saw the downgrading of the Government of Zambia's long-term issuer ratings in Q3’2019 to Caa2 from Caa1, and the outlook changing to negative from stable.
Below is a graph showing the Eurobond secondary market performance of select 10-year Eurobonds issued by their respective countries:
Appetite for government securities in Sub-Saharan Africa remained strong in 2019, as risk-adjusted returns remained higher compared to those in developed economies. Collectively, 2019 saw the African continent as a whole raise USD 12.4 bn through the various Eurobond issues as highlighted below:
|
Africa YTD 2019 Eurobond Issues |
||||||
|
|
Amount Issued (USD millions) |
coupon |
Issue date |
Maturity Date |
Tenor (Years) |
Subscription |
|
Ghana |
1,250.00 |
8.13% |
26/03/2019 |
26/03/2032 |
12 |
7.0X |
|
750 |
7.88% |
26/03/2019 |
26/03/2027 |
7 |
||
|
1,000.00 |
8.95% |
26/03/2019 |
26/03/2051 |
31 |
||
|
Egypt |
1,500.00 |
8.70% |
26/02/2019 |
01/03/2049 |
30 |
5.0X |
|
1,750.00 |
7.60% |
26/02/2019 |
01/03/2029 |
10 |
||
|
750 |
6.20% |
26/02/2019 |
01/03/2024 |
5 |
||
|
1,020.70 |
4.75% |
11/04/2019 |
11/04/2025 |
6 |
4.0X |
|
|
1,701.10 |
6.38% |
11/04/2019 |
11/04/2031 |
12 |
||
|
Kenya |
900 |
7.00% |
22/05/2019 |
22/05/2027 |
7 |
4.5X |
|
1,200 |
8.00% |
23/05/2019 |
23/05/2032 |
12 |
||
|
Benin |
567 |
5.75% |
26/03/2019 |
26/03/2026 |
6 |
2.3X |
|
Total |
12,388.80 |
|
|
|||
The Eurobond issues in 2019 attracted a lot of interest evidenced by the oversubscription rates, with the Ghana issue recording the highest oversubscription of over 7.0x, underlining the sustained investor confidence in the African debt market. This has partly arisen because, by comparison, African sovereign debt offers the highest yields globally. This coupled with the political uncertainties in the US, and the adoption of a looser monetary policy regime in both the Eurozone and the United States has led to a decline in yields in advanced economies. On the other hand, due to the investor interest in Africa’s debt market, the increased demand has pushed the prices up and consequently the yield down.
Equities Market Performance
A number of Sub-Saharan African (SSA) stock markets recorded negative returns in dollar terms as at the end of 2019 as the stock prices dipped at year end, attributable to profit-taking investors exiting the markets to realize the gains recorded in most emerging markets stocks. The gains had been driven by renewed demand for riskier assets as trade tensions between the United States and China eased and uncertainty around Brexit declined. The price correction due to the capital outflows coupled with the depreciating currencies resulted in most exchanges registering a decline in performance. The Nairobi Stock Exchange was among the biggest gainers driven by a price rally in large-cap stocks in the banking sector following the repeal of the interest rate cap, which saw improved investor sentiment in the sector with expectations of improved profitability. Below is a summary of the performance of key bourses in SSA:
|
Equities Market Performance (Dollarized*) |
|||||
|
Country |
Dec-17 |
Dec-18 |
Dec-19 |
2018 y/y change (%) |
2019 y/y change (%) |
|
Kenya |
1.7 |
1.4 |
1.6 |
(16.9%) |
18.8% |
|
South Africa |
4815.3 |
3675.7 |
4079.3 |
(23.7%) |
11.0% |
|
Uganda |
0.5 |
0.5 |
0.5 |
(16.7%) |
8.9% |
|
Tanzania |
1.8 |
1.6 |
1.5 |
(8.3%) |
(7.0%) |
|
Nigeria |
124.8 |
102.4 |
87.7 |
(18.0%) |
(14.3%) |
|
Ghana |
570.4 |
518.5 |
405.5 |
(9.1%) |
(21.8%) |
|
Zambia |
533.3 |
440.7 |
303.3 |
(17.4%) |
(31.2%) |
|
*The index values are dollarized for ease of comparison |
|||||
Growth in the Sub-Saharan Africa region is expected to remain stable supported by increased public spending on infrastructural development owing to the high demand for basic needs. Key risks remain difficult business conditions and poor infrastructure, reliance on commodity exports, political tension in some countries and debt sustainability due to high levels of public debt in most economies in the region. Stock markets valuations remain attractive for long-term investors. The improved regional economic growth prospects remain key towards enhancing investor sentiment and attracting investment inflows into the region.
Economic Growth:
The country's Gross Domestic Product (GDP), adjusted for inflation, was subdued in 2019 having expanded by 5.6%, 5.6% and 5.1% in Q1’2019, Q2’2019, and Q3’2019, respectively, to record an average growth of 5.4% compared to 5.7%, 6.3%, and 6.0% in Q1’2018, Q2’2018 and Q3’2018, respectively, and averaging at 6.0%. The slower growth was as a result of:
- A slowdown in agricultural activities, which saw the sector record an average growth of 4.2% for the first 3 quarters of 2019, representing a 1.1% point decline from the 5.3% recorded in the same period of review in 2018. The slowdown in agriculture was as a result of delayed long rains, which curtailed agricultural production. In terms of sectoral contribution, agriculture remained the highest contributor averaging 22.6% over the same period, and,
- Decreased output in transport and electricity activities, which grew on average by 7.0% and 5.5%, respectively in the first 3 quarters of 2019, compared to the 8.6% and 7.6%, recorded in the same period of review in 2018. The electricity sector was subdued by insufficient long rains in the first and second quarters, while the transport sector was subdued by the rise in prices of fuel.
Analysis by sector showed that there was accelerated growth in the manufacturing sector, though its contribution to GDP recorded a 0.3% points decline to average 9.7% in the first three quarters of 2019 as compared to the 10.0% recorded in 2018. This has continued to raise concerns given that the Kenyan Government has singled it out as one of the key pillars to drive the economy in the Big 4 Agenda. The sector’s contribution is still way below the government’s target of increasing it to 15.0% of GDP by 2022, which in effect is expected to increase manufacturing sector jobs by more than 800,000 per annum over the next four years. For more information, see our Q3’2019 GDP Note.
Below is a table showing average projected GDP growth for Kenya in 2019; noteworthy being that the highest projection is by PNB Paribas at 6.1%, this is after the Central bank revised its projections down to 5.9% from 6.3%, citing the economy is not growing within its potential.
|
Kenya 2019 Annual GDP Growth Outlook |
|||||
|
No |
Organization |
Q1'2019 |
Q2'2019 |
Q3'2019 |
Q4'2019 |
|
1 |
PNB Paribas |
6.0% |
6.0% |
6.1% |
6.1% |
|
2 |
African Development Bank (AfDB) |
6.0% |
6.0% |
6.0% |
6.0% |
|
3 |
UK HSBC |
6.0% |
6.0% |
6.0% |
6.0% |
|
4 |
Central Bank of Kenya |
6.3% |
6.3% |
6.3% |
5.9% |
|
5 |
Citigroup Global Markets |
6.1% |
6.1% |
6.1% |
5.8% |
|
6 |
World Bank |
5.8% |
5.7% |
5.7% |
5.7% |
|
7 |
Euler Hermes |
5.7% |
5.7% |
5.7% |
5.7% |
|
8 |
Euro Monitor International |
5.9% |
5.9% |
6.3% |
5.6% |
|
9 |
International Monetary Fund (IMF) |
6.1% |
5.8% |
5.9% |
5.6% |
|
10 |
Focus Economics |
5.8% |
5.8% |
5.6% |
5.6% |
|
11 |
JP Morgan |
5.7% |
5.7% |
5.6% |
5.6% |
|
12 |
Oxford Economics |
5.6% |
5.6% |
5.6% |
5.6% |
|
13 |
Cytonn Investments Management Plc |
5.8% |
5.8% |
5.8% |
5.6% |
|
|
Average |
5.9% |
5.9% |
5.9% |
5.8% |
Kenya Shilling:
The Kenya Shilling gained by 0.5% against the US Dollar to close at 101.3 in 2019, compared to 101.8 at the end of 2018.
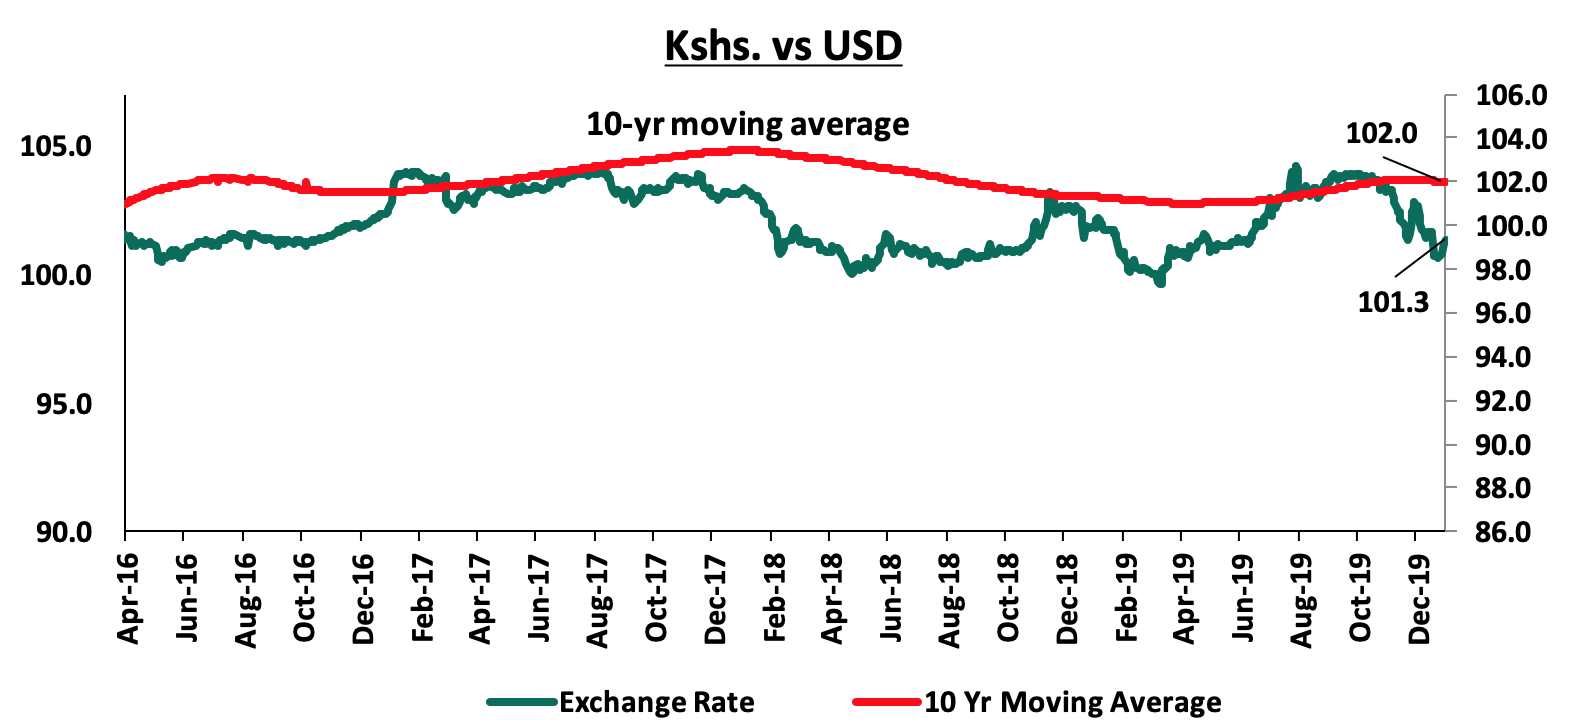
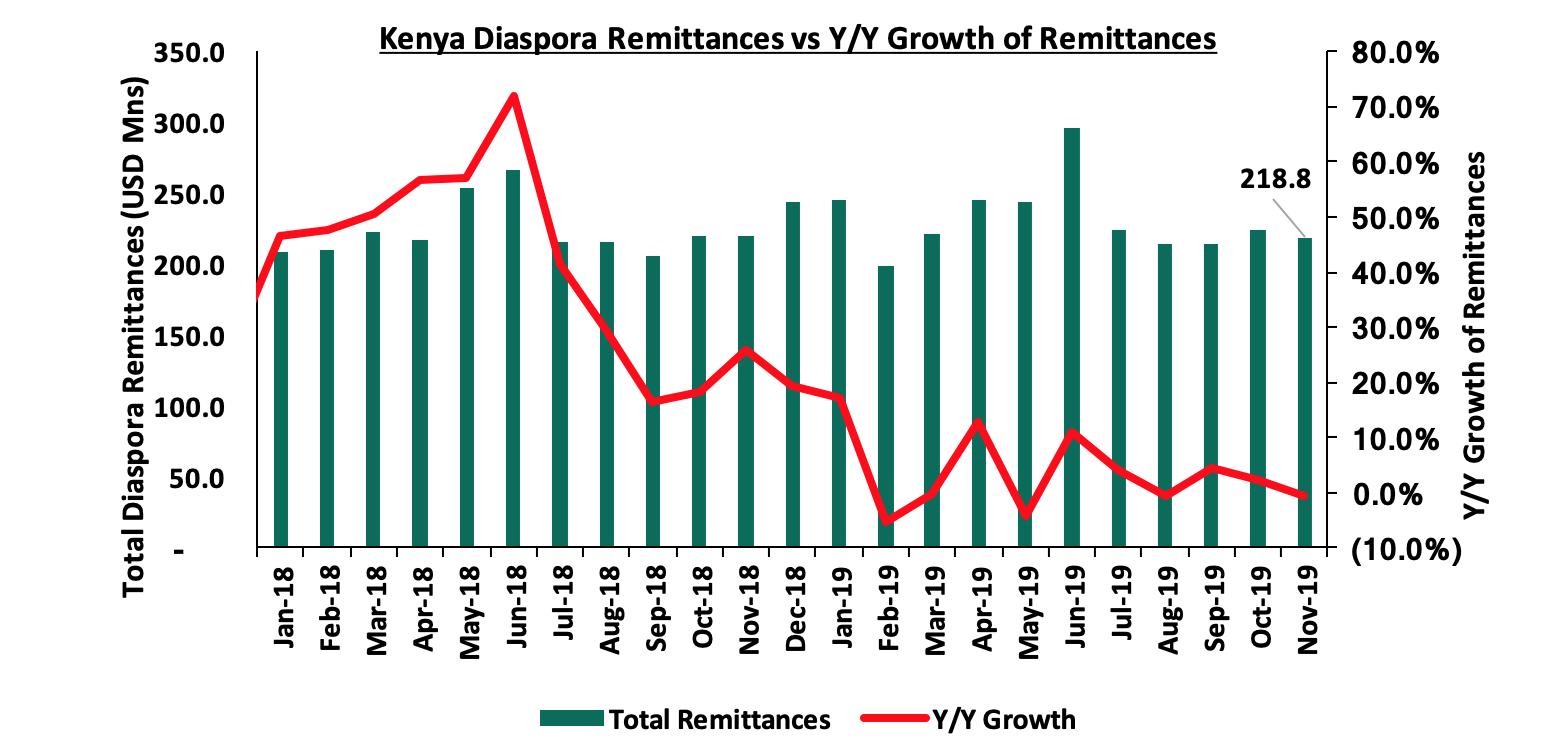
The shilling was supported by inflows of hard currency from remittances by Kenyan workers abroad and offshore investors. In our view, the shilling should remain relatively stable to the dollar in the short term, supported by:
- The narrowing of the current account deficit, with preliminary data indicating that Kenya’s current account deficit improved by 7.6% during Q3’2019, coming in at a deficit of Kshs 101.0 bn, from Kshs 109.3 bn in Q3’2018, equivalent to 8.2% of GDP, from 9.3% recorded in Q3’2018. This was mainly driven by the narrowing of the country’s merchandise trade deficit balance (a scenario where imports are greater than exports) by 6.7% and a rise in secondary income transfers (transfers recorded in the balance of payments whenever an economy provides or receives goods, services, income or financial items) by 4.3%. For more information see our Q3’2019 BOP Note,
- Improving diaspora remittances, which stood at 218.8 mn in November 2019 and cumulatively increased by 5.0% in the 12-months to November 2019 to USD 2.8 bn, from USD 2.7 bn recorded in a similar period of review in 2018,
- Foreign capital inflows, with investors looking to participate in the equities market to take advantage of the cheap valuations in the market,
- CBK’s supportive activities in the money market, such as repurchase agreements and selling of dollars, and,
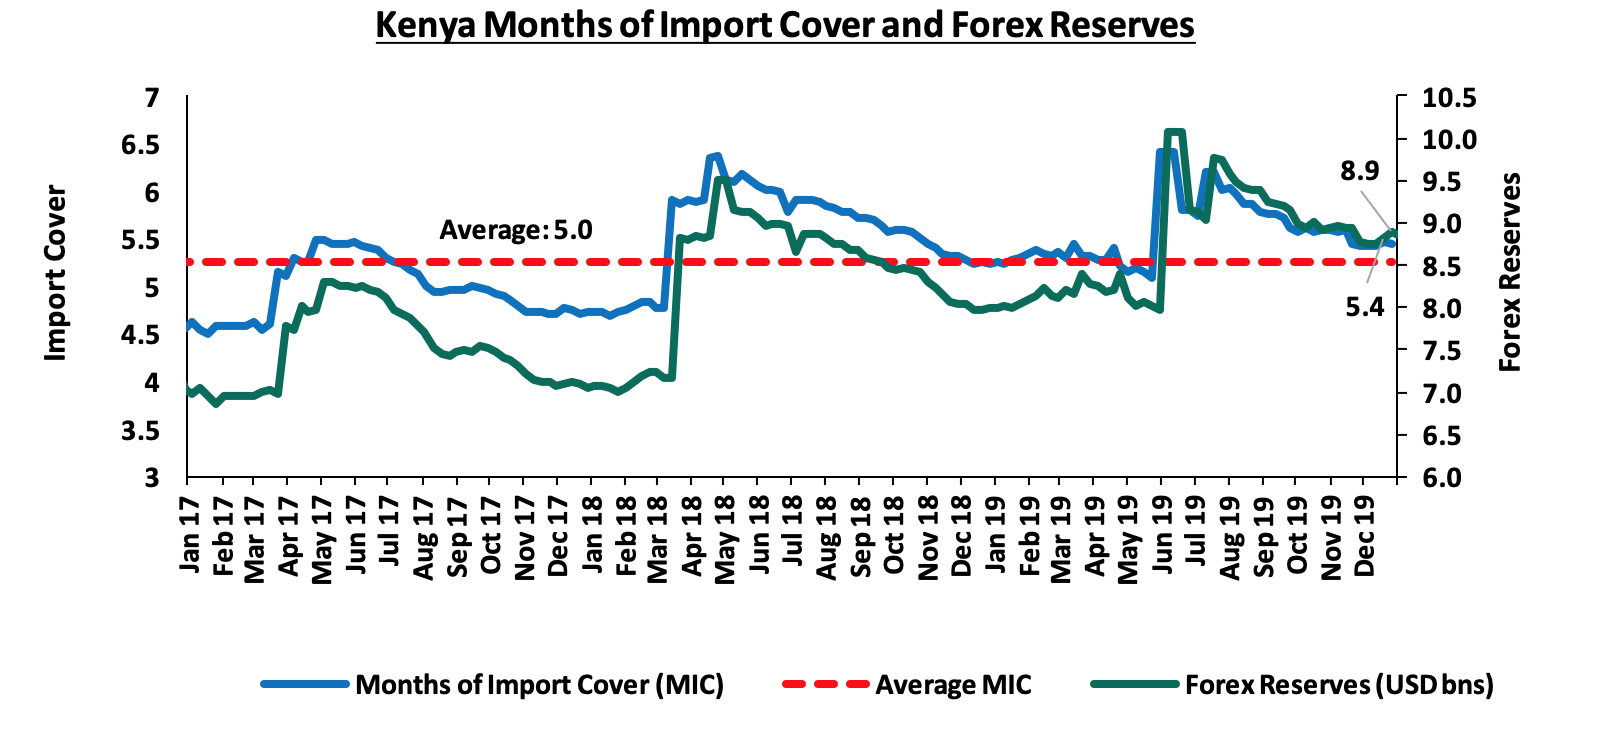
- High levels of forex reserves, currently at USD 8.8 bn (equivalent to 5.4-months of import cover), above the statutory requirement of maintaining at least 4.0-months of import cover, and the EAC region’s convergence criteria of 4.5-months of import cover.
Inflation:
The inflation rate for the month of December 2019 rose to 5.8%, from 5.6% recorded in November, which exceeded our projections of 4.8% - 5.2%, bringing the 2019 average to 5.2%, compared to the 2018 average of 4.7%. Month-on-month inflation increased by 0.9%, which was attributable to;
- A 1.5% increase in the food and non-alcoholic drinks’ index, due to rise in prices of some foodstuffs outweighing decrease recorded in others. High increases of vegetables was recorded despite the ongoing heavy rains with kales, tomatoes, spinach, and onions increasing by 5.6%, 7.8%, 9.1% and 5.1%, respectively,
- A marginal increase of 0.01% in the housing, water, electricity, gas and other fuels index, attributed to higher prices of charcoal, and,
- A 2.1% increase in the transport index on account of the increase in
public transport fares outweighing the decrease in pump prices of diesel and petrol.
Going forward, overall inflation is expected to remain within the target range (of 2.5% - 7.5%) in the near term, mainly due to expected lower food prices as a result of favorable weather conditions.
Monetary Policy:
During the year the Monetary Policy Committee met 6 times. They lowered the Central Bank Rate (CBR) once, in the meeting held on 25th November 2019, citing that inflation expectations remained well anchored within the target range and that the economy was operating below its potential level and as such, the MPC concluded that due to the tightening of fiscal policy, there was room for accommodative monetary policy to support economic activity. During their meeting in November 2019, the MPC lowered the CBR by 50 bps to 8.5%, from the earlier 9.0% that had been set in July 2018. The MPC also welcomed the repeal of the interest rate caps on commercial bank loans, noting that they had led to significant rationing of credit. It noted that this reform would restore clarity of monetary policy decisions and strengthen the transmission of policies by allowing the Central Bank of Kenya (CBK) adjust the monetary policy rates in response to economic developments such as changes in inflation and GDP growth.
Through its assessment of the impact of the interest rate cap in the rate cap era, the Monetary Policy Committee had noted that the implementation of the interest rate cap had weakened the transmission of monetary policy and thus had made it difficult for the CBK to adjust the monetary policy rates in response to economic developments. Expansionary monetary policy was difficult to implement since lowering the CBR had the effect of lowering the lending rates and as a consequence, banks found it even more difficult to price for risk at the lower interest rates, leading to pricing out of more risky borrowers, and hence further reducing access to credit. On the other hand, if the CBK was to employ a contractionary monetary policy, so as to reduce inflation and credit growth for example, then raising the CBR would have the reverse effect of increasing the supply of credit in the economy since banks would be able to admit riskier borrowers.
2019 Key Highlights:
- The Kenyan President signed the Finance Bill 2019 into law, scrapping the law capping interest rates at 4.0% above the Central Bank Rate (CBR). Interest rate caps were introduced in Kenya in September 2016 with the enactment of the Banking (Amendment) Act, 2015, due to the high cost of borrowing that saw banks charge interest rates as high as 21.0% for loans, yet depositors earned approximately 5.0% for their deposits. For a more comprehensive analysis and more information see our Market Post Interest Rate Cap Analysis and Cytonn Weekly #45/2019,
- The National Treasury released the 2019/2020 fiscal year (FY) budgeton 13th June 2019. According to the budget summary, total revenue collected is expected to increase by 14.2% to Kshs 2.1 tn from the Kshs 1.9 tn as per the revised FY’2018/2019 revised Budget, mainly driven by a 12.2% rise in ordinary revenue to Kshs 1.9 tn, from an estimated Kshs 1.7 tn in the revised FY’2018/2019 budget. Total expenditure is set to increase by 10.1% to Kshs 2.8 tn from Kshs 2.5 tn as per the revised FY’2018/19 Budget. The fiscal deficit is projected at Kshs 607.8 bn (5.6% GDP), which will be financed through Kshs 324.3 bn in terms of external financing, domestic borrowing of Kshs 289.2 bn and other domestic receipts worth Kshs 5.7 bn. For more information see Cytonn Weekly #24/2019 and our FY 2019/20 Pre-Budget Discussion Note,
- The National Treasury released the budgetary review for the 2018/2019 financial year indicating that revenues collected had increased by 9.2% to Kshs 1.7 tn from Kshs 1.5 tn collected during the 2017/2018 financial year. The revenue collected was 93.1% of the budgetary target for the year as compared to the previous period where revenue collected was 91.7% of the budgetary target. Total expenditure amounted to Kshs 2.4 tn, a 12.1% increase from Kshs 2.1 tn recorded during the same period last year. This was 94.7% of the Kshs 2.5 tn target, with 62.2% of the expenditure being on recurrent expenditure, while development expenditure only accounted for 22.5%. Total expenditure was, however, 6.3% lower than the targeted expenditure as per the budget. The key concern, however, remains the widening of the fiscal deficit where the expenditure side has continued to grow faster recording a 12.1% growth, compared to the 9.2% growth in revenue collection. For more information see our Cytonn Weekly #34/2019,
- President Uhuru Kenyatta signed the Supplementary Appropriation Bill (No. 2) of 2019 into law, paving way for the release of Kshs 73.2 bn from the government’s consolidated fund. The new funding is expected to impact Ministerial and State departments budgets as the government agencies register varying adjustments in allocations. However, only Kshs 54.3 bn of the Kshs 73.4 bn will be spent after the National Assembly Budget and Appropriations Committee (BAC) approved cuts amounting to Kshs 18.9 bn. For more information see our Cytonn Weekly #49/2019,
- Kenya issued its 3rdEurobond, raising USD 2.1 bn (Kshs 210.0 bn) through a dual-tranche Eurobond of 7-year and 12-year tenors, value dated 15th May 2019. A longer-term issuance would have been more preferable, though it comes at a trade-off on the yields as investors would demand a higher risk premium to compensate for the risk in tandem with the repayment period of the loan. The Eurobond was listed on the London Stock Exchange (LSE). The issue was 4.5x oversubscribed attracting orders worth USD 9.5 bn. The Eurobond was priced at 7.0% for the 7-year tenor and 8.0% for the 12-year tenor. For more information, see our Cytonn Weekly #20/2019,
- The World Bank released the Doing Business 2020 Report, which investigates the regulations that enhance business activity in a country and those that constrain it. Of the 190 countries, Kenya’s ranking improved by 4 positions to #56 in the 2020 report with a score of 73.2, from #61 in the 2019 report. In Africa, Kenya’s ranking declined 1 position to #4, from #3 compared to the previous period. For a more comprehensive analysis, see our Ease of Doing Business 2020 Summary Note,
- Fitch Ratings, an American credit rating agency, affirmed through a press release that Kenya’s Long-Term Foreign-Currency Issuer Default Rating was at B+ with a stable outlook. This rating is informed by the country’s high levels of debt, both domestic and external, against a strong and stable growth outlook. For more information see Cytonn Weekly #50/2019.
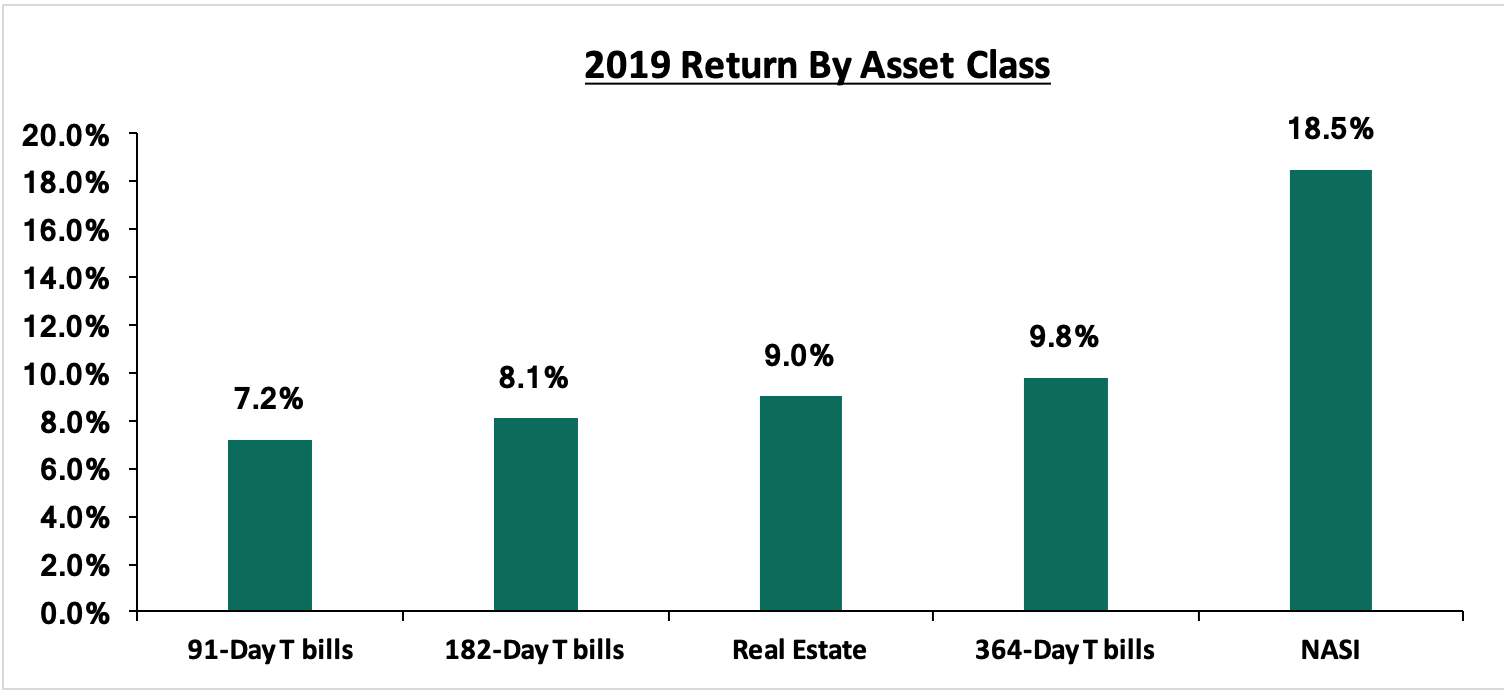
The graph below shows the summary of returns by asset class in 2019 (T- Bonds, T-Bills and Equities). The best performing asset in 2019 was NASI with returns of 18.5% followed by the 364-day Government paper with yields of 9.8%. Real estate recorded returns of 9.0% and the 182-day and 91-day Government papers recorded yields of 8.1% and 7.2%, respectively.
The table below shows the macro-economic indicators that we track, indicating our expectations for each variable at the beginning of 2019 versus the actual experience:
|
Macroeconomic Indicators 2019 Review |
||||
|
Macro-Economic Indicators |
2019 Expectations at Beginning of Year |
Outlook - Beginning of Year |
2019 Experience |
Effect |
|
Government Borrowing |
We expected the government to come under pressure to borrow as it was well behind both domestic and foreign borrowing targets for FY 2018/19, and with the expectations of KRA not achieving the revenue targets and the government having a net external financing target of Kshs 272.0 bn to finance the budget deficit, coupled with the need to retire 3 commercial loans maturing in H1’2019 |
Negative |
During the year the government issued Eurobonds to retire the commercial loans that were maturing. The Government also substituted the debt ceiling that was previously pegged at 50.0% of GDP to an absolute figure of Kshs 9.0 tn, indicating the growing appetite of the government for taking on additional debt. The Government also raised its total revenue target by 14.2% to Kshs 2.1 tn for FY’2019/20 which we doubt it will meet, thus exerting slight pressure on the domestic borrowing front to plug in the deficit. The repeal of the interest rate cap has also made it difficult for the government to access domestic debt. |
Negative |
|
Exchange Rate |
Currency was projected to range between Kshs 101.0 and Kshs 104.0 against the USD in 2019, with CBK to continue supporting the Shilling in the short term through its sufficient reserves of USD 8.0 bn (equivalent to 5.2-months of import cover) |
Neutral |
The Kenya Shilling gained 0.5% against the US Dollar to close at 101.3 in 2019 compared to 101.8 at the end of 2018, and ranging between 100.0 and 103.4. |
Positive |
|
Interest Rates |
We expected slight upward pressure on interest rates, especially in H1’2019, as the government falls behind its domestic borrowing targets for the fiscal year coupled with heavy domestic maturities |
Neutral |
The Monetary Policy Committee lowered the Central Bank Rate (CBR) once by 50 bps to 8.5% from 9.0%, in the 6 meetings held in 2019, citing that inflation expectations remained well anchored within the target range and that the economy was operating below its potential level. During their meeting in November 2019, the MPC lowered the CBR by 50 bps to 8.5% from the earlier 9.0% that had been set in July 2018
|
Neutral |
|
Inflation |
Inflation was expected to average 4.5%, within the government target range of 2.5%- 7.5%, compared to 7.0% last year |
Positive |
The inflation rate for the month of December 2019 rose to 5.8% from 5.6% recorded in November bringing the 2019 average to 5.2% (in line with the government’s target of 2.5% to 7.5%) compared to the 2018 average of 4.7%. |
Positive |
|
GDP |
GDP growth was projected to come in at between 5.7% - 5.9% lower than the expected growth rate of 6.0% in 2018, but higher than the 5-year historical average of 5.4% |
Positive |
Kenya’s economy expanded in 2019 by 5.6% in Q1’2019, 5.2% in Q2’2019 and 5.1% in Q3’2019 to record an average growth of 5.4% for the 3 quarters compared to an average growth of 6.0% over the same period in 2018 |
Positive |
|
Investor Sentiment |
Investor sentiment in 2019 to register improved foreign participation, mainly supported by long term investors who enter the market looking to take advantage of the current low/cheap valuations in select sections of the market |
Neutral |
The Government managed to raise USD 2.1 bn in Eurobonds, in an issue that was oversubscribed by 4.5 times. Foreign investors turned net buyers during the year with a net inflow of USD 18.5 mn compared to net outflows of USD 425.6 mn recorded in 2018 |
Positive |
|
Security |
We expected security to be maintained in 2019, especially given that the political climate in the country has eased, with security maintained and business picking up |
Positive |
The political climate in the country eased during the year. Despite the terror attack experienced during the first half of 2019, Kenya was spared from travel advisories, evidence of the international community’s confidence in the country’s security position |
Positive |
Out of the seven metrics that we track, five had a positive effect while one had a neutral effect and one had a negative effect, compared to the beginning of the year where three had a positive outlook, three had a neutral look and one had a negative outlook. In conclusion, macroeconomic fundamentals remained positive during the year because of an improved business environment created through political goodwill and improved security in the country.
T-Bills & T-Bonds Primary Auction:
During the year 2019, T-bills auction recorded an oversubscription with the average subscription rate coming in at 118.7% compared to an average of 123.2% in 2018. The yields on the 91-day, 182-day and 364-day T-bills declined by 10 bps, 80 bps and 20 bps to close at 7.2%, 8.2% and 9.8% in 2019 from 7.3%, 9.0% and 10.0% at the end of 2018, respectively. This is mainly attributed to the Central Bank of Kenya’s (CBK’s) efforts to keep rates low by rejecting expensive bids in the auction market. Following the enactment of the Banking (Amendment) Act, 2015, banks had preferred to lend to the less risky government as opposed to the riskier private sector. The repeal of the rate cap during the third quarter of the year however reduced participation of banks in the primary auction market down from an average of 125.4%, from January 2019 to November 7th 2019 before the repeal of the rate cap, to 48.4% for the post interest rate period between November 7th 2019 and 31st December 2019.
Primary T-bond auctions in 2019 were oversubscribed with the subscription rate averaging 109.7%, which is higher than the average subscription rate for 2018, which came in at 75.8%. The market maintained a bias towards the medium-term bonds mainly driven by the perception that risks may not be adequately priced on the longer end of the yield curve, which is relatively flat due to saturation of long-term bonds coupled with duration risk. The average acceptance rate for 2019 came in at 69.2%, as the market adjusted to the efforts of the CBK to maintain the rates at low levels.
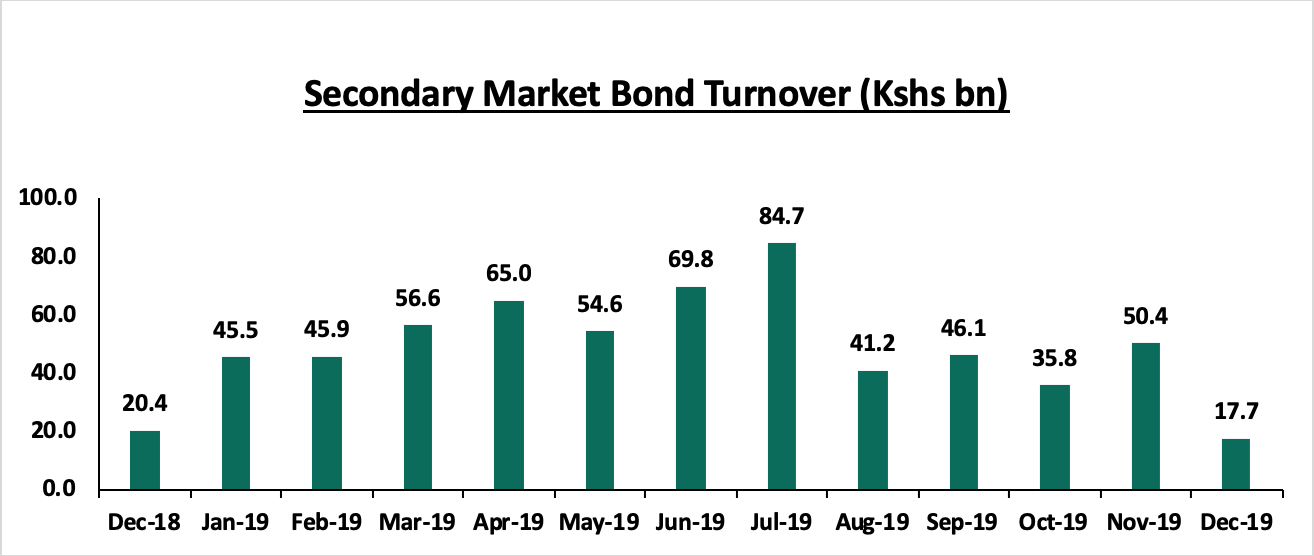
Secondary Bond Market Activity:
The secondary bond market recorded increased activity with the turnover having increased by 16.1% to Kshs 613.2 bn from Kshs 528.2 bn in 2018, as the local institutional investors increased their allocation to treasury bonds while the equity market turnover declined by 12.9%.
The graph below shows the evolution of the yield curve during the year. The yield curve experienced downward pressure for the better part of the year as the Kenyan Government contained rates by rejecting expensive bids in the auction market. The repeal of the rate cap, however, led to the gain of some long-term government securities such as the 20 and 23-year papers, which gained by 0.8% points and 1.4% points in 2019.
Liquidity:
During the year, liquidity levels remained stable and well distributed in the market as indicated by the decline in the average interbank rate to 4.3% in 2019 from 5.2% in 2018, coupled with the 28.6% decline in the average volumes traded in the interbank market to Kshs 11.5 bn in 2019 from Kshs 16.1bn recorded in 2018. The improvement in liquidity was mainly driven by government payments and net redemptions of government securities which came in at Kshs 0.7 bn for the period between July 2019 and December 2019.
Kenya Eurobonds:
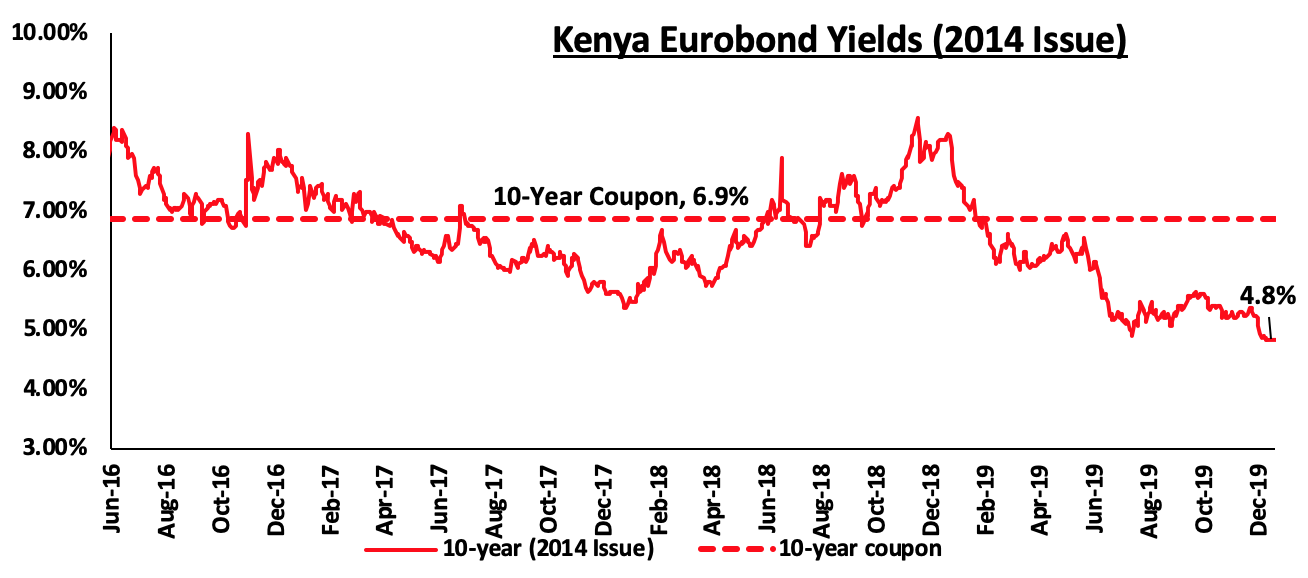
The yields on the 10-Year Eurobond issued in 2014 decreased by 3.5% points to 4.8%, from 8.3% recorded at the end of 2018. The decline in the Eurobond yield is an indication that investors are attaching lower risk premium on the country, attributed to the release of the country’s credit rating by Fitch Ratings, which was “B+”, highlighting the country’s stable outlook.
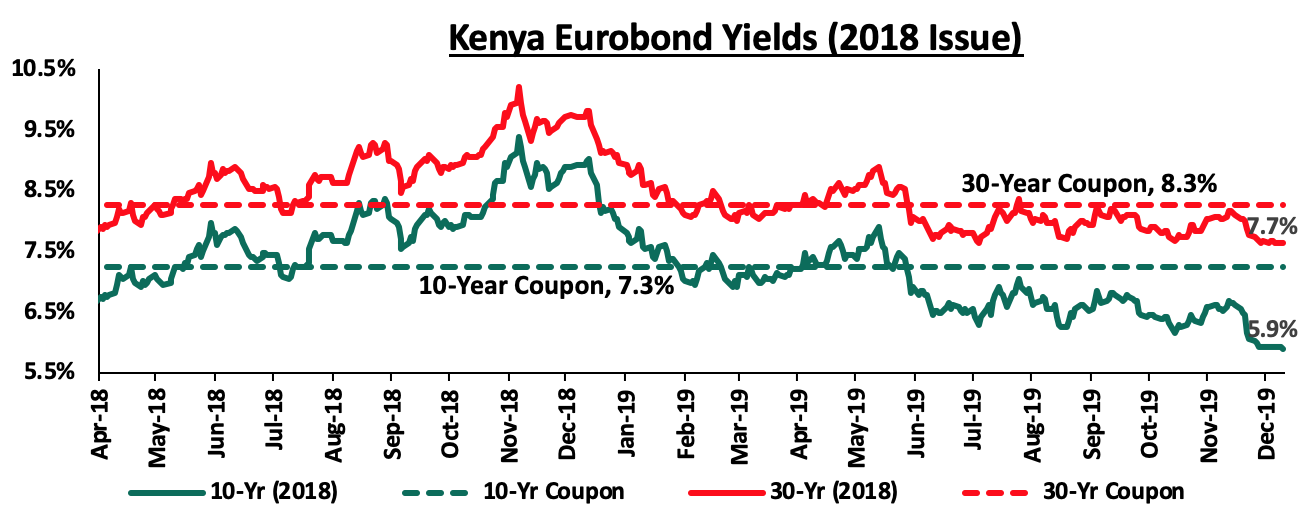
For the February 2018 Eurobond issue, the yields on the 10-year Eurobond and the 30-year Eurobond declined by 3.1% points and 2.1% points to close the year at 5.9% and 7.7% from a yield of 9.0% and 9.8% at the close of 2018, respectively.
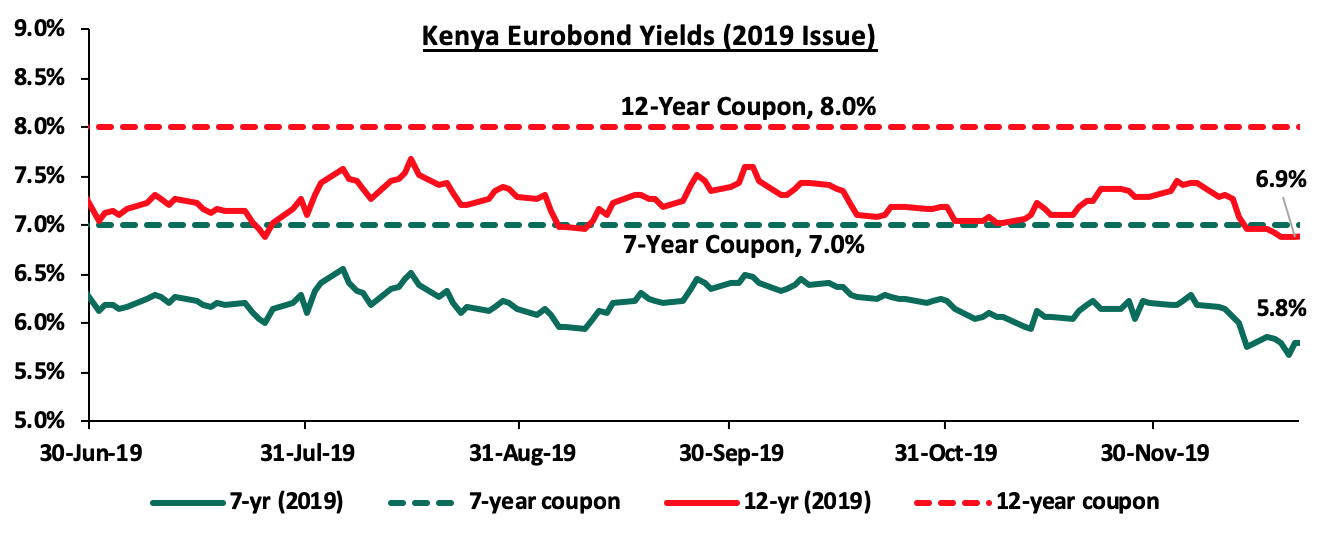
During the year, Kenya issued its 3rd Eurobond, raising USD 2.1 bn (Kshs 210.0 bn) through a dual-tranche Eurobond of 7-year and 12-year tenors, value dated 15th May 2019. The issue was 4.5x oversubscribed attracting orders worth USD 9.5 bn. The yields on the latest issued dual-tranche Eurobond, with 7-years and 12-years tenor, declined by 1.2% points and 1.1% points to close the year at 5.8% and 6.9% from a yield of 7.0% and 8.0% when they were issued in Q3’2019, respectively.
Rates in the fixed income market have remained relatively stable as the government rejects expensive bids. The government is 3.2% behind its domestic borrowing target, having borrowed Kshs 156.6 bn against a pro-rated target of Kshs 161.7 bn. We expect an improvement in private sector credit growth considering the repeal of the interest rate cap. This will result in increased competition for bank funds from both the private and public sectors, resulting in upward pressure on interest rates. Owing to this, our view is that investors should be biased towards short-term fixed-income securities to reduce duration risk.
Market Performance
During the year, the Kenyan equities market recorded mixed performance, with NASI and NSE 25 gaining by 18.5% and 15.5%, respectively, while NSE 20 declined by 6.3%. Large cap gainers during the year included Equity Group, KCB Group, Safaricom, NCBA, Barclays, Co-operative Bank and EABL which gained by 53.5%, 44.2%, 41.9%, 32.6%, 21.9%, 14.3% and 13.6%, respectively, while the largest losers were Bamburi, BAT and, DTB which lost (39.6%), (31.0%), and (30.4%) during the year, respectively. Safaricom continues to be a key part of Kenyan equities portfolios, accounting for 50.9% of Nairobi Stock Exchange (NSE’s) market capitalization, and has dominated on both the market turnover and in determining the direction of the market given its weight and liquidity in the Nairobi Securities Exchange.
Equity turnover during the year declined by 12.9% to USD 1.5 bn, from USD 1.7 bn in FY’2018. Foreign investors turned net buyers, with a net inflow of USD 18.5 mn, compared to net outflows of USD 425.6 mn recorded in FY’2018. The foreign investor inflows during the year can be attributed mainly to the improved financial performance of listed commercial banks in the country, coupled with the repeal of the rate cap law in the last quarter of the year, which led to increased foreign activity in the local bourse.
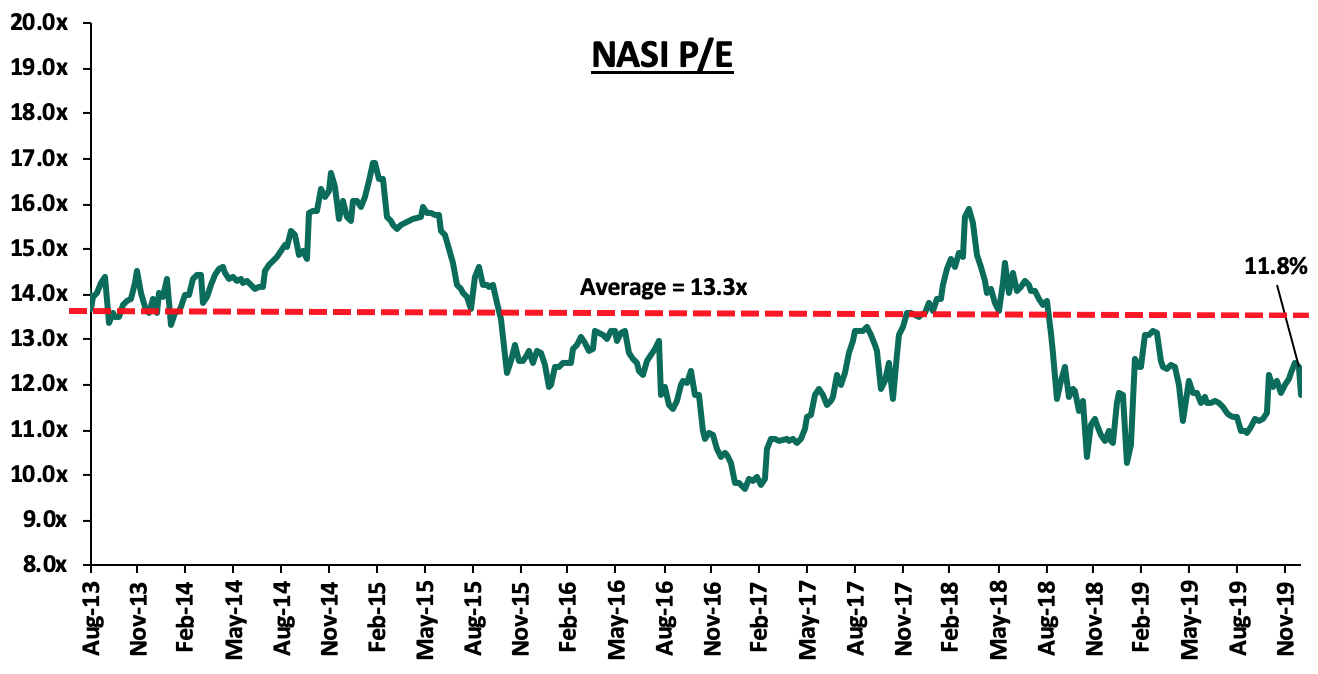
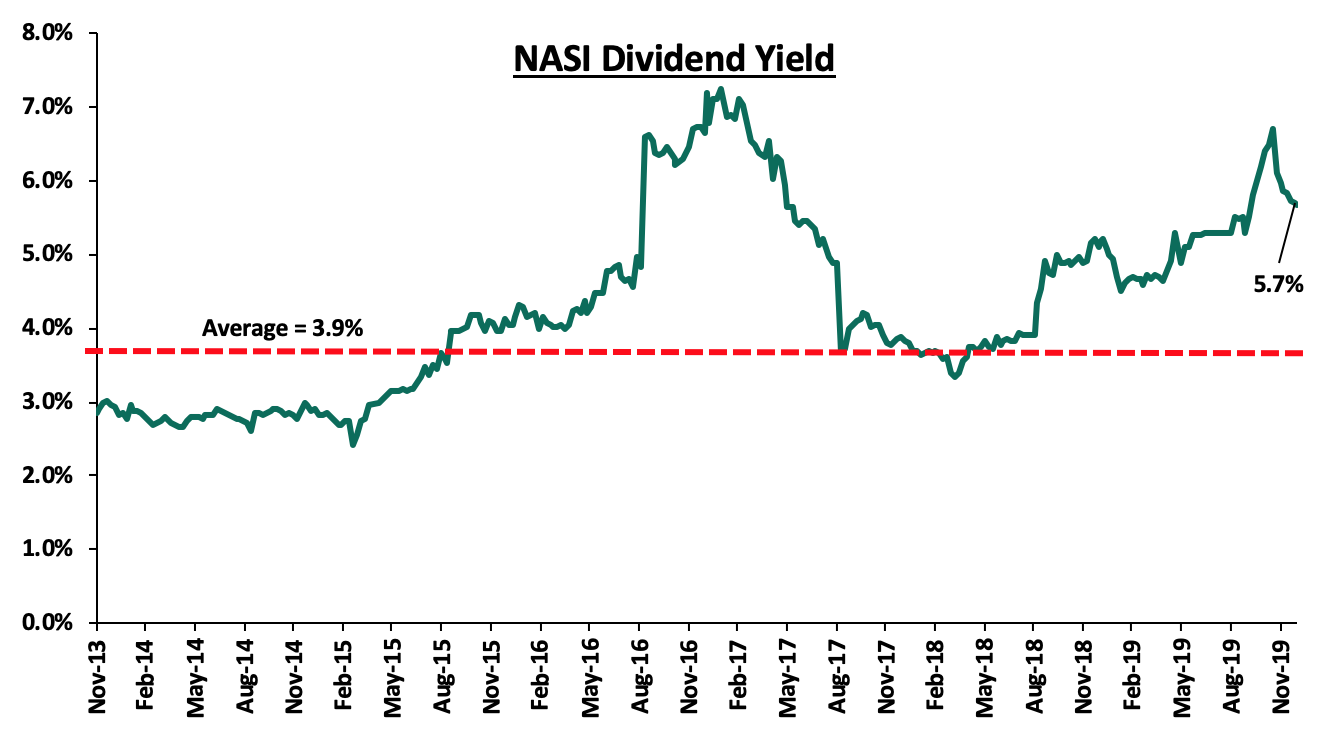
The market is currently trading at a price to earnings ratio (P/E) of 11.8x, 11.2% below the historical average of 13.3x, and a dividend yield of 5.7%, 1.8% points above the historical average of 3.9%. The current P/E valuation of 11.8x is 21.3% above the most recent trough valuation of 9.7x experienced in the first week of February 2017, and 41.6% above the previous trough valuation of 8.3x experienced in December 2011. The charts below indicate the historical P/E and dividend yields of the market.
Banking Sector Earnings
During the year, Kenyan listed banks released their Q3’2019 results recording an average increase in core earnings per share of 8.7%, slower compared to an average growth of 16.2% in Q3’2018. The table below highlights the performance of the banking sector using several metrics, and the key take-outs of the performance;
|
Bank |
Core EPS Growth |
Interest Income Growth |
Interest Expense Growth |
Net Interest Income Growth |
Net Interest Margin |
Non-Funded Income Growth |
NFI to Total Operating Income |
Growth in Total Fees & Commissions |
Deposit Growth |
Growth in Government Securities |
Loan to Deposit Ratio |
Loan Growth |
Return on Average Equity |
|
HF Group |
74.5% |
(11.9%) |
(16.6%) |
(4.3%) |
4.5% |
78.9% |
38.4% |
129.3% |
(0.1%) |
(7.0%) |
113.3% |
(13.7%) |
(3.3%) |
|
BBK |
19.0% |
5.6% |
17.1% |
2.0% |
8.5% |
8.1% |
32.1% |
30.9% |
6.9% |
3.0% |
82.5% |
8.8% |
17.4% |
|
NCBA |
16.3% |
2.7% |
(3.7%) |
8.8% |
5.3% |
23.3% |
47.2% |
21.7% |
10.7% |
7.4% |
66.8% |
8.2% |
14.9% |
|
I&M Holdings |
13.4% |
7.2% |
12.9% |
2.9% |
6.0% |
14.0% |
37.5% |
5.1% |
13.0% |
(0.7%) |
73.7% |
6.6% |
17.2% |
|
Equity Group |
10.4% |
11.2% |
16.8% |
9.5% |
8.4% |
13.7% |
41.1% |
15.0% |
18.9% |
7.8% |
73.0% |
21.0% |
21.7% |
|
DTBK |
7.5% |
(7.3%) |
(7.0%) |
(7.5%) |
5.6% |
5.7% |
22.3% |
(2.5%) |
0.3% |
(1.2%) |
67.8% |
(2.9%) |
14.6% |
|
KCB Group |
6.2% |
4.6% |
(0.8%) |
6.5% |
8.2% |
16.9% |
35.2% |
28.5% |
11.4% |
7.5% |
82.9% |
11.7% |
22.2% |
|
Co-operative Bank |
5.5% |
(1.6%) |
0.9% |
(2.7%) |
8.3% |
33.3% |
40.0% |
46.6% |
8.9% |
13.6% |
83.4% |
5.8% |
18.4% |
|
SCBK |
(1.3%) |
(6.3%) |
(23.7%) |
0.6% |
7.5% |
(1.1%) |
32.2% |
7.0% |
2.4% |
(7.9%) |
52.7% |
6.8% |
16.9% |
|
Stanbic Bank |
N/A |
11.3% |
9.3% |
12.6% |
6.9% |
18.3% |
47.7% |
23.3% |
5.4% |
(33.2%) |
84.6% |
14.6% |
18.5% |
|
Q3'2019 Mkt Weighted Average* |
8.7% |
4.5% |
4.3% |
4.9% |
7.7% |
15.8% |
37.9% |
22.6% |
11.0% |
3.3% |
75.7% |
11.6% |
19.3% |
|
Q3'2018 Mkt Weighted Average** |
16.2% |
6.1% |
12.5% |
3.8% |
8.0% |
5.9% |
34.5% |
0.6% |
7.4% |
17.8% |
75.3% |
4.2% |
18.8% |
|
*Market cap weighted as at 29/11/2019 |
|||||||||||||
|
**Market cap weighted as at 30/11/2018 |
|||||||||||||
Key highlights from the table above include:
- The banks recorded stronger deposit growth, which came in at 11.0%, faster than the 7.4% growth recorded in the sector in Q3’2018. Interest expenses increased at a slower pace of 4.3%, compared to 12.5% in Q3’2018, indicating the banks have been able to mobilize relatively cheaper deposits,
- Average loan growth came in at 11.6%, which was faster than the 4.2% recorded in the sector in Q3’2018, indicating that there was an improvement in credit extension by the banks. Government securities recorded a growth of 3.3% y/y, which was slower compared to loans, and a decline from the 17.8% recorded in the sector in Q3’2018. This highlights that banks are beginning to adjust their business models back to private sector lending as opposed to investing in government securities, as the yields on government securities declined during the quarter. Interest income increased by 4.5%, slower than the 6.1% growth recorded in the sector in Q3’2018. Consequently, the Net Interest Income (NII) grew by 4.9% compared to a growth of 3.8% in the sector in Q3’2018,
- The banks recorded a Net Interest Margin of 7.7%, 30 bps lower than the 8.0% recorded in the sector in Q3’2018. The decline was mainly due to a decline in yields recorded in interest earnings assets following the decline in government securities yields, coupled with the decline in yields on loans due to the 50-bps decline in the Central Bank Rate since the end of Q3’2018, and,
- Non-Funded Income grew by 15.8% y/y, faster than the 5.9% recorded in the sector in Q3’2018. The growth in NFI was boosted by the total fee and commission income which improved by 22.6%, compared to the 0.6% growth recorded in the sector Q3’2018, owing to the faster loan growth.
For a comprehensive analysis of the Kenya Listed Banks performance, see our Cytonn Q3'2019 Kenya Listed Commercial Banks Review.
Insurance Sector Earnings
During the year, Kenyan listed insurers released their H1’2019 results recording an average increase in core earnings per share of 3.2%, an improvement compared to an average decline of 0.6% in H1’2018. The table below highlights the performance of the listed insurance sector, showing the performance using several metrics, and the key take-outs of the performance;
|
Listed Insurance Companies H1'2019 Earnings and Growth Metrics |
||||||||
|
Insurance Company |
Core EPS Growth |
Net Premium Growth |
Claims Growth |
Loss Ratio |
Expense Ratio |
Combined Ratio |
ROaA |
ROaE |
|
Britam Holdings |
50.0% |
(0.4%) |
(12.1%) |
59.3% |
70.5% |
129.8% |
(1.4%) |
(6.1%) |
|
Liberty Holdings |
45.8% |
3.4% |
(0.5%) |
80.3% |
71.7% |
152.0% |
1.8% |
8.3% |
|
Jubilee Holdings |
(1.6%) |
7.7% |
(8.5%) |
94.1% |
31.4% |
125.5% |
3.5% |
14.4% |
|
Kenya Re |
(12.5%) |
16.6% |
48.8% |
67.3% |
41.0% |
108.3% |
2.4% |
3.7% |
|
CIC Group |
(95.2%) |
0.4% |
7.9% |
70.9% |
49.9% |
184.8% |
(0.9%) |
(3.8%) |
|
Sanlam Kenya* |
N/A |
10.8% |
(18.8%) |
72.1% |
63.4% |
135.5% |
0.6% |
9.9% |
|
H1'2019 Weighted Average** |
3.2% |
5.7% |
0.0% |
77.2% |
49.1% |
133.7% |
1.4% |
5.1% |
|
H1'2018 Weighted Average** |
(0.6%) |
(8.2%) |
(1.8%) |
84.2% |
60.2% |
144.4% |
0.9% |
3.9% |
|
*Sanlam's EPS cannot be calculated since it has registered losses in H1'2018 |
||||||||
|
**The weighted average is based on Market Cap as at 22nd October 2019 |
||||||||
The key take-outs from the above table include;
- The premiums grew by 5.7% in H1’2019, compared to a decline of 8.2% in H1’2018, while claims remained flat on a weighted average basis,
- The loss ratio across the sector decreased to 77.2% in H1’2019, from 84.2% in H1’2018, owing to the introduction of tough measures by market players to reduce fraudulent claims,
- The expense ratio decreased to 49.1% in H1’2019, from 60.2% in H1’2018, owing to a decrease in operating expenses through cost rationalization and awareness,
- The insurance core business still remains unprofitable, with a combined ratio of 133.7% as at H1’2019, compared to 144.4% in H1’2018, and,
- On average, the insurance sector has delivered a Return on Average Equity of 5.7%, an increase from 3.9% in H1’2018.
For a comprehensive analysis of the Kenya Listed Insurers performance, see our Kenya Listed Insurance Companies Analysis Cytonn H1'2019 report.
Other Key Results
Safaricom Limited released H1’2020 results, recording core earnings per share growth of 14.1% to Kshs 0.9 from Kshs 0.8 in H1’2019. The earnings growth was supported by a 5.3% growth in service revenue (M-PESA, messaging, voice, mobile data and fixed service) to Kshs 124.3 bn, from Kshs 118.1 bn recorded in H1’2019 due to increased usage of non-voice services, particularly M-PESA services, coupled with an 8.0% decline in operating costs to Kshs 23.8 bn, from Kshs 25.8 bn in H1’2019.
This year, 10 companies issued profit warnings to investors compared to 8 companies in 2018, attributable to the tough macro-economic environment in 2019. Companies are required to issue profit warnings if they project a more than 25% decline in profits year-on-year. They include Nairobi Stock Exchange (NSE), BOC Kenya, UAP Holdings Limited, KPLC, Eaagads, Williamson Tea, Standard Group, CIC Insurance, Kenya Airways, and Kapchorua Tea as shown in the table below;
|
Companies that issued profit warnings Comparison |
||
|
No |
2019 |
2018 |
|
1 |
Nairobi Stock Exchange |
Bamburi Cement |
|
2 |
BOC Kenya Plc |
Britam Holdings |
|
3 |
UAP Holdings Limited |
HF Group |
|
4 |
Kenya Power and Lightning Company |
Deacons East Africa Plc |
|
5 |
Eaagads |
Kenya Power and Lightning Company |
|
6 |
Williamson Tea Kenya |
Sanlam |
|
7 |
Standard Group Plc |
UAP-Old Mutual |
|
8 |
CIC Insurance |
Sameer Africa |
|
9 |
Kenya Airways |
|
|
10 |
Kapchorua Tea Company |
|
The key take-outs from the table above include;
- NSE attributed the shortfall in profits to a challenging economic environment and reduced inflow of capital from global frontier market investors,
- BOC Kenya issued a profit warning statement attributing dismal performance to depressed demand for gases from the industrial sector due to the prevailing economic environment coupled with high local energy costs amid soaring debts,
- UAP Holdings also issued a profit warning citing that the weakening performance of the property market in Kenya and the uncertain political environment in South Sudan will likely lead to further impairments in the carrying value of certain group investment properties,
- KPLC continues to face operating challenges stemming from an increase in non-fuel costs as the company implements its long-term strategy of growing cheaper and cleaner renewable energy to cut cost of energy to consumers,
- In Eaagads’ case, anticipated slide in earnings is attributed to the depressive global coffee prices, which have reduced significantly this year in the face of market oversupply coupled with a rise in coffee production costs, notably increased labour costs which have been on an upward trend year over year,
- Williamson Tea cited uneven and unpredictable weather patterns and the inability to control rising labour costs,
- Standard Group’s expected decline is attributable to increased newsprint costs during the year, coupled with reduced subscriptions for newspapers, with existing clients spending less due to subdued economic growth and limited access to credit. The media company further cited that increase in costs due to investments in new products whose revenues will be realized in subsequent years led to reduced profitability, amid regulatory changes the betting, gaming and alcoholic sectors that affected advertising income,
- CIC Insurance has witnessed a declining trend in profitability attributed to adverse claims in lines of key businesses. Further, the capping of interest rates in 2016 resulted in a ripple effect on business owing to the fact that lending to insurable investment projects and assets remained constrained. Also, diminishing disposable income on account of tough economic times has slowed down the uptake of insurance products,
- Kenya Airways attributes the expected decline in profits to competition in areas of operation, amid significant adjustments to both the profit and loss statements and balance sheets as the airline adopts new guidelines as provided by IFRS 16, and,
- Kapchorua Tea issued a profit warning statement this year citing uneven and unprecedented weather patterns coupled with rising labour costs, amid depressed prices for tea.
De-listings and Suspensions
During the year, we witnessed the Nairobi Securities Exchange (NSE) take actions towards the delisting, suspending and placing in receivership listed companies as highlighted below;
- In May 2019, the Nairobi Securities Exchange (NSE) delisted KenolKobil Plc from trading on the bourse following a takeover by Rubis Energie SAS, and,
- In April 2019, Atlas Development and Support Services was delisted from the NSE following the closing down of the company’s operations, the deregistration of the company in its country of incorporation under the Gurnesey laws and failure by the company to adhere to regulatory requirements from the year 2017 when the security of the company was suspended from trading on the NSE, and
- In September 2019, Mumias Sugar was suspended from trading on the securities exchange after the company was placed under receivership.
Legislations and other Developments
The year 2019 saw a number of legislative changes and other developments that affected the equities market and investor sentiment, namely:
- Repeal of the Interest Rate Cap (Banking (Amendment) Act, 2019): President Uhuru Kenyatta submitted a memorandum to the Speaker of the National Assembly detailing his refusal to assent to the Finance Bill 2019, and instead recommended a repeal of the interest rate cap. In the memorandum, the President cited that while the purpose of the capping was to address the wide concerns about affordability and availability of credit to Kenyans, the capping of interest rates instead caused unintended consequences that are significant and damaging to the economy and Micro, Small and Medium Enterprises (MSMEs). Thus, during the last parliamentary sitting on November 5th, the law capping interest rates was repealed.
Our view has always been that the interest rate cap regime would have an adverse effect on the economy and by extension to Kenyans, and as popular as the regulation was, it needed to be repealed as highlighted in our previous reports as outlined below:
-
- In our focus note Review of the Interest Rate Cap,dated 23rd June 2019, we revisited the interest rate cap topic following the proposal by the then, National Treasury Cabinet Secretary, Mr. Henry Rotich, in the Budget reading for the 2019/20 fiscal year, to repeal Section 33B of the Banking Act, which was included in the Finance Bill, 2019. In this focus, we discussed policy measures that can protect borrowers from excessive interest rates, including consumer education and protection measures, as well as promoting capital markets infrastructure to spur competition in the credit market through non-bank funding,
- In End of Interest Rate Caps?, dated 20thOctober 2019, we revisited the interest rate cap following the recommendation by President Uhuru Kenyatta to repeal the Interest Rate Cap, in a memorandum to Parliament in which he declined to assent the Finance Bill, 2019 into law, where we gave our views on how the economy would be impacted by the repeal of the cap. We highlighted that we expect to see a growth in private sector credit, higher GDP growth and increased monetary policy effectiveness, and
- In Market Post Interest Rate Cap, dated 15th December 2019, we revisited the interest rate cap following the repeal of the interest cap law by the Parliament where we reiterate that the decision to repeal the rate cap law will be a boost to the economy because a free market, where interest rates are set by the forces of demand and supply coupled with increased competition from non-bank financial institutions for funding, will see a competitive environment with increased access to credit by borrowers and higher economic growth prospects, given that monetary policy tools will be more effective in response to the changing conditions.
Going forward, we do not expect banks to reprice loans taken during the rate cap era. According to the Kenyan Bankers Association, most banks will not readjust their new pricing on commercial loans since banks have accepted their risk profile as an industry, with the cost of credit being at 13.0%, offered before the law was overhauled. However, we still recommend that we deal with two key outstanding issues of;
-
-
Consumer Protection against Abuse by Banks, since the removal of the cap may set stage for the return of expensive loans that had risen to more than 25.0% before the rate cap. The Banking Sector Charter, a commitment from banks to practice responsible and disciplined banking cognizant of customer needs, is a good but insufficient step. We need statutory consumer protection laws and a strong consumer protection agency,
-
Promoting Competing Alternative Funding Channels, which will further increase access to credit for borrowers who are unable to access formal loans from banks, due to the expected increase in banks’ loan books at the detriment of other loan providers post the rate cap era.
-
- Banking Sector Charter: The Banking Sector Charter, introduced by the Central Bank of Kenya in 2018, came into effect in March 2019 with an aim to instill discipline in the banking sector in order to make it responsive to the needs of the banked population. The charter is largely centered on consumer protection, by requiring banks to make full disclosure on the terms of the issuance of credit. In a bid to improve credit extension to Micro, Small and Medium Enterprises (MSMEs), the Banking Sector Charter prescribes that banks should have at least 20.0% of the loans extended to MSMEs. The Central Bank of Kenya requires strict compliance with the charter, as banks may be imposed with administrative sanctions should they fail to comply with the charter,
- Demonetization: In an effort to track illicit financial flows, the Central Bank of Kenya, on 31st May 2019, announced the introduction of new generation notes of denominations Kshs 1,000, Kshs 500, Kshs 200, Kshs 100 and Kshs 50. Further to this, they highlighted that the old Kshs 1,000 notes will cease to be a legal tender and will be withdrawn from the market by 1st October 2019. In some cases, this exercise has brought cash shortages in the market that prompts people to seek alternatives on digital platforms. Aside from tracking illegal financial flows, demonetization is expected to enhance financial inclusion of the informal sector, in addition to helping the country transition to a more cash-less economy. For more information on demonetization, kindly see our topical on the Effects of the Issuance of the New Generation Banknotes,
- Nairobi Securities Exchange Derivatives Market (NEXT): The Nairobi Securities Exchange (NSE) launched the Nairobi derivatives market on Thursday 4th July 2019 to facilitate the trading of futures contracts on the NSE 25 Share Index and a variety of stocks in the Kenyan market, regulated by the Capital Markets Authority (CMA). NEXT was established on account of;
- Increased integration of the Kenyan financial markets with international markets,
- Increased volatility in asset prices in local and international financial markets,
- The need for more sophisticated risk management tools and strategies, and
- The need to broaden and deepen Kenyan financial markets.
Currently, the Derivatives market offers investors Equity Single Stock Futures (SSF) and Equity Index Futures, and will later introduce other financial and commodities derivatives. Currently, the bourse offers 6 Single Stock Futures namely Safaricom Plc, Kenya Commercial Bank Group Plc, Equity Group Holdings Plc, East African Breweries Ltd, Barclays Bank of Kenya and British American Tobacco Plc. According to the Capital Market Soundness Report Q3’2019, 349 contracts, worth Kshs 12.8 mn, were traded during the quarter under review with a majority of liquidity concentrated around Safaricom and banking counters, mainly KCB Group and Equity Bank. Safaricom accounted for 55.0% of the market’s turnover while KCB accounted for 18.0%, followed by NSE 25 index at 17.0% while Equity Bank stood at 8.0%, during the quarter. In Q4’2019, 148 contracts, worth Kshs 7.1 mn, have been traded so far in the derivatives market, a 57.6% decline from the 349 recorded in Q3’2019 taking the total number of contracts traded in the derivatives market since inception to 497, with a total value of Kshs 19.9 mn. The NEXT derivatives market is expected to provide new opportunities to investors enabling them to diversify, manage risk and allocate capital efficiently. However, it still remains extremely small.
- Consolidation: Consolidation remained a key highlight in 2019 with the following being the major M&A’s activities witnessed during the year by the top three banks in the industry:
- On 27th September 2019, the Central Bank of Kenya approved the merger and name changes of NIC Group and Commercial Bank of Africa (CBA), which paved the way for the merged institution to officially start operating as NCBA Group PLC. Read more information on the same here, and,
- KCB Group also received the approval from the regulator to acquire 100% stake in National Bank which increased its shares from 3.07 bn units to 3.21 bn units, lifting the lenders market capitalization to Kshs. 135.6 bn from Kshs. 129.3 bn. Read more information on the same here.
Other mergers and acquisitions that happened or were announced during the year include;
-
-
- Equity Group Holdings, in its expansion strategy had various ongoing acquisitions in the region inclusive of a 62.0% of the share capital of Rwanda’s Banque Populaire du Rwanda, and 100.0% of African Banking Corporation Mozambique, African Banking Corporation of Zambia, and African Banking Corporation of Tanzania. These acquisitions will allow Equity Group Holdings an easy penetration into these four African countries. Further, the lender is set to acquire a 66.5% stake in Banque Commerciale du Congo (BCDC), a top bank in the Democratic Republic of Congo owned by the George Arthur Forrest family. For more information see here,
- Commercial International Bank sent an application to Competition Authority of Kenya propositioning to acquire controlling interest in Mayfair Bank, a Tier III Kenyan bank. Mayfair is the fourth smallest lender in Kenya and it recorded a loss of Kshs. 250.0 mn in Q3’2019, and,
- Access Bank Nigeria is set to acquire Transnational Bank following the approval by Competition Authority of Kenya and Central Bank of Kenya. Access Bank is expected to acquire a controlling stake equivalent to 93.57% in the troubled lender who reported a full-year pre-tax loss of Kshs 98.5 mn in 2018.
-
Below is a summary of the deals in the last 5-years that have either happened, been announced or expected to be concluded:
|
Acquirer |
Bank Acquired |
Book Value at Acquisition (Kshs. Bn) |
Transaction Stake |
Transaction Value (Kshs. Bn) |
P/Bv Multiple |
Date |
|
Access Bank (Nigeria) |
Transnational Bank Ltd. |
1.9 |
93.6% |
Undisclosed |
N/A |
Oct-2019* |
|
Oiko Credit |
Credit Bank |
3.0 |
22.8% |
1.0 |
1.5x |
Aug-19 |
|
KCB Group |
National Bank of Kenya |
7.0 |
100.0% |
6.6 |
0.9x |
Sep-19 |
|
CBA Group |
NIC Group |
33.5 |
53%:47% |
23.0 |
0.7x |
Sep-19 |
|
CBA Group |
Jamii Bora Bank |
3.4 |
100.0% |
1.4 |
0.4x |
Jan-19 |
|
AfricInvest Azure |
Prime Bank |
21.2 |
24.2% |
5.1 |
1.0x |
Jan-19 |
|
KCB Group |
Imperial Bank |
Unknown |
Undisclosed |
Undisclosed |
N/A |
Dec-18 |
|
SBM Bank Kenya |
Chase Bank Ltd |
Unknown |
75.0% |
Undisclosed |
N/A |
Aug-18 |
|
DTBK |
Habib Bank Kenya |
2.4 |
100.0% |
1.8 |
0.8x |
Mar-17 |
|
SBM Holdings |
Fidelity Commercial Bank |
1.8 |
100.0% |
2.8 |
1.6x |
Nov-16 |
|
M Bank |
Oriental Commercial Bank |
1.8 |
51.0% |
1.3 |
1.4x |
Jun-16 |
|
I&M Holdings |
Giro Commercial Bank |
3.0 |
100.0% |
5.0 |
1.7x |
Jun-16 |
|
Mwalimu SACCO |
Equatorial Commercial Bank |
1.2 |
75.0% |
2.6 |
2.3x |
Mar-15 |
|
Centum |
K-Rep Bank |
2.1 |
66.0% |
2.5 |
1.8x |
Jul-14 |
|
GT Bank |
Fina Bank Group |
3.9 |
70.0% |
8.6 |
3.2x |
Nov-13 |
|
Average |
|
75.2% |
1.4x |
|||
|
* Announcement date |
||||||
In 2019, Kenya’s operating environment was characterized by challenging macro-economic conditions owing to delayed long rains that led to decline in agricultural production and consequently, slowed manufacturing activity. However, with the repeal of the rate cap law in November 2019, the financial performance of banks is expected to further improve and consequently spark investor confidence. In 2019, the market remained slumped with P/E below its’ historical average of 13.3x to 11.8x, below the most recent peak of 15.9x in April 2018, showing that pockets of value still exist. We remain neutral on equities for investors with short-term investment horizon, but are positive for investors with a long-term investment horizon.
In 2019, the real estate sector grew by 4.8% on average in the first three quarters, 0.3% points higher than the growth rate recorded over the same period in 2018, as per the Kenya National Bureau of Statistics (KNBS) Quarterly Gross Domestic Product Report Q3'2019. In line with this, the sector also registered a 20.3% increase in the value of buildings approved for the first nine months of the year to Kshs 121.3 bn, from Kshs 100.8 bn similar period of review in 2018, indicating the sector’s improvement during the year. The growth is attributable to (i) enhanced infrastructure, which continues to boost Nairobi’s positioning as a regional hub, and thus, attracted foreign investment, (ii) the huge housing deficit and the support accorded by the National Government to developers and buyers, in a bid to address the shortage, and (iii) stable economic expansion with the country’s GDP growing by 5.6% in 2018, in comparison to the five year average of 5.4%.
However, the sector also continued to face certain constraints, mainly in the form of (i) oversupply in the commercial office and retail sectors, with a surplus of 5.2 mn SQFT and 2.0 mn SQFT, respectively, (ii) Insufficient access to financing and high financing cost for both developers and off-takers amidst slow private sector credit growth before the interest rate cap law was repealed, and (iii) delays in processing of construction permits by some County Governments, namely, Nairobi, Kisumu, Kiambu, and Mombasa.
In terms of performance, commercial office, retail, residential, mixed-use developments and serviced apartments sectors registered average rental yields of 7.5%, 7.8%, 5.0%, 7.3%, and 7.6%, respectively, resulting to an average rental yield for the real estate market of 7.0%, 0.4% points lower compared to 7.4% recorded in 2018. Therefore, with a capital appreciation for existing properties at 2.0%, average total returns came in at 9.0%, a 2.2% points decline from 11.2% recorded in 2018. We attribute this to a decline in demand for property evidenced by the 3.4% points decline in the residential sector annual uptake, and the registered glut in office and retail spaces of 5.2 mn SQFT and 2.0 mn SQFT, respectively. However, it is important to note that development returns for investment grade real estate are still estimated to be approximately 20.0% to 25.0% p.a.
|
Annual Real Estate Returns Summary Table, for Existing Properties |
||||
|
|
2017 |
2018 |
2019 |
Y/Y Change (% Points) |
|
Average Rental Yield |
7.6% |
7.4% |
7.0% |
(0.4%) |
|
Average Capital Appreciation |
6.5% |
3.8% |
2.0% |
(1.8%) |
|
Total |
14.1% |
11.2% |
9.0% |
(2.2%) |
|
||||
Source: Cytonn Research 2019
For the detailed real estate market review report, see our Real Estate Annual Markets Review 2019 Note.
I. Residential Sector
The residential market recorded a 3.4% drop in annual uptake, as more individuals continued to opt to rent amidst tough economic times. Average occupancy rates increased by 4.7% points, resulting in a 0.3% increase in average rental yields.
|
Residential Annual Performance Summary 2016-2019 |
|
||||
|
|
2016 |
2017 |
2018 |
2019 |
Y/Y Change (% Points) |
|
Annual Uptake |
25.5% |
26.3% |
22.8% |
19.4% |
(3.4%) |
|
Occupancy |
83.2% |
84.0% |
81.0% |
85.7% |
4.7% |
|
Rental Yield |
4.9% |
5.2% |
4.7% |
5.0% |
0.3% |
|
Price Appreciation |
7.9% |
5.1% |
4.2% |
1.1% |
(3.1%) |
|
Total Returns |
12.9% |
10.3% |
8.9% |
6.1% |
(2.8%) |
|
|||||
Source: Cytonn Research 2019
Apartments performed better with average total returns to investors of 6.8% compared to detached units with 5.3%. Apartments also recorded relatively high demand registering average annual uptake and occupancy rates of 20.2% and 88.7%, in comparison to the residential market averages of 19.4% and 85.7%, respectively. This is as apartments remain more affordable to homebuyers with an average price per SQM of Kshs 97,675 in comparison to detached units with Kshs 141,968 per SQM.
Overall, lower mid-end detached units recorded the highest average price appreciation in the market at 2.0%, in comparison to the residential market average of 1.2%. Satellite Towns such as Athi River, Ruaka and Ruiru continue to attract homebuyers owing to improvement in infrastructure and provision of social amenities while still remaining affordable to majority of Kenya’s lower middle class, thus, giving them a competitive edge in comparison to suburbs.
(All Values in Kshs Unless Stated Otherwise)
|
Residential Market Performance Summary 2019 |
|||||||
|
Segment |
Average Price per SQM |
Average Rent per SQM |
Average Annual Uptake |
Average Occupancy |
Average Rental Yield |
Average Price Appreciation |
Annual Total Returns |
|
Detached Units |
|||||||
|
High-End |
185,673 |
689 |
19.0% |
80.0% |
4.1% |
0.5% |
4.6% |
|
Upper Mid-End |
156,090 |
646 |
20.6% |
80.9% |
4.2% |
0.6% |
4.8% |
|
Satellite Towns |
84,142 |
347 |
18.4% |
86.8% |
4.5% |
2.1% |
6.6% |
|
Average |
141,968 |
561 |
18.7% |
82.6% |
4.3% |
1.1% |
5.3% |
|
Apartments |
|||||||
|
Upper Mid-End |
119,535 |
630 |
21.1% |
88.2% |
5.4% |
0.8% |
6.1% |
|
Lower Mid-End |
95,541 |
548 |
20.0% |
88.9% |
6.0% |
1.8% |
7.8% |
|
Satellite Towns |
77,949 |
401 |
19.6% |
89.1% |
5.5% |
1.0% |
6.5% |
|
Average |
97,675 |
526 |
20.2% |
88.7% |
5.6% |
1.2% |
6.8% |
|
Residential Market Average |
119,822 |
544 |
19.4% |
85.7% |
5.0% |
1.1% |
6.1% |
|
|||||||
Cytonn Research 2019
Investors continued to cash in on the sector with some of the notable projects launched during the period including United Nations’ Habitat Heights in Mavoko, Cytonn’s Applewood in Karen, and Centum’s Riverbank and Cascadia apartment projects along Limuru Road. The government’s Affordable Housing Programme also gained momentum with the first project being completed in September in Ngara and several other launched in Nairobi, Nakuru and Nyeri Counties. The government introduced a raft of measures which we expect will have a net positive impact on the sector including: (i) exemption of stamp duty for the transfer of a house constructed under the affordable housing scheme, (ii) inclusion of unit trust fund managers as registered home ownership savings plan, and (iii) VAT exemption – with terms and conditions applicable - on construction materials for affordable housing developers.
We expect the residential market to pick up in 2019, with better performance particularly in the mid and low mid end segments as investor appetite for the same continues, enabled by the continued government support in form of incentives to developers and buyers. Key opportunities remain in lower middle areas such as Thindigua/Ridgeways, Athi River, as well as upper middle areas such as Runda Mumwe owing to relatively high returns of 8.2%, 7.6%, and 7.6%, respectively in comparison to the overall residential market average of 6.1%. We also expect a turn-around in 2020 in terms of market uptake and transaction volumes following the repeal of the interest rate cap law, which had led to a drastic drop in private sector credit growth affecting buyer demand and developer activity.
II. Commercial Office Sector
The commercial office sector performance softened in 2019 recording 0.6% points and 3.1% points y/y decline in average rental yields and occupancy rates, to 7.5% and 80.2% in 2019, from 8.1% and 83.3%, respectively, in 2018. The subdued performance was largely driven by:
- A decline in uptake of office space attributed to minimal growth in private sector credit, leading to downsizing or business closures, especially for small and medium-sized enterprises (SMEs), and,
- An oversupply of 5.2 mn SQFT office space as at 2018, as per our NMA Commercial Office Report 2019, which has created a bargaining chip for potential tenants, forcing developers and landlords to reduce or maintain prices and rents in order to remain competitive and attract occupants to their office spaces.
The table below shows a summary of commercial office performance over time:
(All values in Kshs unless stated otherwise)
|
Summary of NMA Commercial Office Performance 2015-2019 |
|||||||
|
Year |
FY’15 |
FY’16 |
FY’17 |
FY’18 |
FY’19 |
∆ Y/Y 2017/18 |
∆ Y/Y 2018/19 |
|
Occupancy (%) |
89.0% |
88.0% |
82.6% |
83.3% |
80.2% |
0.7% points |
(3.1%) points |
|
Asking Rents (Kshs/Sqft) |
97 |
103 |
101 |
101 |
96 |
(0.4%) |
(4.5%) |
|
Average Prices (Kshs/Sqft) |
12,776 |
13,003 |
12,649 |
12,719 |
12,638 |
0.6% |
(0.6%) |
|
Average Rental Yields (%) |
8.1% |
8.4% |
7.9% |
8.1% |
7.5% |
0.2% points |
(0.6%) points |
|
|||||||
Source: Cytonn Research 2019
The main highlights in the sector included: (i) the launch of corporate serviced offices at Sanlam Tower, Waiyaki Way, Westlands by Workable Nairobi, a commercial serviced office provider, (ii) the opening of Park Medical Centre along 3rd Parklands Avenue in Parklands, and (iii) opening of business offices by multinational corporations: Cigna, a global health service company, MAC Mobile, a FMCG technology solutions company, Mauritius Commercial Bank (MCB) Group and Abbott, a US-based healthcare company at the UNON Complex in Gigiri, 3 Mzima Springs Road in Kileleshwa, Pramukh towers in Westlands, and Watermark Business Park in Karen, respectively.
Our outlook for the commercial office in the Nairobi Metropolitan Area (NMA) sector remains negative given the increased office space supply and expected stagnation in performance, and thus investment in the commercial office theme should be geared towards long-term gains when the market picks up. Investments still exists in zones with low supply and high returns such as Gigiri and in differentiated concepts such as serviced offices recording rental yields of up to 13.4%.
III. Retail Sector
In 2019, the retail performance softened with yields declining by 1.2% points to 7.8% in 2019 from 9.0% in FY’2018 attributed to:
- An introduction of 0.4 mn SQFT of retail space into the Nairobi Metropolitan Area (NMA) market driving down rents and occupancy rates by 1.5% and 3.3% points, respectively. Some of the new retail spaces amongst others include The Well in Karen and the expansion of Sarit Centre in Westlands, and,
- Constrained spending power among consumers due to a tough financial environment.
The table below shows the performance summary of the retail market:
(All values in Kshs unless stated otherwise)
|
Summary of NMA Retail Sector Performance 2016-2019 |
||||||
|
Item |
2016 |
2017 |
2018 |
2019 |
∆ Y/Y 2018 |
∆ Y/Y 2019 |
|
Average Asking Rents (Kshs/SQFT) |
186.9 |
185.3 |
178.2 |
175.5 |
(3.8%) |
(1.5%) |
|
Average Occupancy (%) |
89.3% |
80.3% |
79.8% |
75.9% |
(0.4%) points |
(4.0%) points |
|
Average Rental Yields |
10.0% |
9.6% |
9.0% |
7.8% |
(0.6%) points |
(1.2%) points |
|
||||||
Source: Cytonn Research 2019
The major highlights for the retail sector for 2019 included:
- South Africa retailer, Shoprite, opened three additional stores at the Garden City Mall along the Thika Superhighway, Waterfront Mall in Karen, and City Mall in Mombasa,
- Local retailer, Nakumatt, closed its remaining Kenyan branches including Prestige Mall, Nakumatt Mega and Megacity Mall in Kisumu,
- Choppies Supermarket announced plans to exit the Kenyan market, where it currently has 12 stores, following poor performance as a result of the growing competition in the sector from both international brands and the informal sector.
We remain upbeat that the retail sector’s performance will remain cushioned by increased market activity driven by the entry of international retailers into the Kenyan market such as Shoprite and Game, and the expansion efforts by local retailers such as Naivas and Tuskys as they take advantage of the attractive rental rates.
IV. Mixed-Use Developments (MUDs)
In 2019, commercial spaces i.e. office and retail in Mixed-Use Developments recorded average rental yields of 7.9% and 8.1%, respectively, 0.4% points and 0.3% points higher than the retail market average of 7.5% and 7.8% in 2019, respectively. The better performance of office and retail spaces in Mixed-Use Developments is attributed to the convenience of the spaces as one-stop centers for consumers living and working in the area.
Kilimani was the best performing MUD area recording average rental yields of 9.1% with the retail and office spaces recording rental yields of 9.6% and 8.4%, respectively, 1.2% points and 0.5% points higher than the sector average of 8.4% and 7.9%, respectively. The performance was driven by high occupancy rates in addition to premium rental rates charged as the area serves a prime commercial and affluent neighbourhood with areas such as Kileleshwa and Lavington, hosting a large portion of Nairobi’s high-end and upper-middle-class population. Mombasa Road and Eastlands were the worst performing areas recording rental yields of 5.7% and 5.5%, respectively attributed to low rental charges as a result of competition from informal Mixed-Use Developments.
|
NMA Mixed-Use Developments Market Performance Summary by Nodes 2019 |
||||
|
Location |
Retail Rental Yield (%) |
Office Rental Yield (%) |
Residential Rental Yield % |
Avg. MUD yield |
|
Kilimani |
9.6% |
8.4% |
9.1% |
|
|
Limuru Rd |
8.6% |
8.3% |
5.7% |
8.0% |
|
Karen |
7.3% |
10.6% |
4.6% |
8.2% |
|
UpperHill |
7.0% |
7.4% |
7.4% |
|
|
Westlands |
9.6% |
7.1% |
4.8% |
7.4% |
|
Thika Rd |
8.3% |
8.0% |
4.8% |
6.0% |
|
Msa Rd |
6.4% |
4.7% |
5.1% |
5.7% |
|
Eastlands |
5.7% |
6.8% |
5.5% |
5.5% |
|
Average |
8.4% |
7.9% |
5.0% |
7.3% |
|
* Mixed-Use Developments in Kilimani and Upper Hill areas had no residential spaces
|
||||
MUDs continue to offer an attractive investment opportunity in comparison to single-use theme concepts. The investment opportunity for mixed-use developments lies in incorporating differentiated concepts such as serviced apartments and offices which provide attractive returns of 6.4% and 13.5%, respectively, compared to the unserviced apartments and office performance of 5.1% and 7.9%, respectively, as at Q3’2019. For more information see Cytonn NMA Mixed-Use Developments (MUDs) Report 2019
V. Hospitality Sector
The hospitality sector recorded continued investor interest in 2019, fueled by the continued demand for hospitality facilities and services. According to the Leading Economic Indicators (LEI) September 2019, the total number of visitors arriving through Jomo Kenyatta (JKIA) and Moi International Airports (MIA) came in at 1.2 mn persons for the period between January and September 2019, 5.4% higher than 1.1 mn persons during the same period in 2018. We attribute the continued growth of the sector to the calm political environment and the improved security, increased air- travel and positive accolades boosting the country’s status as a preferred travel destination globally while promoting it as an attractive investment opportunity for international players.
In terms of new developments, the sector recorded opening of several hospitality facilities, some of which include 40- key Cysuites Apartment Hotel in Westlands, 122-key Radisson Blu Hotel and Residences in Upperhill and 171-key City Lodge Hotel along Limuru Road. A few hotels also embarked on rebranding, aiming at leveraging on international brands and gaining competitive advantage in the wake of stiff competition in the sector, with Sankara Hotel, a 5-star hotel in Westlands rebranding as Marriott's Autograph collection following the signing of a franchise agreement with America’s hospitality group, Marriott International.
In terms of performance in 2019, serviced apartments recorded a slight improvement in performance in 2019 with the average rental yield coming in at 7.6%, which is 0.2% points higher than 7.4% recorded in 2018. We attribute this to the increased demand for serviced apartments by both guests on business and leisure travels, which has triggered an increase in charge rates. The table below shows the market performance summary:
(All values in Kshs unless stated otherwise)
|
Serviced Apartments Performance in 2019 |
||||||
|
Node |
Occupancy 2018 |
Occupancy 2019 |
Monthly Charge per SM 2019 |
Rental Yield 2018 |
Rental Yield 2019 |
% Rental Yield ∆ |
|
Westlands& Parklands |
76.4% |
80.8% |
3,884 |
10.6% |
10.8% |
0.2% |
|
Kilimani |
86.0% |
80.0% |
3,353 |
10.9% |
9.5% |
(1.4%) |
|
Limuru Road/Gigiri |
84.4% |
88.2% |
3,430 |
9.7% |
9.4% |
(0.3%) |
|
Kileleshwa& Lavington |
82.9% |
82.4% |
2,869 |
7.8% |
8.2% |
0.4% |
|
Upperhill |
60.0% |
67.8% |
2,577 |
5.3% |
6.0% |
0.7% |
|
Nairobi CBD |
74.4% |
72.0% |
2,230 |
5.7% |
5.1% |
(0.5%) |
|
Thika Road |
90.0% |
84.4% |
1,321 |
4.4% |
4.0% |
(0.4%) |
|
Msa Road |
85.0% |
5.0% |
||||
|
Average |
79.9% |
79.4% |
2,806 |
7.4% |
7.6% |
0.2% |
|
||||||
Source: Cytonn Research
We expect the hospitality sector to continue recording improved performance going forward driven by the improved security and political stability, increased air- travel and positive accolades boosting the country’s status as a preferred travel destination globally while promoting it as an attractive investment opportunity for international players.
VI. Land Sector
Land prices within the Nairobi Metropolitan Area recorded an 8-year CAGR of 11.9% and a 2.0% y/y price change in 2019. The land performance was positively driven mainly by; i) the growing demand for development land especially in the satellite towns such as Ruiru and Syokimau as developers strive to drive the government’s Big Four government agenda on the provision of affordable housing, ii) improving infrastructure with projects such as the expansion of Waiyaki and the dualling of the Northern by-pass, and iii) reduced supply of development class land at affordable prices in areas close to the Nairobi CBD resulting in demand for development class land in satellite towns.
The table below shows a summary of the performance of the theme in 2019:
(All values in Kshs unless stated otherwise)
|
Summary of Performance 2019- Land Sector |
||||||
|
Nodes |
*Price in 2011 |
*Price in 2017 |
*Price in 2018 |
Price in 2019 |
8 YR CAGR |
Annual Capital appreciation |
|
Satellite Towns- Unserviced Land |
9.0 mn |
20.4 mn |
22.7 mn |
24.9 mn |
13.6% |
7.5% |
|
Nairobi Suburbs - High rise Residential Areas |
46.0 mn |
134.6 mn |
135.0 mn |
137.5 mn |
14.7% |
4.0% |
|
Nairobi Suburbs - Low Rise Residential Areas |
56.0 mn |
82.4 mn |
89.4 mn |
91.6 mn |
6.4% |
2.5% |
|
Satellite Towns- Serviced Land |
6.0 mn |
14.4 mn |
14.3 mn |
14.3 mn |
11.5% |
0.3% |
|
Nairobi Suburbs - Commercial Areas |
156.0 mn |
429.8 mn |
447.3 mn |
428.5 mn |
13.5% |
(4.4%) |
|
Average |
54.6 mn |
136.3 mn |
141.7 mn |
139.4 mn |
11.9% |
2.0% |
|
||||||
Source: Cytonn Research
We retain a positive outlook for the land sector supported by: i) improved infrastructure that exposes areas for investment, ii) political calmness in the country, and iii) the continued focus of the Governments Big Four agenda on the provision of affordable housing.
VII. Infrastructure Sector
As per the KNBS Economic Survey 2019, infrastructure sector’s contribution to GDP increased by 0.4% points to 8.5% in 2018 from 8.1% in 2017, a clear indicator of the sector’s growth. Additionally, in line with the country’s economic expansion goals to make Kenya the African hub for transportation, industrial, and service sectors, the government expenditure continued to increase, albeit at a decreasing rate following the realization of majority of the projects. For the financial year 2019/20, government budget allocated infrastructural development Kshs 435.1 bn, 3.9% higher than 418.8 bn allocated for FY 2018/19. Notable activities during the year included:
- Launch of the Jomo Kenyatta International Airport (JKIA) -Westlands Expressway, an 18.6-kilometer road project, which will start at JKIA and terminate at James Gichuru, along Waiyaki Way Road, in Westlands,
- Completion of Phase 2A of the Standard Gauge Railway (SGR) project, bringing to operationalization the rail between Nairobi and Suswa, Naivasha and the subsequent launch of the Standard Gauge Railway Phase 2B which is set to connect Nakuru and Kisumu Counties,
- Completion of the newly constructed Outer Ring Interchange aimed at creating a seamless link to Thika Road, hence, easing traffic snarl ups on the two major roads,
- The launch of the construction of a 40-km 400kv power line which is set to power Konza City, as well as Kajiado, Makueni, and Machakos Counties, and,
- Commencement of the 17.4 km Western Bypass in April. The Kshs 17 bn project starts from Gitaru- linking the Northern bypass to the Southern Bypass - and terminates at Ruaka, in Kiambu County.
With the Government’s economic transformation agenda, we expect to see more infrastructural projects being unveiled, which in turn will boost the real estate sector’s performance and also lead to opening up of more areas for real estate development.
V . Statutory Review
In 2019, the government introduced a raft of measures targeting real estate, especially in an effort to improve home ownership and generally the existing regulatory structures. They include:
- Exemption of stamp duty for the transfer of a house constructed under the affordable housing scheme,
- Exemption of companies implementing projects under the affordable housing scheme from the application of thin capitalization rules,
- Exemption of goods supplied for the direct and exclusive use for houses under the affordable housing scheme approved by the Cabinet Secretary (CS) for Finance from Value Added Tax (VAT),
- Exemption from income tax of withdrawals from the NHDF to purchase a house by a first time home owner,
- Inclusion of Unit Trust Fund Managers as Registered Home Ownership Savings Plan, and
- Exemption of an investee company of a REIT registered by the Commissioner of Domestic Taxes (the Commissioner) from income tax.
VI. Listed Real Estate
The Fahari I-REIT closed the year 2019 at Kshs 9.4 per share, 6.9% lower than its opening price of Kshs 10.1 per share. The REIT’s value declined by 16.0% y/y trading at an average of Kshs 8.9 per share in comparison to Kshs 10.6 in 2018. The poor performance is attributable to (i) opacity of the exact returns from the underlying assets, (ii) the negative sentiments currently engulfing the sector given the poor performance of Fahari and Fusion REIT (FRED), (iii) inadequate investor knowledge, and (iv) lack of institutional support for REITs. For more analysis, see our REITs Topical
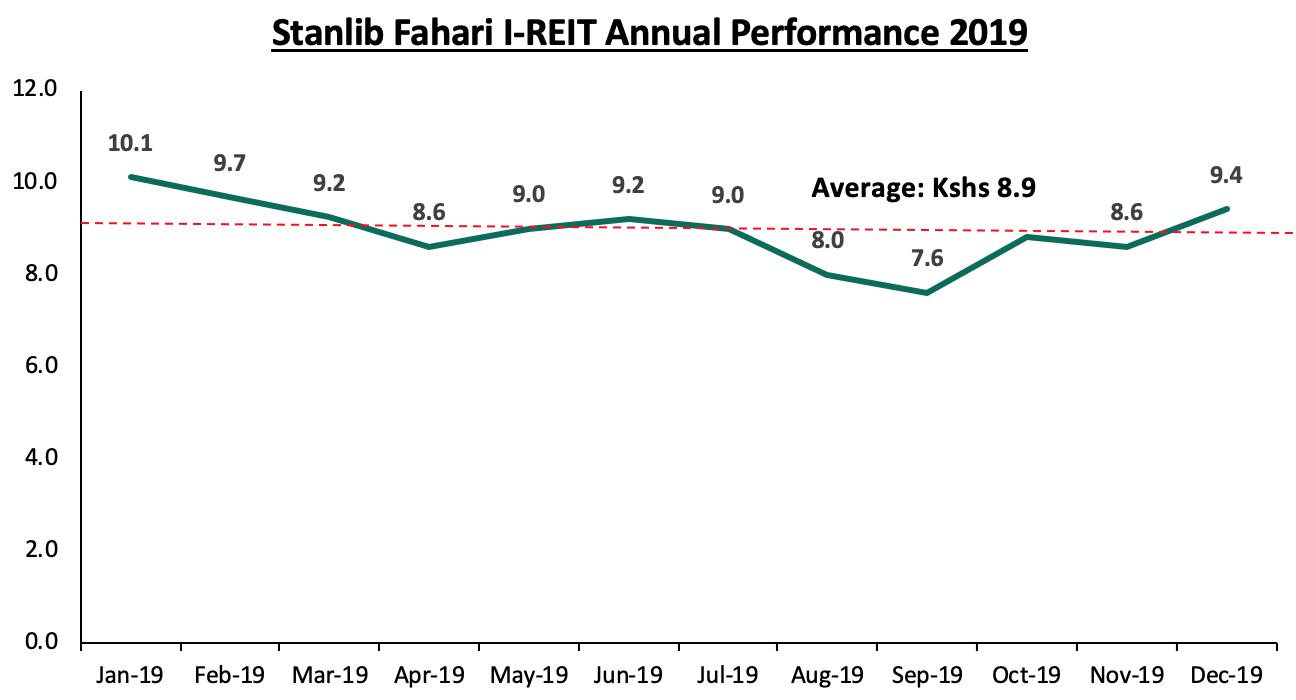
Our outlook for the REIT market remains negative due to the insufficient market structures and poor market sentiment, however, attempts by key real estate industry players in the region such as East Africa Forum for Structured products and REITs Association of Kenya to improve the market sentiment on REITs and other alternative investments, government efforts to improve the regulatory structures and the need for capital by developers is expected to drive uptake of the REIT.
Notable activities in the sector during the year included the enactment of the Finance Act 2019 which exempted the income of REITs investee companies from income tax and ICEA Lion Asset Management, a Kenya based fund manager, signed an agreement to acquire Stanlib Kenya.
Overall, we expect the real estate sector performance to continue picking up in 2020 supported by increased infrastructural upgrades, vibrant tourism sector, increase in foreign investments, and the anticipated improvement in private sector credit growth. The graph below is a summary of real estate performance in 2019:
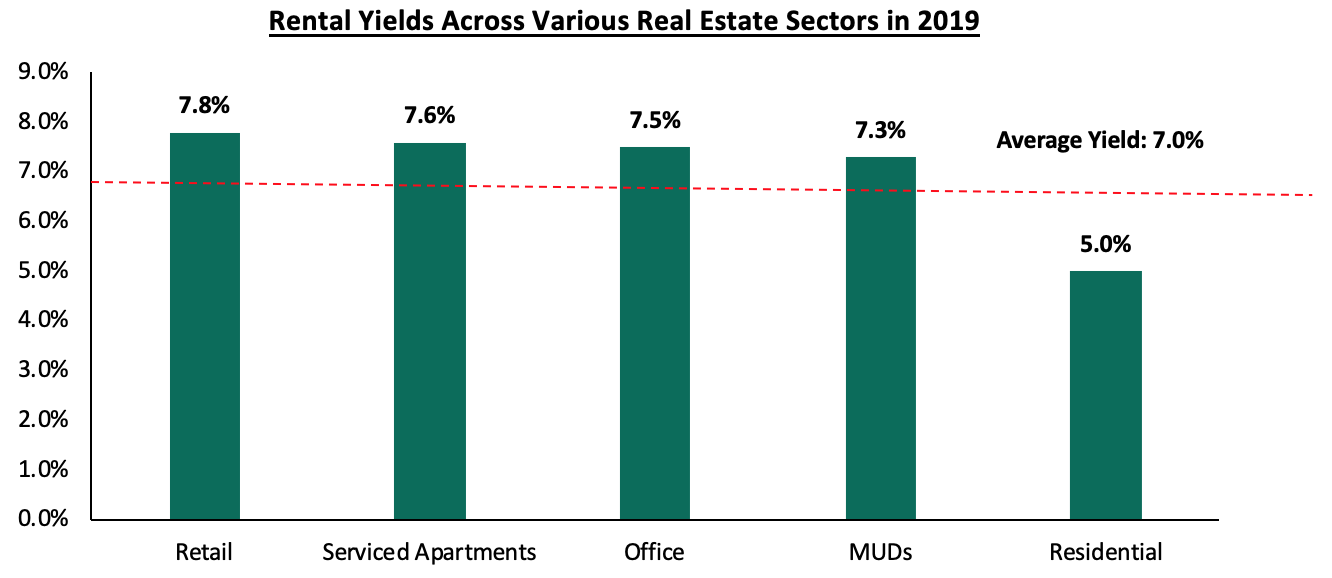
Annual capital appreciation for existing properties in 2019 averaged at 2.0%.
The sector’s pockets of value remain in themes such as housing for lower-middle to low-income earners in Satellite Towns such as Ruiru, Athi River and Ruaka, and differentiated concepts that have continued to deliver above-market rental yields such as serviced offices and serviced apartments with 13.4% and 7.6%, respectively, as well as mixed-use developments where office and retail spaces recorded average rental yields of 7.9% and 8.1%, respectively, 0.4% points and 0.3% points higher than their respective market average of 7.5% and 7.8%.
Disclaimer: The views expressed in this publication are those of the writers where particulars are not warranted. This publication is meant for general information only and is not a warranty, representation, advice or solicitation of any nature. Readers are advised in all circumstances to seek the advice of a registered investment advisor.

- Talk to us
- Kenya
- P.O Box 20695 - 00200, Nairobi, Kenya
- Cell +254709101200
- Tel +254709101200
- WhatsApp +254741676635
- United States
- +254709101200
- DOWNLOAD OUR APP
-


- Kenya
- 8th Floor, Pinetree Plaza, Kaburu Drive, Ngong Road, Nairobi, Kenya
- USA
- Suite 1150, 1775 Eye Street NW, USA, Washington DC 20006, USA
- Investments
- High Yield
- Private Equity
- Real Estate
- Real Estate
- RiverRun Estates
- Cytonn Towers
- The Ridge
- Taraji Heights
- The Alma