Investment Options in the Kenyan Market, & Cytonn Weekly #30/2019
By Cytonn Investments, Jul 28, 2019
Executive Summary
Fixed Income
T-bills remained oversubscribed during the week, with the overall subscription rate rising to 113.5%, from 108.4% recorded the previous week. The continued oversubscription is attributable to favorable liquidity in the market supported by government payments. The yields on the 91-day, 182-day and 364-day papers rose by 9.4 bps, 0.7 bps and 20.3 bps to 6.6%, 7.4% and 9.0%, respectively. The Monetary Policy Committee (MPC) met on 24th July 2019 to review the prevailing macroeconomic conditions and decide on the direction of the Central Bank Rate (CBR). The MPC retained the prevailing monetary policy stance leaving the Central Bank Rate (CBR) unchanged at 9.0%, line with our expectations;
Equities
During the week, the equities markets was on a downward trend with NASI, NSE 20 and NSE 25 declining by 0.7%, 0.9% and 0.3%, respectively, taking their YTD performance to gains/(losses) of 5.9%, (6.0%) and 1.4%, for NASI, NSE 20 and NSE 25, respectively. During the week, the Banking Amendment Bill was tabled at the National Assembly, seeking to seal the loopholes in the wording used to define terms in the Banking (Amendment) Act 2015, in response to the high court ruling terming the law as unconstitutional;
Private Equity
During the week, Interswitch, a Nigeria-based payments firm that is owned 60.0% by Helios Investment Partners, announced that it has hired advisors, including JPMorgan Chase & Co., Citigroup Inc. and Standard Bank Group Ltd to resurrect plans for a stock-market listing in London and Lagos later this year;
Real Estate
During the week, Hass Consult, a local real estate agency, released the Hass Property Sales and Rental Index Q2’2019. According to the report, land prices in Nairobi suburbs recorded a marginal q/q increase of 0.6% and a 1.7% annual appreciation, while residential property recorded a 3.0% quarterly decline in sale prices. In the residential sector, Shelter Afrique, a pan-African finance institution, signed a memorandum of understanding (MOU) with Terwilliger Centre for Innovation in Shelter (TCIS), the financing arm of Habitat for Humanity International, which will see TCIS assist Shelter Afrique in mobilizing capital for affordable housing. National Housing Corporation (NHC), announced plans to put up a Kshs 500 million project in Eldoret, using the Expanded Polystyrene Panel (EPS) technology, targeting low-income households. In the retail sector, South African retailer, Game, opened its third outlet in Kenya and its first outside Nairobi, at the Kisumu Mega City Mall;
Focus of the Week
The investment market in Kenya has over the years grown its product offering to investors to become the leading and vibrant investment destination in the East African region. By having traditional investment products such as equities, fixed income securities, mutual funds, pension funds, and alternative investment products such as structured products, real estate, private equity, and the recently launched derivatives market, investors have been provided with various avenues to channel their investments in the market. The purpose of this focus note is thus to highlight the various investment options for investors in the Kenyan market;
- Cytonn Investments held a training on financial planning at the Park Inn for members of the medical profession. Read the event note here;
- Ian Kagiri, Investments Analyst was on CNBC to discuss the government's concern about the social impact of betting in the country and the introduction of new gambling regulations. Watch Ian here;
- Phase 1 of The Alma is now 100% sold with early buyers having achieved up to 55% capital appreciation. We are now running a promotion in Phase 2: Buy a unit in Phase 2 with a 15-year payment plan and 0% deposit. For inquiries, please email us on clientservices@cytonn.com. The site is open between 8 am - 5 pm, 7-days a week for site visits;
- Cytonn Money Market Fund closed the week at an average yield of 11.0% p.a. To subscribe, just dial *809#
- For an exclusive tour of Cytonn’s real estate developments, visit: Sharp Investor’s Tour and for more information, email us at sales@cytonn.com;
- Following the completion and handover of Amara Ridge in Karen, we have now launched our next Karen project, dubbed Applewood, a Kshs 2.5 bn residential development located in Miotoni, Karen. This signature development shall comprise luxury homes, each sitting on 1/2 acre. We invite you to the exhibition of Applewood which is ongoing at the Amara Ridge Clubhouse (Location pin: https://goo.gl/maps/B3GVnu8pHyn) or at the Applewood Sales Centre on Miotoni Road (Location pin: https://goo.gl/maps/ZfABuGjFo1z) from 9:00 am to 5:00 pm daily. Call 0709 101 000 or email resales@cytonn.com to reserve a villa! See Video here;
- We continue to hold weekly workshops and site visits on how to build wealth through real estate investments. The weekly workshops and site visits target both investors looking to invest in real estate directly and those interested in high yield investment products to familiarize themselves with how we support our high yields. Watch progress videos and pictures of The Alma, Amara Ridge, and The Ridge;
- We continue to see very strong interest in our weekly Private Wealth Management Training (largely covering financial planning and structured products). The training is at no cost and is open only to pre-screened participants. We also continue to see institutions and investment groups interested in the training for their teams. Cytonn Foundation, under its financial literacy pillar, runs the Wealth Management Training. If interested in our Private Wealth Management Training for your employees or investment group, please get in touch with us through wmt@cytonn.com. To view the Wealth Management Training topics;
- For recent news about the company, see our news section here;
- We have 10 investment-ready projects, offering attractive development and buyer targeted returns. See further details here: Summary of Investment-Ready Projects.
T-Bills, T-Bonds Primary Auction & Money Markets:
T-bills remained oversubscribed during the week, with the overall subscription rate rising to 113.5%, from 108.4% recorded the previous week. The continued oversubscription is attributable to favorable liquidity in the market supported by government payments. The yields on the 91-day, 182-day and 364-day papers rose by 9.4 bps, 0.7 bps and 20.3 bps to 6.6%, 7.4% and 9.0%, respectively. The acceptance rate declined to 89.1%, from 96.4% the previous week, with the government accepting Kshs 24.3 bn of the Kshs 27.2 bn worth of bids received, higher than the weekly quantum of Kshs 24.0 bn. The 91-day and 364-day papers registered improved subscription to 201.8% and 164.5% from 187.6% and 115.6%, recorded the previous week, respectively. The 182-day paper however recorded a downturn in subscription to 27.2% from 69.7% recorded the previous week.
For the month of July, the Kenyan Government issued a 15-year bond issue number FXD 3/2019/15, the first T-Bond for the 2019/2020 fiscal year and the third 15-year tenor bond in 2019, in a bid to raise Kshs 40.0 bn for budgetary support. The accepted yield for the issue came in at 12.3% in line with our expectations as highlighted in last week’s bidding range of 12.2%-12.4%. The issue recorded a significantly high subscription rate at 216.7%, driven by the current high liquidity in the money markets attributable to the government payments as well as effects emanating from the ongoing demonetization process.
In the money markets, 3-month bank placements ended the week at 8.8% (based on what we have been offered by various banks), 91-day T-bill at 6.6%, the average of Top 5 Money Market Funds at 10.0%, with the Cytonn Money Market Fund closing the week at an average yield of 11.0% p.a.
Liquidity:
Liquidity in the market remained favorable during the week attributable to the government payments as well as effects emanating from the ongoing demonetization process. This was despite the average inter-bank rate rising slightly to 2.4%, from 2.1% recorded the previous week. The average volumes traded in the interbank market declined by 20.8% to Kshs 8.2 bn, from Kshs 10.4 bn the previous week.
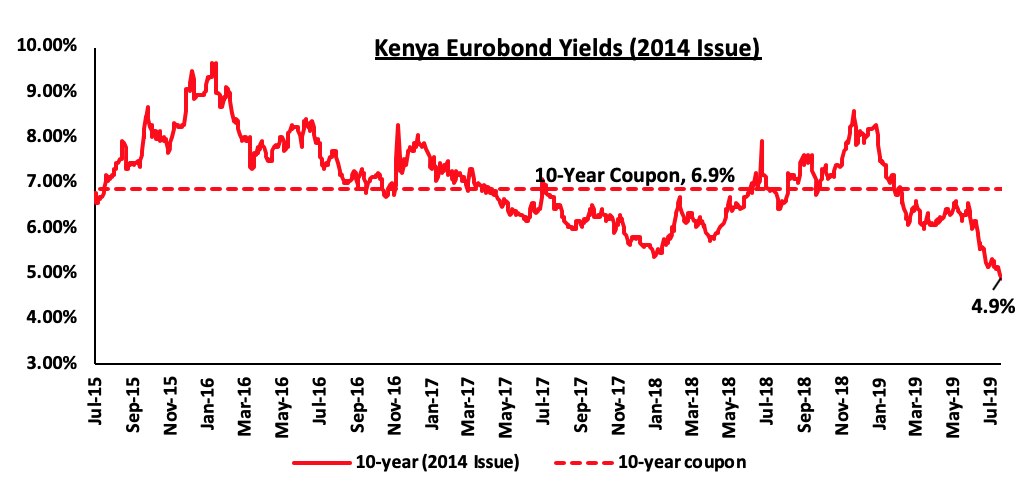
Kenya Eurobonds:
The yield on the 10-year Eurobond issued in 2014 dropped by 0.2% points to 4.9%, from 5.1% recorded the previous week. The continued decline in yields has been attributed to increased demand for emerging market fixed-income securities in the wake of the pause by the US Fed on its three-year cycle of tightening its monetary policy, which had made returns from fixed income securities more attractive as highlighted in our H1'2019 SSA Eurobond Performance Note
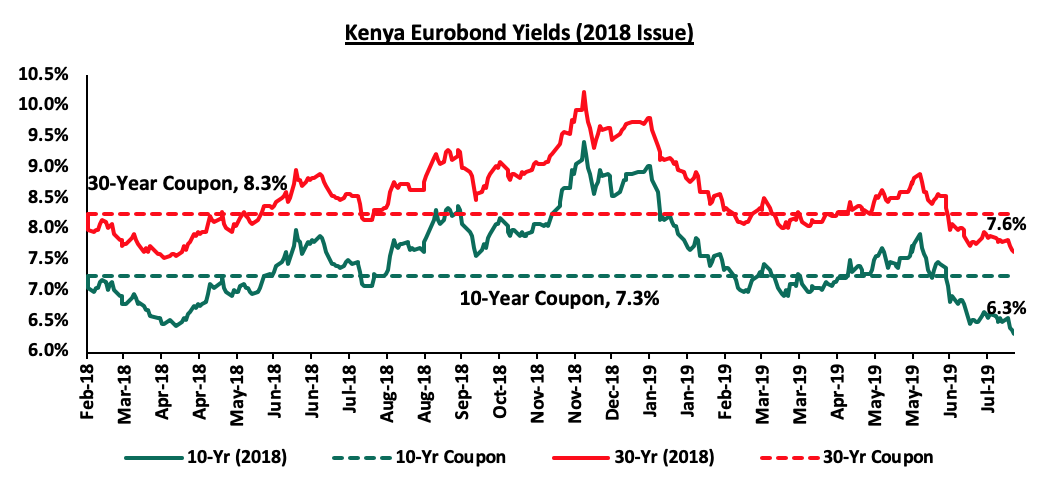
 For the February 2018 Eurobond issue, yields on both the 10-year and 30-year Eurobonds dropped by 0.2% points to 6.3% and 7.6%, from 6.5% and 7.8% recorded the previous week, respectively.
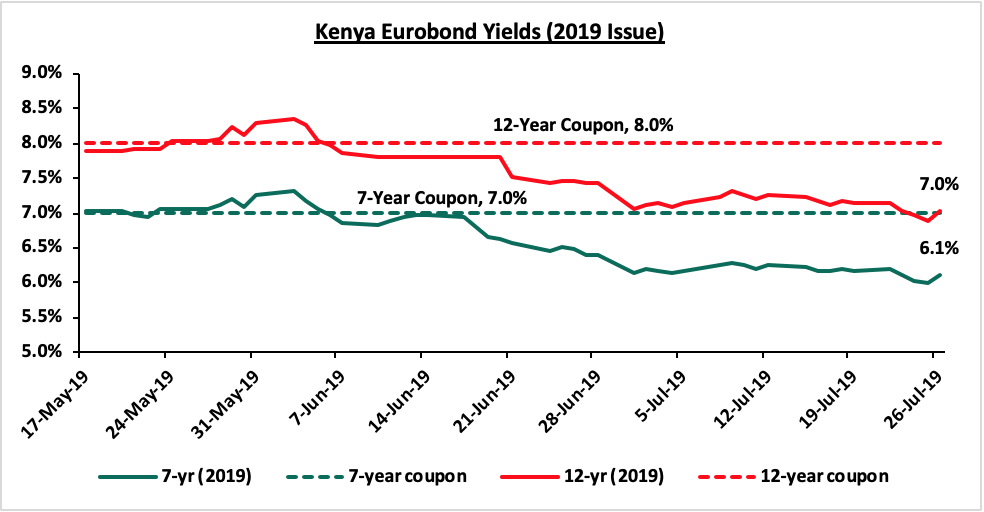
 For the newly issued dual-tranche Eurobond with 7-years and 12-years tenor, priced at 7.0% for the 7-year tenor and 8.0% for the 12-year tenor, respectively, the yields on the 7-year bond and the 12-year bond dropped by 0.1% points to 6.1% and 7.0%, from 6.2% and 7.1% recorded the previous week, respectively.
It is noteworthy that yields for all Kenya Eurobonds dropped during the week despite the Cabinet Secretary and the Principal Secretary for National Treasury having both been charged in court on corruption allegations; an indicator that international bond investors are taking the changes in stride, especially given that the President was quick to appoint their replacements.
The Kenya Shilling:
During the week, the Kenya Shilling depreciated by 0.7% against the US Dollar to close at Kshs 103.8, from Kshs 103.1 the previous week, with the shilling hitting a 3 year low of Kshs 104.0, partly driven by uncertainty caused by Monday's announcement that the Treasury Cabinet Secretary would be charged with financial misconduct, coupled with a relatively liquid money market. The Kenya Shilling has depreciated by 1.9% year to date, in comparison to the 1.3% appreciation in 2018. Despite the recent depreciation we still expect the shilling to remain relatively stable to the dollar in the short term, supported by:
- The narrowing of the current account deficit, with preliminary data indicating that the current account deficit narrowed to 4.2% of GDP in the 12-months to June 2019, from 5.4% recorded in June 2018. The decline has been attributed to the resilient performance of exports particularly horticulture and coffee, strong diaspora remittances, and higher receipts from tourism and transport services. Growth of imports also slowed mainly due to lower imports of food,
- Improving diaspora remittances, which have increased cumulatively by 13.6% in the 12 months to June 2019 to USD 2.8 bn, from USD 2.4 bn recorded in a similar period of review in 2018. The rise is due to:
- Increased uptake of financial products by the diaspora due to financial services firms, particularly banks, targeting the diaspora, and,
- New partnerships between international money remittance providers and local commercial banks making the process more convenient,
- CBK’s supportive activities in the money market, such as repurchase agreements and selling of dollars, and,
- High levels of forex reserves, currently at USD 9.6 bn (equivalent to 6.0-months of import cover), above the statutory requirement of maintaining at least 4.0-months of import cover, and the EAC region’s convergence criteria of 4.5-months of import cover.
Weekly Highlights:
The Monetary Policy Committee (MPC) met on 24th July 2019 to review the prevailing macroeconomic conditions and decide on the direction of the Central Bank Rate (CBR). The MPC retained the prevailing monetary policy stance leaving the Central Bank Rate (CBR) unchanged at 9.0%, in line with our expectations citing that inflation expectations remained well anchored within the target range and that the economy was operating close to its potential as evidenced by:
- Month on month inflation remained within the 2.5% - 7.5%, target range despite rising to 5.7% in June, from 5.5% in May, largely driven by a rise in food inflation to 6.6% in June from 6.0% in May, attributed to increases in the prices of non-vegetable food crops particularly maize, due to uncertain supply,
- Stability in the foreign exchange market supported by the narrowing of the current account deficit to 4.2% of GDP in the 12-months to June 2019, from 5.4% in June 2018, driven by resilient performance of exports particularly horticulture, and higher diaspora remittances, and receipts from tourism and transport services, coupled with slower growth in imports of food and SGR-related equipment. The foreign exchange market has also been supported by adequate forex reserves currently at USD 9.6 bn (equivalent to 6.0 months of import cover), that continue to provide adequate cover and a buffer against short-term shocks in the foreign exchange market, and,
- Improving private sector credit growth despite being below historical averages coming in at 5.2% in the 12-months to June, compared to 4.4% in the 12-months to May with strong growth being observed in the consumer durables (21.3%), manufacturing sector (11.4%) and private households (7.6%).
As such, the MPC concluded that the current policy stance was still appropriate, but noted that there was a need to remain vigilant on possible spillovers of recent high food and fuel prices, the ongoing demonetization, and the increased uncertainties in the external environment. We expect monetary policy to remain relatively stable in 2019, as the CBK awaits the direction of the discussion on the possible repeal or modification of the interest rate cap, which has weakened the transmission of monetary policy. As per the assessment by the Monetary Policy Committee in 2018, under the interest rate capping environment, monetary policy produces perverse outcomes. For instance loosening the monetary policy stance by reducing the CBR in a bid to stimulate credit expansion in the current environment would lead to a lower adjustment in lending rates. As a result, individuals with credit risk above the capped rate would be shunned by banks, resulting in a contraction in private sector credit growth, a counteractive reaction to the intention of the looser monetary policy stance.
Rates in the fixed income market have remained relatively stable as the government rejects expensive bids. A budget deficit is likely to result from depressed revenue collection with the revenue target for FY’2019/2020 at Kshs 2.1 tn, creating uncertainty in the interest rate environment as additional borrowing from the domestic market goes to plug the deficit. Despite this, we do not expect upward pressure on interest rates due to increased demand for government securities, driven by improved liquidity in the market owing to the relatively high debt maturities. Our view is that investors should be biased towards medium-term fixed income instruments to reduce duration risk associated with long-term debt, coupled with the relatively flat yield curve on the long-end due to saturation of long-term bonds.
Market Performance
During the week, the equities markets was on an downward trend with NASI, NSE 20 and NSE 25 falling by 0.7%, 0.9% and 0.3%, respectively, taking their YTD performance to gains/losses of 5.9%, (6.0%) and 1.4%, for NASI, NSE 20 and NSE 25, respectively. The performance in NASI was driven by declines in Equity Group, BAT, Safaricom, and NIC Group, which declined by 4.1%, 1.5%, 1.4%, and 1.3%, respectively.
Equities turnover increased by 18.0% during the week to USD 26.0 mn, from USD 22.0 mn the previous week, taking the YTD turnover to USD 864.1 mn. Foreign investors remained net sellers for the week, with the net selling position decreasing by 60.1% to USD 4.3 mn, from USD 7.2 mn the previous week.
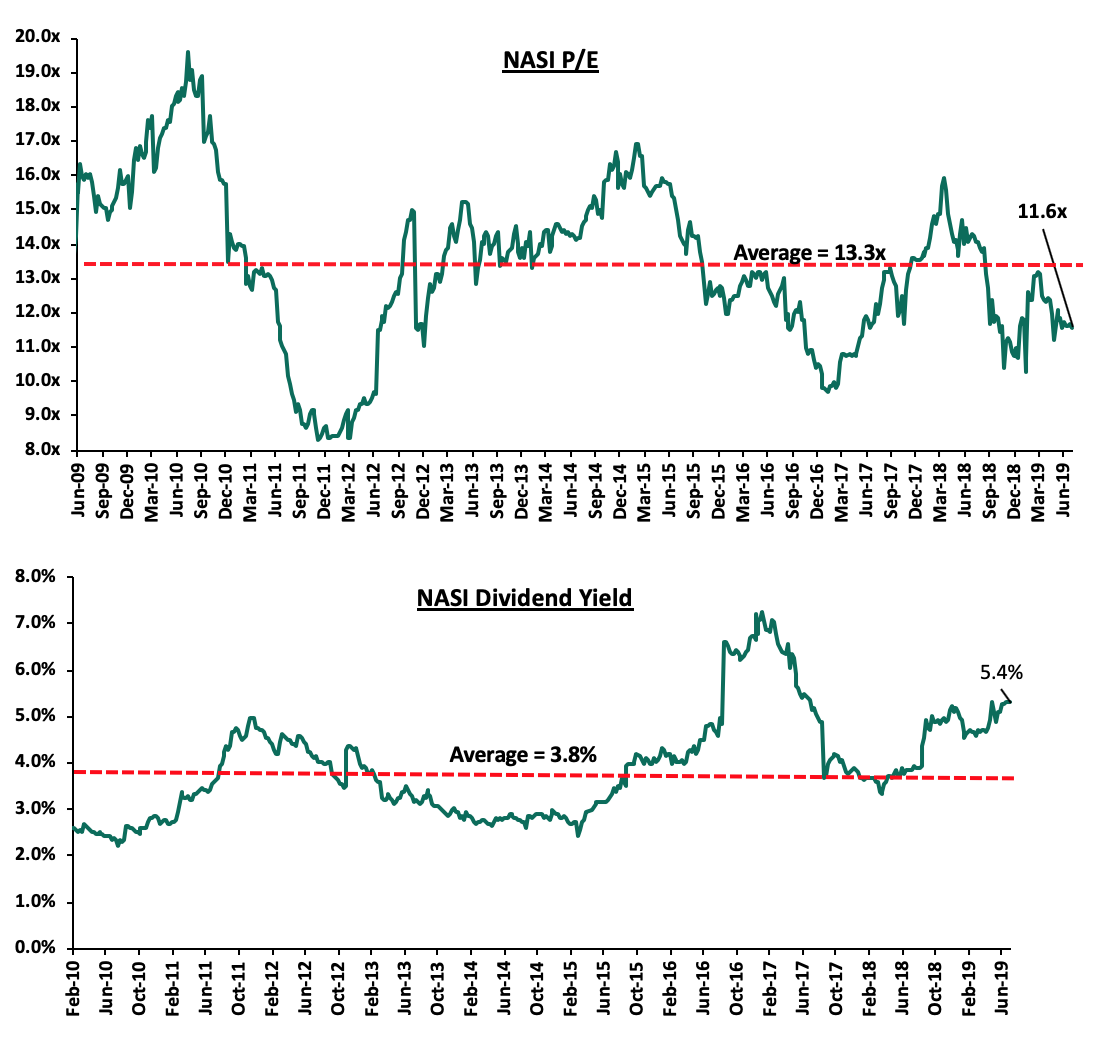
The market is currently trading at a price to earnings ratio (P/E) of 11.6x, 12.8% below the historical average of 13.3x, and a dividend yield of 5.4%, 1.6% points above the historical average of 3.8%. With the market trading at valuations below the historical average, we believe there is value in the market. The current P/E valuation of 11.6x is 19.4% above the most recent trough valuation of 9.7x experienced in the first week of February 2017, and 39.4% above the previous trough valuation of 8.3x experienced in December 2011. The charts below indicate the historical P/E and dividend yields of the market.
 Weekly Highlights:
During the week, the Banking Amendment Bill was tabled in the National Assembly. The Bill seeks to seal the loopholes in the wordings of the Banking (Amendment) Act 2015. In March 2019, the High Court suspended the Banking (Amendment) Act 2015 in a ruling that declared Section 33B (1) and (2) of the Banking Act unconstitutional, and gave the National Assembly one year to amend the anomalies, failure to which will mean a reversion to a free-floating interest rates regime. A three-Judge bench determined that the wordings the Parliament used to define the terms ‘credit facility’ and the ‘Central Bank Rate’ are vague and open to multiple interpretations. The anomalies and ambiguity arise in Section 33B (1) of the Banking Act which states that, “a bank or a financial institution shall set the maximum interest rate chargeable for a credit facility in Kenya at no more than four percent, the Central Bank Rate set and published by the Central Bank of Kenya (now at 9.0%)”. The judges noted that the words “at no more than four percent, the Central Bank Rate” are vague since it is not clear if it is above or below CBR. In September 2018, the National Assembly blocked a section the Finance Bill 2018 that sought to repeal the cap on lending rates, and instead, the floor cap on deposit rates was scrapped off. The outcome of the proposed bill remains uncertain, as we expect the President to possibly decline to ascent the bill. We however continue to strongly advocate for a repeal or at least significantly review the Banking (Amendment) Act, 2015; our position for a repeal is based on the fact that the rate cap legislation (i) has hampered credit growth, evidenced by the continued decline of private sector credit growth, which came in at 4.9% as at April 2019, below the 5-year average of 11.2%, (ii) is harming the very people it was meant to protect – those who are likely to be charged high interest rates because of their credit risk rating. Because of rate caps, banks have shied away from lending to them, leaving them with no options except to approach shylocks and digital lenders, who charge exploitative rates. A proposition to repeal the law was also included in the Finance Bill 2019, where we expected a possible review, in the form of a change in the benchmark from the Central Bank Rate (CBR), to probably the Kenya Bank Reference Rate (KBRR), and an increase in the margin from the current 4.0%. We are also of the view that a reversion to the free-floating rate regime will likely see the following benefits accrue to the economy:
- Growth in private sector credit: As of April 2019, the private sector credit growth rate stood at 4.9% according to the MPC market perception survey. With the repeal of the rate cap law, we expect that access to credit by Micro, Small and Medium Enterprises (MSMEs) will increase as banks will have sufficient margin to compensate for risks. The target credit growth rate that is conducive to a sustainably growing the Kenyan economy is between 7.0-8.0%, according to the Central Bank of Kenya,
- GDP growth: Credit and economic growth are positively correlated and we expect that with increased access to credit by MSMEs, the economy is bound to expand as MSMEs make a significant contribution to the economy. According to data from the KNBS, Micro, Small and Medium Enterprises (MSMEs) 2016 survey, MSMEs account for approximately 28.4% of Kenya’s GDP, and,
- Increased monetary policy effectiveness: With the repeal of the rate cap law, the Central Bank of Kenya will be free to adjust the monetary policy rate in response to economic developments such as inflation and growth.
For additional information, please see our topical on interest rates cap here.
Universe of Coverage
Below is a summary of our SSA universe of coverage:
|
Banks |
Price as at 19/07/2019 |
Price as at 26/07/2019 |
w/w change |
YTD Change |
Target Price* |
Upside/Downside** |
P/TBv Multiple |
Recommendation |
|
Diamond Trust Bank |
115 |
114 |
(0.9%) |
(27.2%) |
228.4 |
96.2% |
0.6x |
Buy |
|
CRDB |
105.0 |
105.0 |
0.0% |
(30.0%) |
207.7 |
88.8% |
0.4x |
Buy |
|
UBA Bank |
5.5 |
5.5 |
0.0% |
(28.6%) |
10.7 |
88.0% |
0.4x |
Buy |
|
Zenith Bank |
18.5 |
18.5 |
(0.3%) |
(20.0%) |
33.3 |
82.9% |
0.8x |
Buy |
|
KCB Group*** |
39.6 |
39.8 |
0.5% |
6.1% |
60.4 |
66.8% |
1.1x |
Buy |
|
GCB Bank |
5.0 |
5.0 |
0.0% |
7.6% |
7.7 |
64.3% |
1.2x |
Buy |
|
I&M Holdings |
52.0 |
53.0 |
1.9% |
24.7% |
81.5 |
54.8% |
1.0x |
Buy |
|
Access Bank |
6.4 |
6.5 |
1.6% |
(4.4%) |
9.5 |
52.3% |
0.4x |
Buy |
|
Co-operative Bank |
12.1 |
12.1 |
0.0% |
(15.4%) |
17.1 |
50.4% |
1.0x |
Buy |
|
Equity Group |
42.0 |
40.3 |
(4.1%) |
15.5% |
53.7 |
42.7% |
1.7x |
Buy |
|
NIC Group |
30.2 |
29.8 |
(1.3%) |
7.0% |
42.5 |
42.3% |
0.6x |
Buy |
|
CAL Bank |
1.0 |
1.0 |
(1.0%) |
0.0% |
1.4 |
40.0% |
0.8x |
Buy |
|
Barclays Bank |
10.3 |
10.5 |
1.5% |
(4.6%) |
12.8 |
33.0% |
1.3x |
Buy |
|
Stanbic Bank Uganda |
29.0 |
29.0 |
0.0% |
(6.5%) |
36.3 |
29.1% |
2.1x |
Buy |
|
SBM Holdings |
5.5 |
5.5 |
(0.4%) |
(8.4%) |
6.6 |
23.1% |
0.8x |
Buy |
|
Guaranty Trust Bank |
29.3 |
28.7 |
(2.2%) |
(16.8%) |
37.1 |
21.1% |
1.8x |
Buy |
|
Stanbic Holdings |
96.0 |
98.5 |
2.6% |
8.5% |
113.6 |
20.6% |
1.1x |
Buy |
|
Ecobank |
8.1 |
8.5 |
5.6% |
13.3% |
10.7 |
19.2% |
1.9x |
Accumulate |
|
Union Bank Plc |
6.5 |
6.4 |
(1.5%) |
14.3% |
8.2 |
16.4% |
0.7x |
Accumulate |
|
Standard Chartered |
195.3 |
196.0 |
0.4% |
0.8% |
200.6 |
9.5% |
1.4x |
Hold |
|
Bank of Kigali |
275.0 |
274.0 |
(0.4%) |
(8.7%) |
299.9 |
8.5% |
1.5x |
Hold |
|
FBN Holdings |
5.7 |
5.6 |
(1.8%) |
(29.6%) |
6.6 |
5.7% |
0.3x |
Hold |
|
Bank of Baroda |
128.0 |
128.0 |
0.0% |
(8.6%) |
130.6 |
3.4% |
1.1x |
Lighten |
|
Standard Chartered |
19.0 |
19.0 |
0.0% |
(9.5%) |
19.5 |
2.3% |
2.4x |
Lighten |
|
National Bank |
4.0 |
3.9 |
(3.8%) |
(27.6%) |
3.9 |
(4.8%) |
0.2x |
Sell |
|
Stanbic IBTC Holdings |
36.6 |
38.1 |
4.1% |
(20.5%) |
37.0 |
(6.5%) |
2.0x |
Sell |
|
Ecobank Transnational |
9.0 |
8.5 |
(5.6%) |
(50.0%) |
9.3 |
(15.6%) |
0.3x |
Sell |
|
HF Group |
4.3 |
4.0 |
(5.9%) |
(27.8%) |
2.9 |
(27.7%) |
0.2x |
Sell |
|
*Target Price as per Cytonn Analyst estimates **Upside / (Downside) is adjusted for Dividend Yield ***Banks in which Cytonn and/or its affiliates are invested in ****Stock prices indicated in respective country currencies |
||||||||
We are “Positive” on equities for investors as the sustained price declines have seen the market P/E decline to below its historical average. We expect increased market activity, and possibly increased inflows from foreign investors, as they take advantage of the attractive valuations to support the positive performance.
During the week, Interswitch, a Nigeria-based payments firm that is owned 60.0% by Helios Investment Partners, announced that it has hired advisors, including JPMorgan Chase & Co., Citigroup Inc. and Standard Bank Group Ltd to resurrect plans for a stock-market listing in London and Lagos later this year. According to Reuters, the value of the financial technology company is speculated to be between USD 1.3 bn to USD 1.5 bn.
Interswitch had earlier plans to list in 2016, however this was thwarted after the price of crude oil fell drastically, causing a contraction in Nigeria’s economy, which resulted in reduced payments between companies, and consequently reduced revenues for payment-services providers. Other African companies that have expressed interest in listing in foreign countries include; Bayport Management Limited, a Mauritius-based financial services group, which announced, in June 2019, it’s also considering a share sale. We also have seen several listings by major African and Middle Eastern technology companies including;
- Jumia Technologies AG, listed in New York earlier this year, in April, and,
- Dubai-based payments firm, Network International Holdings Plc went public in London also in April.
The dual listing in London and Nigeria echoes that of Airtel Africa Plc, the wireless carrier that spun off from Indian parent Bharti Airtel Limited in June 2019 which enabled them to raise USD 750.0 mn through its listing on the London bourse. Based on their initial plans for the delayed listing in 2016, Interswitch aimed to raise about USD 1.0 bn to facilitate potential exits by the company’s private equity investors. Ultimately, the transaction will have numerous advantages for the company, among them: (i) it will give the company access to a larger pool of investors, (ii) it enables a company diversify its capital-raising activities and reduces reliance on its domestic market, and (iii) it improves a company’s share liquidity since it is traded in more than one market.
During the week, Investment firm Centum, through its real estate arm Centum Real Estate, signed a refinancing deal with Nedbank Corporate and Investment Bank (CIB), the Nedbank property finance division. They managed to raise Kshs 6.5 bn from the South Africa-based firm. These funds will allow the firm to consolidate the debt facilities for the Two Rivers development which is the firm’s biggest project. The development is currently in its second phase which will utilize the 102 acres the company owns on Limuru Road in Nairobi, near the affluent neighborhoods of Runda, Nyari, Gigiri and Muthaiga.
Centum Real Estate is currently the master developer in three projects. One in Entebbe, Uganda dubbed the Pearl Marina Development, which will be on 10,254-acres and two in Kenya, Vipingo Development, which covers 384-acres and Two Rivers Development. The firm intends to put up 3,000 residential units on all three sites with the first phase of 1,200 units already under construction. The company highlighted that it had experienced challenges in the sector due to limited access to credit occasioned by the capping of the interest rates.
Private equity investments in Africa remains robust as evidenced by the increasing investor interest, which is attributed to; (i) rapid urbanization, a resilient and adapting middle class and increased consumerism, (ii) the attractive valuations in Sub Saharan Africa’s private markets compared to its public markets, (iii) the attractive valuations in Sub Saharan Africa’s markets compared to global markets, and (iv) better economic projections in Sub Sahara Africa compared to global markets. We remain bullish on PE as an asset class in Sub-Sahara Africa. Going forward, the increasing investor interest and a stable macroeconomic environment will continue to boost deal flow into African markets.
- Industry Reports
During the week, Hass Consult, a local real estate agency, released the Hass Land Price Index Q2'2019, and the key take- outs from the report were as follows;
- Land prices in the Nairobi suburbs recorded a marginal q/q increase of 0.6% and a 1.7% annual appreciation, while land in satellite towns recorded a significant 3.2% q/q and 4.2% annual appreciation. The growth in satellite towns is attributed to strong demand due to affordability of land especially in areas with land prices of Kshs 15 mn and below per acre,
- In Nairobi suburbs, Donholm recorded the highest drop in prices with a quarterly and annual decline of 2.0% and 2.4%, respectively, attributed to decreased investor interest in the area following the announcement by the National Lands Commission (NLC) that it was yet to determine the validity of disputed plots in the area,
- Spring Valley recorded the highest quarterly appreciation of 4.4%, while Loresho recorded the highest annual appreciation of 9.8%. We attribute this to increased demand for development land by investors supported by the relaxation of zoning regulations allowing for densification and thus maximization of land,
- Commercial areas such as Upperhill recorded a price correction of 0.6% quarterly and 1.8% annually, attributed to reduced demand for commercial land for development due to the existing commercial space oversupply, and,
- In satellite towns, Kitengela recorded the highest q/q appreciation of 8.0%, while Mlolongo and Juja recorded the highest annual appreciation of 12.0% and 10.0%, respectively, driven by relatively high demand due to affordability of land.
The above report is in line with Cytonn H1’2019 Market Review, which reported that the land sector in the Nairobi Metropolitan Area recorded subdued performance, attributed to an overall slowdown in real estate investment activity. According to the report, despite the rest of the zones recording a decline in asking prices, un-serviced land in satellite towns such as Ruiru, Juja and Limuru registered a 4.1% annual capital appreciation on average, attributed to the relatively high demand for land in these areas fueled by the affordability.
From the Hass Consult Property Sales and Rental Index Q2’2019 residential property performance recorded a slowdown attributed to slow economic growth during the quarter.
The key take-outs from the report include:
- Residential property sale prices recorded a 3.0% quarterly decline in sale prices, attributable to the slow economic growth during the period,
- Detached units and apartments recorded a quarterly price drop of 4.5% and 0.1%, and a y/y decline of 6.1% and 0.3%, respectively. The slowdown is attributed to distressed sellers move to discounting property prices with the aim of increasing the uptake of the same,
- In the detached market, Ridgeways recorded the highest q/q price appreciation of 2.6%, which we attribute to strong investor demand, and also the superior location, while Nyari and Muthaiga recorded the highest y/y appreciation at 13.2% and 10.0%, respectively, attributed to sustained demand from local wealthy investors,
- Apartments across the sector recorded a decline in sale prices on a quarterly basis, with only Westlands recording a marginal price appreciation of 0.5% among the Nairobi suburbs. Upperhill recorded the highest annual price appreciation at 4.9%. We attribute this to demand for luxury apartments, especially from foreign nationals in addition to proximity to key nodes such as Kilimani and CBD,
- In satellite areas, detached units in Limuru recorded the highest quarterly and annual appreciation of 2.2% and 8.6%, respectively. Apartments in Athi River and Kitengela recorded the highest q/q appreciation at 2.8% and 2.7%, respectively, while on an annual basis, Kitengela recorded the highest price appreciation of 11.7%. We attribute the better performance in satellite towns compared to Nairobi suburbs to the increased demand for units in these areas boosted by infrastructural improvements, and affordability in comparison to the upper markets, and,
- On the rental index, rents recorded a 1.9% q/q drop with detached units recording the highest drop by 3.2% while semi-detached units dropped by 1.6%. We attribute the drop to a decline in demand for maisonettes and bungalows, in the wake of a growing need for affordability. Apartments recorded a q/q rental price appreciation of 0.4% boosted by the growing demand for the same, given their affordability compared to detached and semi-detached units.
The report is in tandem with Cytonn’s Nairobi Metropolitan Area Residential Report 2018/19, which highlighted subdued performance in the high-end market with areas like Kitisuru and Rosslyn reaching their price ceilings, amidst a tough financial environment, which has led to a decline in effective demand. We expect the lower mid-end sectors will continue to exhibit fast growing demand from the majority of Kenyans seeking to buy affordable homes amidst a tough financial environment.
- Residential Sector
During the week, Shelter Afrique a Pan-African finance institution signed a memorandum of understanding (MOU) with Terwilliger Centre for Innovation in Shelter (TCIS), the financing arm of Habitat for Humanity International, which will see TCIS back Shelter Afrique in mobilizing capital for affordable housing. TCIS has set aside approximately Kshs 10.0 bn (USD 100 mn) to be extended to institutions such as microfinances focusing on provision of housing loans to low-middle income population in Kenya and 43 other countries in Africa.
Affordability has continued to be a major constraint to the growth of the housing sector, and a key challenge to accessing decent housing in Kenya. The capping of interest rates has resulted to a decline in credit growth to the private sector as banks tighten their underwriting standards and government paper has become more attractive than lending to private sector on a risk-adjusted basis. Even with the capping of interest rates, the actual cost of credit is still high, averaging between 16.0% and 18.0% due to additional administration fees, which then raise the cost of financing. In addition, 83.4% of total employment is in the informal sector, which is characterized by small-scale activities, relatively unpredictable incomes and limited job security and thus they are unable to afford to buy a house.
We therefore expect the move by TCIS and Shelter Afrique to facilitate the provision of the much-needed housing finance through institutions that serve mainly the middle and low income earners, such as microfinances and Savings & Credit Co-operative Societies (SACCOs), thereby enhancing home ownership in Kenya. This will complement government initiatives aimed towards the same among them:
- The exemption from stamp duty tax for first time home buyers under the affordable housing scheme,
- 0% corporate tax rate relief (half the statutory 30%) for developers who provide at least 100 low – cost housing units per annum,
- The affordable housing relief where buyers get a 15.0% tax relief up to a maximum of Kshs 108,000 p.a., or Kshs 9,000 p.m.,
- Formation of the Kenya Mortgage Refinancing Company (KMRC) whose main function is enhancing mortgage affordability by enabling long-term loans at attractive market rates, and
- Establishment of the National Housing Development Fund (NHDF), which includes a 1.5% levy on employee’s monthly basic salaries up to Kshs. 5,000 and the employer expected to match the same amount that will be channeled into the fund.
National Housing Corporation (NHC), announced plans to put up a Kshs 500 million project in Eldoret, using the Expanded Polystyrene Panel (EPS) technology, targeting low-income households. The 14-storey residential development will sit on 6.6 acres at the NHC Kapsuswa Rental Housing Scheme and will consist of 180 one-bedroom units and two studio-cum commercial spaces with sizes and price points of the units yet to be disclosed. According to NHC, the project will be built using EPS, and this will help spread technical skills on application of the alternative building technology outside Nairobi. The technology is yet to gain popularity with the poor perception from Kenyans who still prefer the conventional brick and mortar method of construction. However, developers are seeking for alternative building methods aimed at cutting on the construction costs, which has been identified as a key limitation to the delivery of affordable housing in Kenya. According to Cytonn Research, using the conventional brick and mortar, mid-level construction costs in Kenya range from Kshs 44,000 - Kshs 64,000 per square metre (SQM) depending on the level of finishes, height and other related factors, and account for 50% - 70% of development costs, thus limiting the affordability of housing units. EPS technology involves construction of houses by assembling ready-made EPS foam, sandwiched between a galvanised steel wire mesh that is plastered on both sides with concrete. Despite not being popular in Kenya, according to online research, cost benefits accrued from using EPS panels include;
- Reduced costs as construction time is reduced by approximately 50.0%, as the panels are quick to fix thus resulting in a fast work rate,
- A lower cost of wastage of materials since leftover panels can be recycled,
- The panels have a higher resistance compared to conventional stones hence are safer during huge impacts such as earthquakes and tremors,
- A wider range of construction designs can be achieved, to come up with a unique and creative design when using the eps panels,
- The longevity and durability of the eps panels are enhanced by the anti-mood and decay aspects, and,
- The high thermal insulation gives them the ability to withstand high and hot temperatures as well as maintaining the inside environments of the house cool and comfortable.
With a housing deficit of approximately 2.0 mn units according to the NHC, we expect continued adoption of the EPS technology will facilitate mass production and delivery of affordable homes in Kenya. Some EPS-built houses in Kenya include; Rongai La Casa Luxury apartments, Ndenderu Ruaka flats, Bungoma Sakata Gardens apartments and Kahawa Wendani hostels.
- Retail Sector
During the week, Game Stores, a subsidiary of South Africa’s retail company Massmart Holdings, opened its third outlet in Kenya and its first outside Nairobi, at the Kisumu Mega City Mall. Other branches of the Massmart Holdings subsidiary are located at the Garden City Mall along Thika Road, and at the Karen Waterfront. The store will be situated on the ground floor, previously occupied by Nakumatt, which has since moved to the first floor. We expect this to result in increased competition against the troubled retailer, which has continued to close down most its branches due to financial constraints brought about by poor cash flow and supply chain management. Kenya’s retail sector has continued to attract entry and expansion of several international retailers, driven by a widening middle class, provision of high-quality mall spaces in line with international standards as well as improving infrastructure within counties. Game Stores marks the third international retailer in Kenya with presence outside Nairobi County, after Shoprite in Kisumu and Mombasa and Choppies, which has stores in counties such as Kiambu, Kisumu and Kisii, which continue to be underserved in formal retail supply in comparison to Nairobi County despite the relatively high GDP per capita.
In terms of performance, compared to other urban cities, the retail sector in Kisumu has continued to record relatively high returns thus attracting investors. According to Cytonn Research, the sector recorded 0.6% points annualized increase in rental yields between 2017- 2018, attributable to 11.6% points increase in occupancy rates over the same period. The increase in occupancy rates was mainly attributed to a high urbanization rate that stands at 5.5% p.a. compared to Kenya’s average urbanization rate of 4.3% attributed to devolution which is the pull factor for growth in population in the area.
The table below shows the performance of the various urban cities:
All values in Kshs unless stated otherwise
|
Summary of Retail Market Performance in Key Urban Cities in Kenya 2018 |
||||||||
|
Region |
Average Rent 2018 per SQFT per Month |
Average Occupancy Rate 2018 |
Rental yield 2018 |
Average Rent 2017 per SQFT per Month |
Average Occupancy Rate 2017 |
Rental yield 2017 |
Change in Occupancy Y/Y |
Change in Yield Y/Y |
|
Mt Kenya |
141.3 |
84.5% |
9.9% |
136.0 |
80.0% |
9.1% |
4.5% |
0.8% |
|
Kisumu |
148.2 |
88.0% |
9.7% |
157.2 |
76.4% |
9.1% |
11.6% |
0.6% |
|
Nairobi |
178.9 |
83.7% |
9.4% |
185.0 |
80.3% |
9.6% |
3.4% |
(0.2%) |
|
Mombasa |
103.7 |
96.3% |
8.3% |
130.3 |
82.8% |
7.3% |
13.5% |
1.0% |
|
Eldoret |
137.5 |
78.5% |
7.6% |
96.0 |
83.3% |
6.6% |
(4.8%) |
1.0% |
|
Nakuru |
83.3 |
85.0% |
6.9% |
|||||
|
Average |
132.1 |
86.0% |
8.6% |
140.9 |
80.2% |
8.3% |
5.6% |
0.6% |
|
· Mt. Kenya and Kisumu were the best performing regions, with average rental yields of 9.9% and 9.7%, respectively. This is attributable to an increase in occupancy rates of on average 4.5% and 11.6% points y/y for Mt. Kenya and Kisumu regions, respectively |
||||||||
Source: Cytonn Research
Going forward, we expect to witness continued expansion of retailers into the Nairobi outskirts where there exists a growing demand for retail products supported by the growing middle class with a relatively high purchasing power. For developers, we recommend increased focus in areas such as Mt Kenya region and Kisumu, where there exists a high demand for quality retail space thus relatively high returns unlike Nairobi which has continued to record subdued performance given the existing oversupply of approximately 2.0 mn SQFT of retail space.
- Land Sector
During the week, the Nairobi City Council announced that it would cap the new land rates at 1.0% of the current value of the plots as opposed to using the 1980 valuation, where property owners pay land rates at 25.0% of the unimproved site value. The specific rates, which will be released at the end of July, will be based on the current value of undeveloped land and the new fees will be effective January 2020. Land rates are levies imposed on all parcels of land and payable to the county governments annually. Upon full payment of all rates, one is issued with the rates clearance certificate which is conclusive evidence that all rates due and interest accrued have been fully paid. In the case of rate defaulters, the county government may take measures against the property owners that may include; denial of building plan approvals and/or denial of loans by financial institutions to fund the new projects. Key to note, in Kenya, county governments charge different amounts for the land rates.
The above-mentioned review will result in higher rates in several parts of Nairobi County, where the land value has significantly appreciated, for example, in Dagoretti, where the price of an acre was Kshs 28.0 mn as at 2011 and has since grown by a 7-year CAGR of 20.2% to Kshs 100 mn in 2018/19, according to Cytonn Research. The review is thus likely to negatively impact on the real estate sector by resulting in;
- Increased burden to the real estate sector as the sector has continued to record decreased activities fuelled by a tough economic environment, in addition to the unavailability and unaffordability of financing for both off-takers and developers. The increase in land rates will thus be an additional burden to the already struggling sector,
- Increased property prices- increased land rates will result in increased liability for investors who already own land in the county. This cost is most likely to be transferred to the buyer or tenant hence increased property prices.
Despite the above, the review will have a positive impact on the county, as it will result in higher revenues from the property owners to the county government, especially from property in areas that have appreciated significantly over the years.
Other highlights during the week;
- Investment firm Centum, through its real estate arm Centum Real Estate, signed a refinancing deal with Nedbank Corporate and Investment Bank (CIB), the Nedbank property finance division. The Kshs 6.5 bn from Nedbank, will allow the firm to consolidate the debt facilities for the Two Rivers development which is currently in its second phase, which will utilize the 102 acres of land the company owns on Limuru Road in Nairobi, near the affluent neighborhoods of Runda, Nyari, Gigiri and Muthaiga. Centum Real Estate is currently the master developer in three projects namely; the Pearl Marina Development in Entebbe Uganda, Vipingo Development and Two Rivers Development, both in Kenya. The firm intends to put up 3,000 residential units across the three sites with the first phase of 1,200 units already under construction. The company highlighted that it had experienced challenges in the sector due to limited access to credit occasioned by the capping of the interest rates.
We expect the real estate sector to continue recording activities fuelled by entry and expansion of international retailers and the continued focus on the provision of affordable housing.
Following the launch of the Derivatives Market in Kenya at the Nairobi Securities Exchange (NSE) on July 11th, 2019 (see our Topical here), investors have a new investment avenue in the Kenyan market, which is expected to diversify the existing product offering. In light of this development, it is important to examine the current investment options in the Kenyan market.
This week we focus on the investment options in the Kenyan market, where we shall discuss the following:
- Overview of Investments,
- Categories of Investment Products in the Kenyan Market, and,
- Conclusion: We give considerations an investor should take into account before choosing an investment option, highlighting the returns for the different asset classes as well as the inherent risks.
After this discussion, we shall follow up with a note on financial planning, to help investors make the appropriate decision on the most suitable investment product based on the existing options, and their individual circumstances and preferences.
Section I: Overview of Investments
An investment is the purchase of an asset with the intention to generate income or having the asset appreciate, hence selling it at a profit. Investment is mainly characterized by the three following factors;
- Return – This is compensation received for making an investment. All investments are characterized by the expectation of a return. The return may be received in the form of yield, dividend, and/or capital appreciation,
- Risk – This is the chance of a loss on the principal amount of an investment, and,
- Liquidity - This is the level of ease with which an investment can be easily converted to cash without taking a significant discount in value.
Section II: Categories of Investment Products in the Kenyan Market
Kenyan investment products are mainly categorized into two categories:
-
- Traditional Investments
- Alternative Investments
- Traditional Investment Products
Traditional investments involve putting capital into well-known assets that are sometimes referred to as public-market investments. The main categories of traditional investment products include:
- Equities – Equity represents an ownership interest in a company listed at a securities exchange, in the form of either common stock or preferred stock. With common stock, the shareholder has voting rights and is entitled to dividends depending on how much profit the company makes. On the other hand, with preferred stock, shareholders have no voting rights and are entitled to dividends at a pre-determined rate, which takes precedence over common stock shareholders. An example of an investment in equities is purchasing shares in Safaricom at the Nairobi Securities Exchange (NSE) via a licensed broker.To invest in the equities market in Kenya, one would need to open a Central Depository and Settlement (CDS) account, which is an electronic account that holds your shares and bonds, and allows for the process of transferring of shares at the Securities Exchange, through a licensed stockbroker. With an investment in equities, an investor stands to gain from capital appreciation in the event the stock trades at higher prices than the purchase price, and dividends declared by the respective companies. In Kenya, the Nairobi Securities Exchange facilitates the trading of shares of 62 public companies with a market capitalization of Kshs 2.3 trillion as at 25th July 2019.
- Fixed Income Securities – These are debt securities that provide a return in the form of fixed periodic interest payments and the repayment of the principal upon maturity. The following are the types of fixed income securities:
- Treasury Bills – These are promissory notes issued and fully guaranteed by the government. They are short-term investments and can have tenors of 91, 182 or 364-days. The current rates for 91-day, 182-day or 364-day are 6.6%, 7.4% and 9.0%, respectively;
- Treasury Bonds – These are long-term debt securities issued by the government with tenors of greater than 1-year. Investors stand to gain from capital gains in the event of trading at the stock exchange dependent on the performance of the bonds, and interest payments made at regular intervals over the tenor of the bond.
To invest in government securities, one can open a CDS account either through the Central Bank of Kenya, if he/she holds a bank account with a local commercial bank, or open one with a commercial bank in Kenya, who then execute transactions on behalf of their clients. Currently, the government securities’ market has a normal shaped yield curve with the market skewed towards the longer-dated government securities with the 91-day, 5-year and 24-year government securities having yields of 6.6%, 10.2%, and 12.9%, respectively. With the normal shaped yield curve, investors expect a higher return for a longer period of investment as it carries greater risk. The graph below shows the current yields of short-term to long-term government securities in the Kenyan markets.
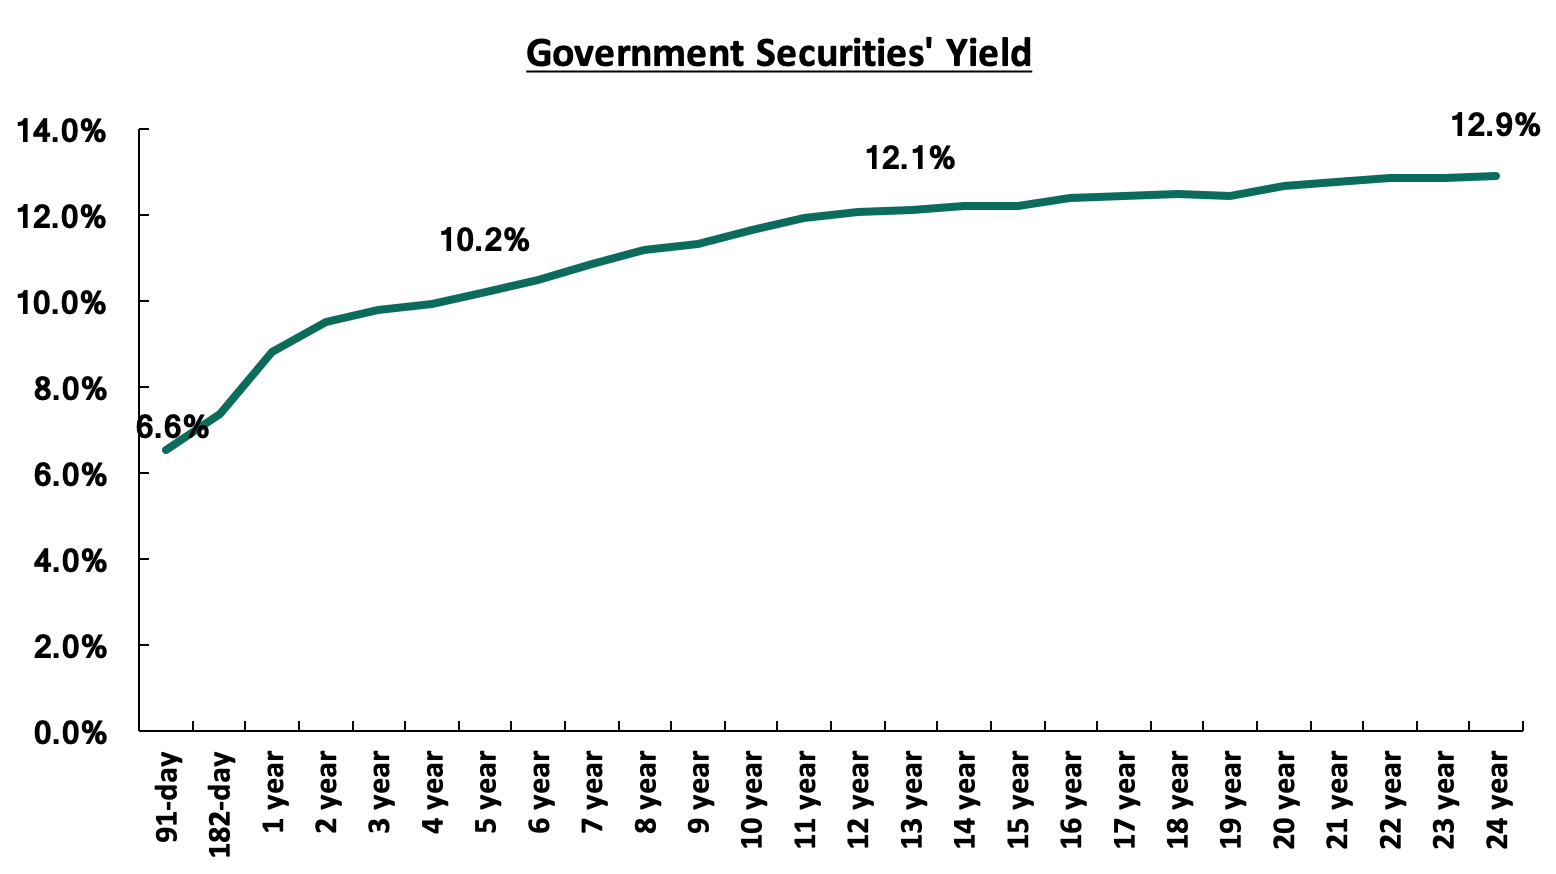
Source: Central Bank of Kenya
- Commercial Papers – These are promissory notes issued by companies as a form of raising short-term debt. These securities can be secured or unsecured and are priced at a premium to the Treasury Bills. They are short-term securities for tenors up to one year and mainly target institutional investors. Investors stand to gain from yields which are derived from the difference between the maturity value and price when issued. Commercial papers in the market currently yield from 12% to 18% p.a.;
- Corporate Bonds – These are long-term secured debt securities issued by companies with approval from the Capital Markets Authority (CMA) and are priced at a premium to Treasury Bonds. They are normally listed on an exchange. Investors stand to gain from periodic interest payment over the life of the bond. Current corporate bonds in the market are yielding from 8.5% to 10.8% per annum;
- Bank Deposits – These are deposits placed with banks or financial institutions, which could either be term deposits, which are fixed-term investments with withdrawals after a certain period lapses, or call deposits, which have no fixed deposit period, allow for unlimited withdrawals and deposits and operate like a savings account through the accrual of interest. As per our weekly Money Markets offers, 90-day bank deposits are currently at 8.8%, (based on what we have been offered by various banks);
- Debentures – These are long-term unsecured debt securities issued by companies, which are issued through private placement, and provide periodic interest payments to investors. These securities are mainly purchased by institutional investors with the holders of the debentures having a claim over general creditors. Debentures are supposed to yield higher than corporate bonds, hence around 12.8% per annum.
- Mutual Funds / Unit Trust Funds - This is a collective investment scheme that pools money together from many investors and is managed by a professional fund manager who invests the pooled funds in a portfolio of securities to achieve objectives of the trust. The funds in the mutual fund earn income in the form of dividends, interest income and/or capital gains depending on the asset class the funds are invested in. The following are the main types of mutual funds:
- Money Market Fund – This fund mainly invests in short-term debt securities with high credit quality such as bank deposits, treasury bills, and commercial paper. An example is the Cytonn Money Market Fund (CMMF);
- Equity Fund – This fund aims to offer superior returns over the medium to longer term by maximizing capital gains and dividend income through investing in listed securities;
- Fixed Income Fund – This fund invests in interest-bearing securities which include treasury bills, treasury bonds, preference shares, corporate bonds, loan stock, approved securities, notes and liquid assets consistent with the portfolio’s investment objective;
- Balanced Fund – This fund invests in a diversified spread of equities and fixed income securities with the objective to offer investors a reasonable level of current income and long-term capital growth. For more information, please read our topical on Investing in Unit Trust Funds.
At the end of 2018, the total Assets Under Management (AUM) under Unit trusts were Kshs 58.0 bn, with the top five fund managers, who control 82.4% of the total AUM highlighted below:
|
No. |
Unit Trust Fund Manager |
AUM |
% of Market Share |
|
1 |
CIC Asset Managers |
20,270.8 |
34.9% |
|
2 |
British American Asset Managers |
8,841.6 |
15.2% |
|
3 |
Old Mutual |
6,578.8 |
11.3% |
|
4 |
ICEA Lion |
6,951.9 |
12.0% |
|
5 |
Commercial Bank of Africa |
5,189.7 |
8.9% |
|
|
Total |
47,832.9 |
82.4% |
All values in Kshs millions unless stated otherwise
The leading unit trust products by AUM are money market funds, equity funds and balanced funds with Kshs 48.9 bn, Kshs 4.8 bn and Kshs 1.9 bn, respectively, in AUM and with a market share of 84.3%, 8.3%, and 3.3%, respectively. For more information, please see our press release on the Overview of the 2018 Performance by Unit Trust Fund Managers.
- Pension Funds – This is an investment fund where individuals contribute their pensions, which are invested in various asset classes as per regulation, and from which payments are made upon retirement, which could be in a lump sum or periodic payments. Pension funds can be categorized by type of returns – guaranteed funds, which offer a guaranteed minimum rate of return, and segregated funds, which offer market-based returns. Alternatively, they can be categorized by mode of contribution, where we have individual retirement benefit schemes, where individuals can contribute directly into the fund towards saving for their retirement, and umbrella retirement benefit schemes, that pool the contributions of multiple employers and their employees.
We have classified pension as a traditional product because they largely invest in traditional products such as equities and debt, but they are also allowed to allocate to alternative investments. For more information, see our note on Retirement Benefits Schemes in Kenya.
The main advantages of traditional investment products include:
- Availability of Information - Companies offering traditional investment products in the market are required by law to publish information on a regular basis with the frequency-dependent on the asset class and thus investors have an opportunity to analyze how the market is performing and make logical investment decisions;
- Standardized, well known and easy to understand structures;
- High Liquidity – Majority of the traditional investment classes have a ready market for disposal of the assets and thus can be easily converted to cash; and,
- Regulation - Traditional investment products operate under the supervision of the regulatory bodies such as the CMA and the Retirement Benefits Authority (RBA) among others, who layout procedures to follow when making a transaction or allocation of funds for the mutual funds which presents a form of safety to any investment made.
The main disadvantages of traditional investment products include:
- Lower returns relative to alternative markets – The real returns from traditional investments, when inflation is taken into account, tend to be lower than alternative investments which are less volatile;
- High Correlation of Returns – This is the relation of movement in prices of assets in the market. Traditional investment products such as equities are known to have similar movements in the market, especially when there is a movement in the large cap stocks, this affects the performance of other equities in the market; and,
- The volatility of Returns – traditional investment products such as stocks and bonds are highly sensitive to market changes such as inflation and interest changes and thus performance is pegged on the prevailing market conditions. Furthermore, when the returns are adjusted for price changes as a result of inflation, the real return may not be as high as expected.
- Alternative Investment products
Alternative investments are those that fall outside the conventional category of investments such as publicly-traded equities and fixed income securities. The clientele of this investment category is mainly institutional investors and high-net-worth individuals.
The main types of alternative investment products in the Kenyan market include:
- Private Equity - This involves buying shares that are not listed on a public exchange or buying shares of a public company with the intent to privatize them. Private equity involves the following strategies:
- Venture Capital – This is the investment of capital into a small business or start-up which has the potential of growth in the long run. This investment takes form depending on the purposes the funds are used;
- Seed capital – This is funding provided for purposes of research, evaluation and the development of a concept before the company commences operations;
- Early-stage capital – This is funding for the establishment of new companies or the development of companies which have been in operations for a short period of time; and,
- Development capital – This is funding for purposes of growth or expansion of a company;
- Buyouts – This involves financing established companies that require money to restructure and facilitate a change of ownership;
- Growth Capital – This is funding in relatively mature companies looking for capital to expand into new markets, or finance a significant acquisition, and,
- Distressed Investing – This involves investing in companies in financial distress, where the capital is used to pay the debt and restructure the company.
- Venture Capital – This is the investment of capital into a small business or start-up which has the potential of growth in the long run. This investment takes form depending on the purposes the funds are used;
The following are the exit strategies and ways in which investors can recoup their investments:
- Initial Public Offering (IPO) – This is where private companies would offer their shares to the general public. This is a form of attracting the highest possible returns for the private equity sponsors which is fully dependent on market sentiment and conditions;
- Trade sell – This is where a private equity investor opts to sell all the shares held in a company to a third party purchaser. In most cases the third party purchaser operates in the same environment and has synergies to be brought out by acquiring the target company, for which it is willing to pay a premium;
- Secondary buyout – This is where a company held by one private equity investor is sold to another private equity sponsor which may allow for an investor to have a fast exit as compared to a trade sale;
- Leveraged recapitalization – This method allows a private equity investor to extract cash from the business without selling the company which is achieved through borrowing more money from a bank or issuance of bonds; and,
The Private Equity Market in Kenya is estimated to have USD 1.3 bn (Kshs 135.1 bn) in value of reported deals according to the African Private Equity and Venture Capital Association in 2018.These investments are mainly concentrated in the consumer and technology related sectors, information and technology, financial services and the real estate sectors, which accounted for 18.0%, 15.0%, 11.0% and 10.0%, respectively, of total deal value, respectively. The largest players in the Kenyan private equity landscape are Actis Capital, Centum Investments and Catalyst Principal Partners.
- Derivatives Market – This is the purchase of a financial contract whose value is derived/reliant on the value of an underlying asset, which may be a commodity, bond, equity, interest rate, market index, currency or real estate. The main types of derivatives contracts include:
- Forward contracts– These are private agreement contracts that can be customized to a specific commodity, specific quantity of the commodity and agreed-upon delivery date at a future point in time;
- Options contract – This type of derivative gives the holder of the option contract the right but not obligation to buy/sell the underlying asset at a specified price (strike price), at a set time in the future;
- Futures contract – This is a financial contract between two parties where both partied agree to buy/sell a particular asset at a predetermined price at a specific date;
- Swaps contract – This is a financial contract where two parties agree to exchange the cash flow from two different financial instruments; and,
- Warrants – These securities entitle the holder the right to purchase a company’s stock at a specific price at a specific date.
The derivatives market was officially launched on the 11th of July 2019 on the Nairobi Securities Exchange (NSE), and currently facilitates the trading of equities index futures contract and single stock futures contracts of large-cap stock such as Safaricom, Equity Group, KCB Group, EABL and BAT Kenya. The derivatives market is expected to provide a form of hedging against volatile stock prices, higher returns, lower transaction costs and lower credit risk with the NSE Clear in place. For more information, please read our topical on Understanding the Derivatives Market;
- Real Estate– This involves the purchase of land, buildings for the purposes of income generation. The real estate market is divided into four categories which include; the residential sector, the industrial sector, the commercial and retail sector, and mixed-use developments. An investment in real estate can also be made through a Real Estate Investment Trust (REIT), which is a regulated investment vehicle that enables a collective investment in real estate, as investors pool their funds and invest in trust with the intention of earning profits or income from real estate. There are three forms of REITs which include:
- Income REITs (I-REITs) – This is a form of REIT in which investors pool resources for the purpose of acquiring long-term income-generating real estate including housing, commercial and other real estates. They are typically listed in an exchange. An example is the Fahari I-REIT;
- Development REITs (D-REITs) – This is a type of REIT in which resources are pooled together for purposes of acquiring eligible real estate for development and construction project; and,
- Islamic REITS – This is an Islamic REIT that invests primarily in income-producing Shariah-compliant real estate. Requires a fund manager to conduct a compliance test before investing in real estate to ensure it is Shariah-compliant. For more information, please read our article on Understanding Real Estate Investment Trusts.
- Structured Products – These are products that are highly customized/tailor-made investment products that are packaged by investment professionals, to enable the investor to access returns that are not accessible in the conventional market. There are publicly placed structured products, however, the majority are privately placed. Examples of privately placed structured solutions include structured notes which are backed by high yielding assets such as real estate and commercial papers such as the Cytonn High Yielding Solution (CHYS) which offers the client a return of 18%. For more information, please read our topical on Structured High Yield Investment Products.
The main advantages of alternative investment products include:
- Potential for High Returns – Alternative investments offer a potential of higher returns in comparison to traditional investment products. This is achievable as a result of consolidation where economies of scale are achieved through aggregation of client funds which are then invested, and professional fund management by experts with market knowledge and experience;
- Low Correlation of Returns – Alternative investment products often have their own value that is not dependent on factors that affect prices of traditional asset classes like stocks and bonds and thus they are able to provide an inflation hedge; and,
- Alternative Source of Funding for Businesses – Alternative investments have provided avenues for firms to raise capital with preferable terms and conditions to both parties.
The main disadvantages of alternative investment products include:
- Operating in a Less Regulated Environment - In comparison to traditional investment products, alternative investments have less stringent regulation to abide by which heightens the risk of investments made;
- Lengthy Process to Carry out a Transaction – The majority of alternative investment products are tailor-made to the clients’ expectations and thus this process would take time from initializing the deal, proceeding to conduct due diligence on the transaction to structuring the deal and finally the actual transaction takes place;
- Limited Availability of Information - The majority of alternative investments entail private transactions and thus there is little information on the details of deals carried out subject to the information released by the parties involved; and,
- Low Liquidity - Alternative investment products mainly target long-term investors and thus before the maturity of the investment, it is difficult to dispose of the investment unless there is already a willing buyer in the market for that specific product.
Section III: Our views, Expectation, and Conclusion
With the knowledge of the current investment products in the market, there are a few considerations to be considered before making an investment, which includes:
- Returns: The various asset classes are expected to generate various returns to their investors, which come as either interest income, capital appreciation, dividends or rental income. The choice of investment depends on the returns available and the preference of the investor towards generating a stream of income or capital appreciation in their portfolio;
- Investment Horizon: This is the length of time that an investor intends to hold an investment and it is dependent on the investor’s income needs and risk exposures;
- Tax Profile of the Investors: It is critical for investors to understand their tax status for tax planning purposes to avoid losses in returns.
- Risk: This is the uncertainty that the investment may not earn its expected rate of return. There are various risks which may affect the performance of investments which include but not limited to;
- Interest rate risk – This is the risk that a change in interest rates may affect the value of the investment. This form of risk is mainly associated with government securities where an increase in interest rates will cause a decrease in a bond’s price and vice versa when interest rates decline this will cause an increase in the bond’s price;
- Currency risk – This is the risk that a fluctuation in the price of one currency may affect the value of investments. This is especially of concern to foreign investors, who may experience a loss in value on their investments on conversion should the Kenyan Shilling depreciate relative to their foreign currency;
- Re-investment risk – This is the probability that an investor may be unable to reinvest cash flows at a rate comparable to the current investment’s rate of return. This risk is mostly associated with longer-dated investments due to the uncertainty of the economic conditions and the performance of the market;
- Liquidity risk – This is the risk that an individual or firm may be unable to pay its debt obligations when due, resulting in losses made by the investor; and,
- Credit risk - This is the risk that a loss may arise from a borrower’s failure to repay a loan or meet contractual obligations.
- Liquidity: This is how quickly an investment can be converted into cash. For investors who would prefer high liquidity, they may be inclined to invest in treasury bills and equities.
In summary, the following is the comparison of the various asset classes in relation to form of returns, volatility, liquidity and the suitability to the investors:
|
Asset class |
Returns |
Volatility |
Liquidity |
Suitability |
|
Equities |
Dividends Interest income |
High Volatility |
Moderate to high liquidity |
Short-term & long-term investors |
|
Fixed Income Securities |
Interest income |
Low volatility |
Moderate to High liquidity |
Short-term & long-term investors |
|
Mutual Funds |
Capital appreciation Interest Income Dividends |
Low volatility |
Moderate to High liquidity |
Short-term & Long-term investors |
|
Private Equity |
Dividends Capital appreciation |
Relatively stable |
Low liquidity |
Long-term investors |
|
Real Estate |
Rental income Capital appreciation |
Relatively stable |
Low to moderate liquidity |
Long-term investors |
|
Derivatives |
Capital Appreciation |
Relatively stable |
Moderate liquidity |
Medium to long-term investors |
|
Structured Products |
Capital appreciation Dividends Interest Income |
Low to moderate volatility |
Moderate liquidity |
Long-term investors |
|
Pension funds |
Capital appreciation Dividends Interest Income |
Low to moderate volatility |
Moderate liquidity |
Long-term investors |
The following is a summary of the performance of the various investments:
Kenya’s diverse investment product offering echoes why the market continues to be an attractive investment destination, with a number of options that are able to suit a wide and diverse range of investors. As investors take advantage of the various investment opportunities available, we advise them to seek the advice of a registered investment advisor. We shall follow up with a note on financial planning, to help investors understand how to choose from these investment options based on their individual circumstances and need.
Disclaimer: The views expressed in this publication are those of the writers where particulars are not warranted. This publication is meant for general information only and is not a warranty, representation, advice or solicitation of any nature. Readers are advised in all circumstances to seek the advice of a registered investment advisor

- Talk to us
- Kenya
- P.O Box 20695 - 00200, Nairobi, Kenya
- Cell +254709101200
- Tel +254709101200
- WhatsApp +254741676635
- United States
- +254709101200
- DOWNLOAD OUR APP
-


- Kenya
- 8th Floor, Pinetree Plaza, Kaburu Drive, Ngong Road, Nairobi, Kenya
- USA
- Suite 1150, 1775 Eye Street NW, USA, Washington DC 20006, USA
- Investments
- High Yield
- Private Equity
- Real Estate
- Real Estate
- RiverRun Estates
- Cytonn Towers
- The Ridge
- Taraji Heights
- The Alma