Cytonn H1’2019 Markets Review
By Research Team, Jun 30, 2019
Executive Summary
Global Markets Review
Global economic growth is set to slow down, with the World Bank downgrading its 2019 economic growth forecast by 0.3% points to 2.6%, from the projected 2.9% as at January 2019. This is as a result of increased policy uncertainty, a recent re-escalation of trade tensions between major economies such as US and China, and increased geopolitical tensions, such as that between the US and Iran. This has led to reduced confidence, and consequently a deceleration in global investment. The International Monetary Fund (IMF) also downgraded its 2019 growth projections by 0.2% points to 3.3%, from the estimated growth of 3.5% as at January 2019, weighed down by the weakening financial market sentiments owing to (i) the current uncertainty on the direction of trade policy between the US and China, (ii) country-specific uncertainty such as Britain’s exit (“Brexit”) from the European Union, (iii) heightened geopolitical tension between the US and Iran, disrupting the mid-stream and down-stream oil supply channel, and (iv) overall slowing global trade, which, according to World Bank, is expected to record a 2.6% growth in 2019, a 1.0% points downward revision from the 3.6% growth expected as at January 2019. The US Federal Open Market Committee (FOMC), met 4 times in H1’2019, and maintained the Federal Funds Rate at the current range of 2.25% - 2.50%, with the FOMC indicating that it would adopt a “patient” stance even in the face of a relatively slower economic growth, hinting at a possible rate cut should macroeconomic conditions worsen, a shift from earlier expectations of at least two hikes in 2019;
Sub-Saharan Africa Regional Review
GDP growth in SSA is expected to grow by 2.9% and 3.3% in 2019 and 2020, respectively, from a growth of 2.5% in 2018. This upturn is to be supported by oil exporting countries, with the demand side being supported by exports and private consumption, and the supply side being supported by a rebound in agriculture, increase in mining production, and stable growth in the services sector in some countries. Majority of the SSA stock markets recorded negative returns in H1’2019, largely attributable to political instability, general elections and economic instability in some countries such as South Sudan, Ethiopia and South Africa. Yields of a majority of African Eurobonds declined to indicate easing risk concerns over the region’s economy by investors despite specific country rating downgrades;
Kenya Macroeconomic Review
The macroeconomic environment in Kenya has remained relatively stable in the first half of 2019, supported by; (i) a stable interest rate environment, evidenced by the declining yields in government securities in the primary market, which has enabled the Kenyan Government to continue accessing cheap domestic debt, (ii) a relatively stable currency, having depreciated marginally against the US Dollar by 0.5% in H1’2019, and (iii) improved business confidence and strong private consumption as evidenced by the Stanbic Bank Monthly Purchasing Manager’s Index (PMI), which rose to 51.3 in May 2019 from 49.3 recorded in April 2019 going above 50, an indication of improving business conditions. The average inflation rate increased to an average of 5.2% in H1’2019, compared to 4.3% in H1’2018;
Fixed Income
During the first half of 2019, T-bill auctions recorded an oversubscription, with the average subscription rate coming in at 144.6% compared to 142.6% in H1’2018. Overall subscription rates for the 91, 182, and 364-day papers came in at 103.5%, 80.5% and 255.0%, with investors’ participation remaining skewed towards the longer-dated paper, attributable to the scarcity of newer short-term bonds in the primary market. Yields on T-bills declined by 50 bps, 140 bps and 90 bps in H1’2019, closing at 6.8%, 7.6%, and 9.1%, from 7.3%, 9.0%, and 10.0% for the 91, 182, and 364-day papers, respectively, at the end of 2018, mainly due to the Central Bank of Kenya’s (CBK’s) efforts to keep rates low by rejecting expensive bids in the auction market;
Equities
During H1’2019, the Kenyan equities market recorded mixed performance with NASI and NSE 25 gaining by 5.6% and 0.6%, respectively, while NSE 20 declined by 6.5%. Kenyan listed banks released their FY’2018 and Q1’2019 financial results, recording earnings growth of 13.8% and 12.2% in their core EPS in FY’2018 and Q1’2019, respectively;
Private Equity
There was increased private equity activity in the East Africa region in H1’2019. Of the sectors we cover, financial services and FinTech witnessed the most activity, with major industry players making investments both in start-up and growth-stage firms, in line with our 2019 outlook. This period also witnessed a number of fundraising deals, with most funds raising capital for the FinTech sector, supported by global institutions such as the IFC and the European Investment Bank;
Real Estate
The real estate sector has recorded subdued performance in H1’2019, with the residential, commercial office and retail sector recording average yields of 4.9%, 7.8% and 8.2%, respectively, from 5.5%, 9.3% and 9.7%, respectively, in H1’2018. The poor performance was as a result of (i) oversupply the commercial office and retail sectors with a surplus of 5.2mn SQFT and 2.0mn SQFT, respectively, as at 2018, and (ii) inaccessibility of financing by both developers and off-takers.
- Cytonn Real Estate, our development affiliate, will be handing over The Alma Phase 1 at a ceremony scheduled for 20th July 2019, the development has achieved 100% sales prior to handover;
- On Monday, 24 June 2019, Cytonn Asset Managers launched its pensions business and announced three new products under the pensions offering, these are; the Cytonn Personal Retirement Benefits Scheme, the Cytonn Umbrella Retirement Benefits Scheme and the Cytonn Income Drawdown Fund. Read the press release here;
- Cytonn Money Market Fund closed the week at an average yield of 10.9% p.a. To subscribe, just dial *809#
- Caleb Mugendi- Assistant Manager was on CNBC to discuss the Kenyan market and the NSE performance during the week. Watch Caleb here;
- Ian Kagiri- Investments Analyst was on Metropol TV to discuss the performance of Kenya's banking sector. Watch Ian here;
- Phase 1 of The Alma is now 100% sold with early buyers having achieved up to 55% capital appreciation. We are now running a promotion in Phase 2: Buy a unit in Phase 2 with a 15-year payment plan and 0% deposit. For inquiries, please email us on clientservices@cytonn.com. The site is open between 8 am - 5 pm, 7-days a week for site visits;
- In line with increasing the product offering to our clients, Cytonn Asset Managers officially launched its pensions business and in addition to managing segregated funds, it has received licenses from the Retirement Benefits Authority (RBA) to offer other products including; (i) a Personal Retirement Benefits Scheme with a monthly payment platform, (ii) an Umbrella Retirement Benefits Scheme, and (iii) an Income Drawdown Fund. For more information on the pension products, email us at pensionsales@cytonn.com;
- For an exclusive tour of Cytonn’s real estate developments, visit: Sharp Investor’s Tour and for more information, email us at sales@cytonn.com;
- Following the completion and handover of Amara Ridge in Karen, we have now launched our next Karen project, dubbed Applewood, a Kshs 2.5 bn residential development located in Miotoni, Karen. This signature development shall comprise luxury homes, each sitting on 1/2 acre. We invite you to the exhibition of Applewood which is ongoing at the Amara Ridge Clubhouse (Location pin: https://goo.gl/maps/B3GVnu8pHyn) or at the Applewood Sales Centre on Miotoni Road (Location pin: https://goo.gl/maps/ZfABuGjFo1z) from 9:00 am to 5:00 pm daily. Call 0709 101 000 or email resales@cytonn.com to reserve a villa! See Video here;
- We continue to hold weekly workshops and site visits on how to build wealth through real estate investments. The weekly workshops and site visits target both investors looking to invest in real estate directly and those interested in high yield investment products to familiarize themselves with how we support our high yields. Watch progress videos and pictures of The Alma, Amara Ridge, and The Ridge;
- We continue to see very strong interest in our weekly Private Wealth Management Training (largely covering financial planning and structured products). The training is at no cost and is open only to pre-screened participants. We also continue to see institutions and investment groups interested in the training for their teams. Cytonn Foundation, under its financial literacy pillar, runs the Wealth Management Training. If interested in our Private Wealth Management Training for your employees or investment group, please get in touch with us through wmt@cytonn.com. To view the Wealth Management Training topics, click here;
- For recent news about the company, see our news section here;
- We have 10 investment-ready projects, offering attractive development and buyer targeted returns. See further details here: Summary of Investment-Ready Projects.
Introduction
According to the World Bank, the global economy experienced a slower growth, downgrading its 2019 economic growth forecast by 0.3% points to 2.6%, from the projected 2.9% as at January 2019. This is as a result of increased policy uncertainty, a recent re-escalation of trade tensions between major economies such as US and China, and increased geopolitical tensions, such as that between the US and Iran. This has led to reduced confidence, and consequently a deceleration in global investment. The International Monetary Fund (IMF) also downgraded its 2019 growth projections by 0.2% points to 3.3%, from the estimated 2019 growth of 3.5% as at January 2019, weighed down by the weakening financial market sentiments owing to (i) the current uncertainty on the direction of trade policy between the US and China, (ii) country-specific uncertainty such as Britain’s exit (“Brexit”) from the European Union, (iii) heightened geopolitical tension between the US and Iran, disrupting the mid-stream and down-stream oil supply channel, and (iv) overall slowing global trade, which, according to World Bank, is expected to record a 2.6% growth in 2019, a 1.0% points downward revision from the 3.6% growth expected as at January 2019. Reduced consumption expenditure in major global economic regions such as Asia has also been touted as a major reason for reduced economic growth, as it has resulted in a reduction in global trade.
United States
The US economy is expected to grow by 2.5% in 2019, slower than the 2.9% growth recorded in 2018. The slower growth this year is due to the removal of the one-off tax benefits enjoyed in 2018, and the fiscal stimulus injected by the increased government spending in 2018. In Q1’2019, the US economy grew at a rate of 3.1% y/y, supported by increased local government spending, higher exports and business inventories. The slower pace of growth for the rest of the year is expected to be weighed down by reduced exports to major traditional partners such as China and the Eurozone, owing to uncertainty regarding trade between the US, China and the Eurozone. The Federal Open Monetary Committee (FOMC) held 4 meetings during H1’2019, and maintained the Federal Funds Rate at the range of 2.25% - 2.50%, citing:
- The current inflation rate of 1.8%, being in line with the government’s target of 2.0%,
- Low unemployment rate currently at 3.6%, which is below the Non-Accelerating Inflation Rate of Unemployment (NAIRU) of 4.6%. A reading of below 4.0% is considered to be close to full employment, and
- Economic activity “rising at a modest rate”, which did not require any stimulus injection in the form of a rate cut to support growth.
The stock market had been on an upward trend, with the S&P 500 gaining by 17.1% during the first half of 2019. The gain was largely supported by improved corporate earnings performance by a majority of counters in financial services, oil and gas, consumer goods and technology, largely attributed to the implemented tax reforms by the current administration, as the corporate tax rate was reduced to a uniform rate of 21.0% from the previous revenue-based tiered system that had the lowest tax rate for corporations at 25.0%. US valuations are still higher than their long-term historical average with the Shiller Cyclically Adjusted P/E (CAPE) multiple currently at 30.2x, which is 78.7% above the historical average of 16.9x.
Eurozone:
According to the World Bank, the Eurozone is expected to grow at rate of 1.2% and 1.4% in 2019 and 2020, respectively, lower than the 1.6% growth recorded in 2018. The projected 2019 growth was revised lower by 0.4% points, following dampened sentiments in major economies such as Germany, which has seen reduced private consumption, and declining industrial production, as shown by the Purchasing Managers Index (PMI) reading of 45.4 in June 2019, indicating a contraction in manufacturing activity especially in the automobiles sector, following the introduction of the revised auto-emission standards amid subdued foreign demand. Uncertainty over Britain’s exit from the European Union (“Brexit”) has also led to increased uncertainty in the Eurozone regarding its impact, and the type of exit deal to be adopted by the UK, as well as elections for the incoming Prime Minister expected on 22nd July 2019, following the resignation of Prime Minister Theresa May. Germany, France and Italy recently highlighted plans for accommodative fiscal policy, through limited tax plans and increased government spending, to boost economic performance.
The European Commercial Bank (ECB) maintained the base lending rate at 0.0%, and the rates on the marginal lending facility and deposit facility at 0.25% and (0.40%), respectively, indicating that it was unlikely to make changes to the policy rate until the end of the year, adopting an easing stance from its earlier expectations of an interest rate hike in Q3’2019. With the ECB having completed its Quantitative-Easing program, they are likely to adopt a more accommodative monetary policy through the use of Targeted Long-Term Refinancing Operations (TLTRO), which essentially involves the Central Bank issuing loans to commercial banks, for onward lending to commercial enterprises and households, so as to consequently spur economic activity and boost spending. Inflation has remained subdued, currently at 1.2%, below the 2.0% target. The bank highlighted its plan to push the inflation to close to its 2.0% target, largely through increased accommodative monetary policy.
The Stoxx 600 index rose by 13.8% in H1’2019, with the P/E ratio currently at 17.0x, 13.1% below the historical average of 19.5x, indicating markets are currently trading at relatively cheaper valuations.
China:
The World Bank projects the Chinese economy to grow by 6.2% in 2019, unchanged from the January 2019 projection, and lower than the 6.6% growth in FY’2018. The economy recorded a 6.4% growth in Q1’2019, largely aided by the subsiding of the prolonged trade dispute with the US, which culminated in a 90-day truce in January 2019, as US and China negotiated trade terms, coupled with intellectual property ownership, a major issue used by the US to instigate tariffs against China. Growth is however expected to remain subdued, owing to a resurfacing of the trade dispute with the US, which has dampened trade, and consequently affected the manufacturing sector, as shown by the decline in the official Manufacturing Purchasing Managers Index (PMI) to 49.4 in May 2019, from 50.1 in April 2019, with a reading of below 50 indicative of a contraction in manufacturing activity.
The Chinese government has adopted a more accommodative stance, with the aim of attaining the target GDP growth of “around 6.5%” by injecting liquidity in the economy by reducing the reserve requirements for banks, and resuming public investment, which should result in increased liquidity and consequently higher domestic consumption.
The Shanghai Composite has gained by 20.2% in H1’2019, supported by an abating of the trade tension in Q1’2019, coupled with increased capital injection by the government, which improved investor confidence. The gains have led to the market’s valuation rising by 1.4% above the historical average to 14.7x compared to the historical average of 14.5x.
Commodity Prices:
According to the World Bank Commodity Prices Index, energy, metals, precious metals and agriculture segments gained (declined) by 12.4%, 3.4%, 2.2% and (0.3%), respectively, in H1’2019. Below is a chart showing the performance of select commodity groups for H1’2019.
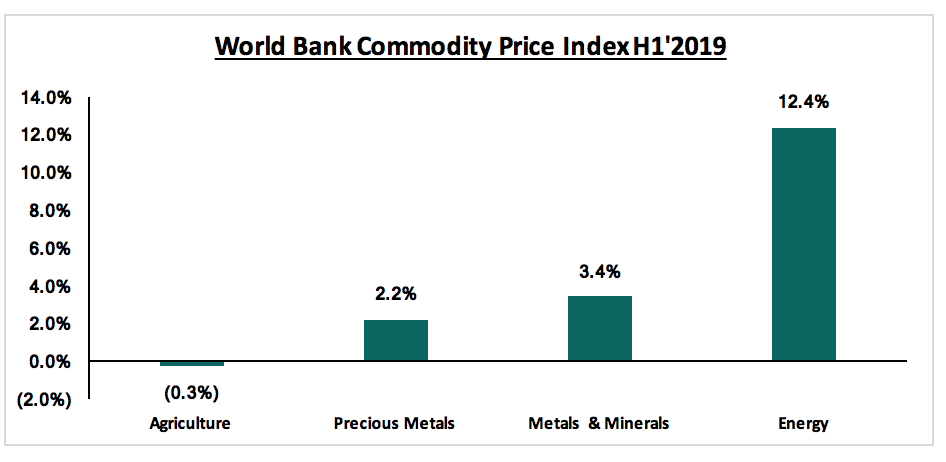
As per the chart above:
- All the highlighted commodity groups recorded increased prices with the exception of agriculture, with the gains in energy majorly driven by the recovery in crude prices, as Crude WTI and Crude Brent gained by 24.9% and 24.3%, respectively to USD 60.8 and USD 70.5 per barrel in May 2019, from USD 49.0 and USD 56.5, in December 2018.
- The decline in agriculture was largely driven by the declines in oils & meals and food, which recorded declines of 4.1% and 1.3%, respectively.
Regional Economic Growth
In April, the World Bank Group released a report titled ‘An Analysis of Issues Shaping Africa’s Economic Future’, projecting Sub-Saharan Africa (SSA) GDP to grow by 2.9% and 3.3% in 2019 and 2020, respectively, from a growth of 2.5% in 2018. This upturn is to be supported by oil exporting countries, with the demand side being supported by exports and private consumption, and the supply side being supported by a rebound in agriculture, increase in mining production, and stable growth in the services sector in some countries. Overall growth is expected to be affected by the external environment as global growth continues to decelerate and global uncertainty abounds due to trade disputes between the United States and China, SSA’s major trading partners. Consequently, the outlook on commodity prices and the oil market is highly uncertain because of expected spill-over effects, especially towards commodity-driven economies such as Angola, Liberia, Uganda, and Mozambique.
According to the International Monetary Fund SSA Regional Economic Outlook (2019), the public debt to GDP in 2018 was estimated at close to 56.0%. 16 African countries are classified as either having a high risk of debt distress or being in debt distress as illustrated in the table below:
|
No. |
Having a High Risk of Debt Distress |
No. |
Are in Debt Distress |
|
1 |
Burundi |
1 |
Republic of Congo |
|
2 |
Cameroon |
2 |
Eritrea |
|
3 |
Cape Verde |
3 |
The Gambia |
|
4 |
The Central African Republic |
4 |
Mozambique |
|
5 |
Chad |
5 |
Sao Tome and Principe |
|
6 |
Ethiopia |
6 |
South Sudan |
|
7 |
Ghana |
7 |
Zimbabwe |
|
8 |
Sierra Leone |
|
|
|
9 |
Zambia |
|
|
The report also reveals that 19 low-income and developing countries have low to moderate debt vulnerabilities, while the remaining middle and upper-income countries have sustainable public debt levels. In 2019, public debt ratios are expected to stabilize or even decline across country groupings driven by debt reductions among oil exporting countries and fiscal consolidation in non-resource-intensive countries.
Regional Currencies
Majority of select regional currencies depreciated against the US Dollar with the South African Rand and Nigerian Naira being the only gainers, while the Tanzanian Shilling remained flat. The Ghanaian Cedi was the worst performer, declining by 12.0% year to date owing to the end of the four-year bailout with the IMF and failure of foreign holders of domestic debt to roll over their maturing investments. The Kenya Shilling has depreciated against the dollar by 0.5% year to date due to a spike in dollar demand from oil and merchandise importers resulting in the depreciation of the shilling. Below is a table showing the performance of select African currencies:
|
Select Sub-Saharan Africa Currency Performance vs USD |
|||||
|
Currency |
Jun-18 |
Dec-18 |
Jun-19 |
Last 12 Months |
YTD change % |
|
South African Rand |
13.7 |
14.3 |
14.2 |
(3.2%) |
1.0% |
|
Nigerian Naira |
302.3 |
307.0 |
305.9 |
(1.2%) |
0.4% |
|
Tanzanian Shilling |
2271.0 |
2295.0 |
2295.0 |
(1.1%) |
0.0% |
|
Kenyan Shilling |
100.8 |
101.8 |
102.3 |
(1.4%) |
(0.5%) |
|
Botswana Pula |
10.4 |
10.7 |
10.6 |
(1.8%) |
(0.8%) |
|
Mauritius Rupee |
34.5 |
34.2 |
35.4 |
(2.7%) |
(3.7%) |
|
Malawian Kwacha |
713.5 |
719.8 |
761.5 |
(6.7%) |
(5.8%) |
|
Ghanaian Cedi |
4.8 |
4.8 |
5.4 |
(13.3%) |
(12.0%) |
Source: Reuters
SSA Eurobonds
The first half of 2019 was characterized by 4 Eurobond issuances by Sub- Sahara African countries, namely Egypt (USD 4.0 bn and EUR 2.0 bn), Ghana (USD 3.0 bn), Benin (USD 0.6 bn), and Kenya (USD 2.1 bn). According to Bloomberg, other issues are expected in the year from Angola (USD 2.0 bn), South Africa (USD 2.0 bn), and Ivory Coast (USD 1.0 bn).
The table below shows the performance of select Eurobonds with a tenor of 10-years in the Sub-Saharan Africa region during the H1’2019 period. In our select SSA Eurobonds, Zambia’s yield recorded an increase of 8.2% in the last 12 months amidst investor concerns over dwindling forex reserves from a high of USD 1.8 bn in June 2018 to an estimated USD 1.0 bn in June 2019.
|
Select Sub-Saharan Africa 10- Year Tenor Eurobonds Performance |
|||||
|
Country |
Jun-18 |
Dec-18 |
Jun-19 |
Last 12 Months (% points) |
YTD Change (% Points) |
|
Kenya |
5.7% |
5.9% |
5.7% |
0.0% |
(0.2%) |
|
Senegal |
6.7% |
6.9% |
4.7% |
(2.0%) |
(2.2%) |
|
Ghana |
7.7% |
9.1% |
6.5% |
(1.2) |
(2.6%) |
|
Zambia |
11.2% |
15.7% |
19.4% |
8.2% |
3.7% |
Source: Reuters
Yields on African Eurobonds declined to indicate easing risk concerns over the economy by investors despite specific country rating downgrades. Moody’s downgraded Kenya’s issuer rating to B2 from B1, assigning a stable outlook. It also downgraded Angola issuer rating to B3 (stable) from B2 due to its elevated liquidity pressures coupled with increasing external vulnerability and weaker fiscal metrics. Further, S&P and Fitch joined Moody’s in downgrading Zambia’s long-term issuer default rating to CCC (substantial risks) from B- (highly speculative) to reflect the government’s high external financing requirements, combined with a continued fall in official foreign exchange reserves, constrained access to domestic and external financing, and a further rise in government debt.
Regional Stock Markets
A few of the Sub-Saharan African stock markets recorded positive returns in H1’2019, from a tough 2018. The market in H1’2019 was characterized by the following factors;
- In Nigeria, the postponement of presidential elections in February 2019 led to market decline as most investors adopted a wait-and-see strategy in the midst of political uncertainty, and,
- In Ghana, the Ghanaian Cedi has been steadily declining against the dollar on account of capital flights by foreign investors who exited the country after the end of the 3-year bailout from IMF due to uncertainty, and rising interest rates in the U.S.
Below is a summary of the performance of key exchanges:
|
Select Sub-Saharan Africa Stock Market Performance (Dollarized) |
|||||
|
Country |
Jun-18 |
Dec-18 |
Jun-19 |
Last 12 months |
YTD change % |
|
South Africa |
0.4 |
0.4 |
0.4 |
(4.9%) |
9.6% |
|
Kenya |
604.0 |
519.0 |
433.0 |
(15.0%) |
6.5% |
|
Rwanda |
1.7 |
1.4 |
1.5 |
3.5% |
3.8% |
|
Uganda |
547.5 |
440.7 |
346.2 |
(20.4%) |
(4.4%) |
|
Nigeria |
125.4 |
102.4 |
97.3 |
(22.4%) |
(5.0%) |
|
Ghana |
0.5 |
0.5 |
0.4 |
(28.3%) |
(16.6%) |
|
Zambia |
131.5 |
131.2 |
136.2 |
(36.8%) |
(21.4%) |
NB: Please note these indices are dollarized
We are of the view that relative political stability, higher oil production (in oil exporting countries), strong agricultural production and strengthening economic reforms will improve SSA’s economic outlook. However, political uncertainty, widening fiscal and current account deficits, and rising public debt levels could continue to weigh on the economic outlook for the region.
During the first half of 2019, we tracked Kenya GDP growth projections for 2019 released by 16 organizations, that comprised of research houses, global agencies, and government organizations. The average GDP growth, including Cytonn’s 2019 growth estimate of 5.8%, came in at 5.8%, unchanged from average projections released in Q1’2019. The common view is that GDP growth will remain stable in 2019, from a growth of 6.3% in 2018, the fastest economic growth since the 8.4% recorded in 2010. Economic growth is expected to be driven by:
- Stable growth in the agriculture sector on the back of favorable weather conditions despite delayed onset of the long rains in most parts of the country,
- Implementation of the Big 4 Agenda projects by the Kenyan Government, and,
- Recovery in the business environment as evidenced by the Stanbic Bank Monthly Purchasing Manager’s Index (PMI), which rose to 51.3 in May from 49.3 recorded in April, an indication of improving business conditions.
Below is a table showing average projected GDP growth for Kenya in 2019; noteworthy being that the highest projection is by the Central Bank of Kenya at 6.3%. We shall be updating this table should projections change and shall highlight who had the most accurate projection at the end of the year.
|
Kenya 2019 Annual GDP Growth Outlook |
|||
|
No. |
|
Q1'2019 |
Q2'2019 |
|
1. |
Central Bank of Kenya |
6.3% |
6.3% |
|
2. |
Citigroup Global Markets |
6.1% |
6.1% |
|
3. |
African Development Bank (AfDB) |
6.0% |
6.0% |
|
4. |
PNB Paribas |
6.0% |
6.0% |
|
5. |
UK HSBC |
6.0% |
6.0% |
|
6. |
Euromonitor International |
5.9% |
5.9% |
|
7. |
International Monetary Fund (IMF) |
6.1% |
5.8% |
|
8. |
Cytonn Investments Management Plc |
5.8% |
5.8% |
|
9. |
FocusEconomics |
5.8% |
5.8% |
|
10. |
World Bank |
5.8% |
5.7% |
|
11. |
JPMorgan |
5.7% |
5.7% |
|
12. |
Euler Hermes |
5.7% |
5.7% |
|
13. |
Oxford Economics |
5.6% |
5.6% |
|
14. |
Standard Chartered |
5.6% |
5.6% |
|
15. |
Capital Economics |
5.5% |
5.5% |
|
16. |
Fitch Solutions |
5.2% |
5.2% |
|
|
Average |
5.8% |
5.8% |
The Kenya Shilling:
The Kenya Shilling has depreciated marginally against the US Dollar by 0.5% in H1’2019, to close at Kshs 102.3, from Kshs 101.8 at the end of December 2018, mainly driven by increased dollar demand from oil importers. This week, the Kenya Shilling depreciated marginally by 0.4% against the dollar to close at Kshs 102.3, from Kshs 101.9 the previous week, due to end-month demand from the energy and manufacturing sector exceeding dollar inflows from remittances. In our view, the shilling should remain relatively stable to the dollar in the short term, supported by:
- The narrowing of the current account deficit with data on balance of payments indicating continued narrowing to 4.5% of GDP in the 12-months to April 2019, from 5.5% recorded in April 2018. The decline has been attributed to the resilient performance of exports particularly horticulture and coffee, strong diaspora remittances, and higher receipts from tourism and transport services. Growth of imports also slowed mainly due to lower imports of food and SGR construction equipment,
- Improving diaspora remittances, which have increased cumulatively by 3.8% in May 2019 to USD 1.2 bn, from USD 1.1 bn recorded in a similar period of review in 2018. The rise is due to:
- Increased uptake of financial products by the diaspora due to financial services firms, particularly banks, targeting the diaspora, and,
- New partnerships between international money remittance providers and local commercial banks making the process more convenient,
- CBK’s supportive activities in the money market, such as repurchase agreements and selling of dollars, and,
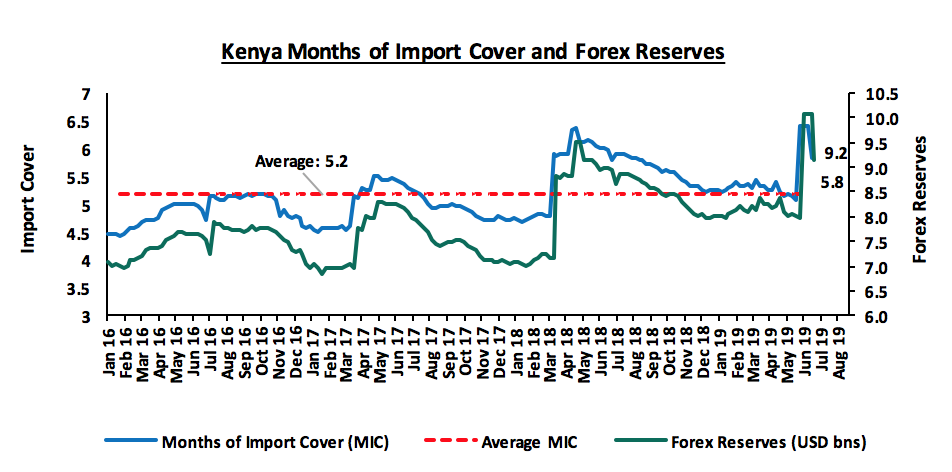
- High levels of forex reserves, currently at USD 9.2 bn (equivalent to 5.8-months of import cover), above the statutory requirement of maintaining at least 4-months of import cover, and the EAC region’s convergence criteria of 4.5-months of import cover.
 Inflation:
The average inflation rate increased to an average of 5.2% in H1’2019, as compared to 4.3% in H1’2018. June’s inflation rate rose to 5.7% from 5.5% in May. Y/Y inflation in June 2019 rose mainly due to the base effect and a rise in the transport index, which has a weight of 8.7%, with petrol prices having increased by 5.6% to Kshs 115.8 in June 2019, from Kshs 109.7 per litre in June 2018, while diesel recorded a 1.0% rise to Kshs 105.6, from Kshs 104.6 per litre in the same period. M/M inflation in June declined mainly due to a 1.6% decline in the food and non-alcoholic beverage index owing to favorable weather conditions that led to increased food production and subsequently reduced food prices for various commodities. The inflation rate in June was slightly below our expectations of between 5.8% - 6.2%, which we expected to be driven by a base effect, as well as increases in the transport index, as highlighted in our Cytonn Weekly #25/2019.
|
Broad Commodity Group |
Price change m/m (June-19/May-19) |
Price change y/y (June-19/June-18) |
Reason |
|
Food & Non-Alcoholic Beverages |
(1.6%) |
7.0% |
The m/m decline was due to favorable weather conditions, which led to lower prices for some commodities. |
|
Transport Cost |
0.3% |
11.0% |
The m/m rise was mainly on account of increase in pump prices of petrol and diesel. |
|
Housing, Water, Electricity, Gas and other Fuels |
0.1% |
4.1% |
The m/m rise was as a result of higher costs of house rents which outweighed drops the cost of electricity and cooking fuels. |
|
Overall Inflation |
(0.7%) |
1.4% |
The m/m decline was due to a 1.6% decline in the food index which has a CPI weight of 36.0% |
Monetary Policy:
The Monetary Policy Committee (MPC) met three times in H1’2019, on 28th January 2019, 27th March 2019 and 27th May 2019. In the three meetings, the MPC retained the prevailing monetary policy stance leaving the Central Bank Rate (CBR) unchanged at 9.0%, which was in line with our expectations, citing that inflation expectations remained well anchored within the target range and that the economy was operating close to its potential as evidenced by (i) inflation remained within the 2.5% - 7.5%, target during the review period, (ii) stability in the foreign exchange market and, and (iii) improving private sector credit growth, coming in at 4.9% in the 12-months to April, compared to 4.3% in the 12-months to March, with strong growth being observed in the manufacturing sector (7.9%); trade (8.4%); finance and insurance (13.3%); and consumer durables (16.4%).
As such, the MPC concluded that the current policy stance was still appropriate, but noted that there was a need to remain vigilant on possible spillovers of recent food and fuel price increases. We expect monetary policy to remain relatively stable in 2019, as the CBK monitors Kenya’s inflation rate and the currency.
Half-Year Highlights:
- The Kenya National Bureau of Statistics (KNBS) released the Economic Survey 2019 indicating that the economy had expanded by 6.3% in 2018 from 4.9% recorded in 2017. This was the fastest economic growth since the 8.4% recorded in 2010, and above the 5-year average GDP growth rate of 5.6%. The key drivers of this growth included; (i) A rebound recorded in the agriculture sector, which recorded a growth of 6.4% in 2018 from a revised growth of 1.9% in 2017, with growth mainly driven by marked improvement in crops and animal production anchored by favorable weather conditions, and (ii) Growth in the manufacturing sector was robust in 2018 recording a 4.2% growth, up from the 0.5% growth recorded in 2017. Contribution of the manufacturing sector to total GDP however declined slightly to 9.6% from 9.8% in 2017. For more information, see our Cytonn Weekly #17/2019 and our Kenya 2018 GDP Growth and Outlook Note,
- The Kenya National Bureau of Statistics (KNBS) released the Gross County Product (GCP), which includes a geographic breakdown of Kenya’s Gross Domestic Product (GDP), giving an estimate of the size and structure of county economies. According to the report, the average contribution per county to gross value added over the period 2013-2017 was approximately 2.1%, with Nairobi having the highest contribution at 21.7%, followed by Nakuru and Kiambu at 6.1% and 5.5%, respectively. Isiolo had the lowest contribution coming in at 0.2%, for the same period under review. For more information, see our Cytonn Weekly #07/2019,
- The National Treasury released the 2019/2020 fiscal year (FY) budget on 13th June 2019. According to the budget summary, total revenue collected is expected to increase by 14.2% to Kshs 2.1 tn from the Kshs 1.9 tn as per the revised FY’2018/2019 revised Budget, mainly driven by a 12.2% rise in ordinary revenue to Kshs 1.9 tn from an estimated Kshs 1.7 tn in the revised FY’2018/2019 budget. Total expenditure is set to increase by 10.1% to Kshs 2.8 tn from Kshs 2.5 tn as per the revised FY’2018/19 Budget. The fiscal deficit is projected at Kshs 607.8 bn (5.6% GDP), which will be financed through Kshs 324.3 bn in terms of external financing, domestic borrowing of Kshs 289.2 bn and other domestic receipts worth Kshs 5.7 bn. For more information see Cytonn Weekly #24/2019 and our FY 2019/20 Pre-Budget Discussion Note, and,
- Kenya issued its 3rd Eurobond, raising USD 2.1 bn (Kshs 210.0 bn) through a dual-tranche Eurobond of 7-year and 12-year tenors, value dated 15th May 2019. A longer-term issuance would have been more preferable, though it comes at a trade-off on the yields as investors would demand a higher risk premium to compensate for the risk in tandem with the repayment period of the loan. The Eurobond will be listed on the London Stock Exchange (LSE). The issue was 4.5x oversubscribed attracting orders worth USD 9.5 bn. The Eurobond was priced at 7.0% for the 7-year tenor and 8.0% for the 12-year tenor. For more information, see our Cytonn Weekly #20/2019.
Macroeconomic Indicators Table:
The table below summarizes the various macroeconomic indicators, the actual H1’2019 experience, the impact of the same, and our expectations going forward
|
Macro-Economic & Business Environment Outlook |
|||
|
Macro-Economic Indicators |
YTD 2019 Experience and Outlook Going Forward |
Outlook at the Beginning of the Year |
Current outlook |
|
Government Borrowing |
• We still maintain our expectations of KRA not achieving their revenue targets having been raised by 14.2% in the FY’2019/2020 budget to Kshs 2.1 tn from the Kshs 1.9 tn. As per the Q3’2018/2019 Budget outturn, the Kenya Revenue Authority (KRA) had only managed to raise Kshs 1.2 tn against a target of Kshs 1.3 tn representing 91.5% of the targeted revenue collection and it is doubtful that it will meet its target. This is expected to result in further borrowing from the domestic market to plug in the deficit, which coupled with heavy maturities might lead to pressure on domestic borrowing • We also remain negative due to the ballooning public debt, as well as the maturity profile of the newly acquired foreign debt as it is relatively short, which raises maturity concentration risk as the country will be in a continuous state of maturing obligations between 2024 and 2028 |
Negative |
Negative |
|
Exchange Rate |
• The Kenya Shilling is expected to remain stable against the US Dollar in the range Kshs 101.0-Kshs 104.0 against the USD in 2019, with continued support from the CBK in the short term through its sufficient reserves currently at an all-time high of USD 10.1 bn (equivalent to 6.4-months of import cover) |
Neutral |
Neutral |
|
Interest Rates |
• The interest rate environment has remained stable in 2019, with the CBR having been retained at 9.0% in the 3 MPC meetings held in 2019. With the heavy domestic maturities in 2019, we expect slight upward pressure on interest rates going forward, as the government tries to meet its domestic borrowing targets for the 2019/2020 fiscal year |
Neutral |
Neutral |
|
Inflation |
• Inflation is expected to remain within the government target range of 2.5% - 7.5%. Risks are however abound in the near-term, arising from the late onset of the traditionally long rains season which has disrupted food supply leading to a flare in food inflation, coupled with the continued rise in global fuel prices |
Positive |
Positive |
|
GDP |
• The country's Gross Domestic Product (GDP), adjusted for inflation, rebounded in 2018 having expanded by 6.3% in 2018 from 4.9% recorded in 2017. This was the fastest economic growth since the 8.4% recorded in 2010, and above the 5-year average GDP growth rate of 5.4% • GDP growth is projected to range between 5.7%-5.9% in 2019, lower than the 6.3% growth in 2018, but higher than the 5-year historical average of 5.4% |
Positive |
Positive |
|
Investor Sentiment |
• Eurobond yields have been on a declining trend YTD. An improvement was also recorded in foreign inflows in the capital market to a net buying position of USD 17.7 mn in H1’2019 from a net selling position of USD 93.4 mn in Q4’2018, an indication of improved investor sentiments • We expect improved foreign inflows from the negative position in 2018, mainly supported by long term investors who enter the market looking to take advantage of the current cheap valuations in select sections of the market |
Neutral |
Neutral |
|
Security |
• Security is expected to be upheld in 2019, given that the political climate in the country has eased. Despite the recent terror attack experienced during the first half of 2019, Kenya was spared from travel advisories, evidence of the international community’s confidence in the country’s security position. |
Positive |
Positive |
Of the 7 indicators we track, 3 are positive, 3 are neutral and 1 is negative. The outlook of the 7 indicators has remained unchanged from the beginning of the year. From this, we maintain our positive outlook on the 2019 macroeconomic environment supported by expectations for strong economic growth at between 5.7%-5.9%, a stable currency, inflation rates within the government’s target, and stable interest rates in 2019.
Money Markets, T-Bills & T-Bonds Primary Auction:
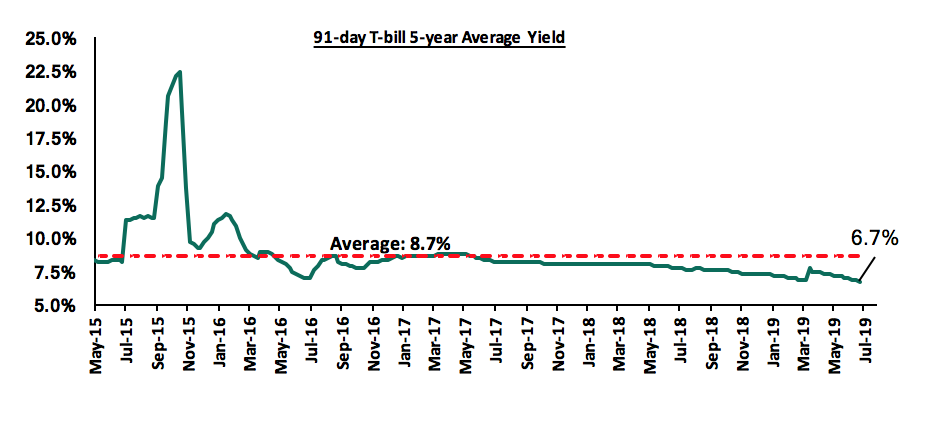
During the first half of 2019, T-bill auctions recorded an oversubscription, with the average subscription rate coming in at 144.6% compared to 142.6% in H1’2018. Overall subscription rates for the 91, 182, and 364-day papers came in at 103.5%, 80.5% and 255.0%, with investors’ participation remaining skewed towards the longer-dated paper, attributable to the scarcity of newer short-term bonds in the primary market. Yields on T-bills declined by 50 bps, 140 bps and 90 bps closing at 6.8%, 7.6%, and 9.1% in H1’2019, from 7.3%, 9.0%, and 10.0% for the 91, 182, and 364-day papers, respectively, recorded as at the end of 2018, mainly due to the Central Bank of Kenya’s (CBK’s) efforts to keep rates low by rejecting expensive bids in the auction market. During the week, T-bills were oversubscribed at a subscription rate of 249.2%, up from 236.7% recorded the previous week. Yields on the 91- day, 182-day and 364- day papers declined by 7.6 bps, 9.1 bps and 29.1 bps to 6.7%, 7.5% and 8.8%, respectively. The acceptance rate rose to 52.0% from 17.4%, recorded the previous week, with the government accepting Kshs 31.1 bn of the Kshs 59.8 bn worth of bids received.
The yield on the 91-day T-bill is currently at 6.7%, below its 5-year average of 8.7%. The lower yield on the 91- day paper is mainly attributed to the low interest rate environment we have been experiencing, and we expect this to continue in the short-term because of:
- The interest rate cap is still in place which will make it easier for the government to borrow from the domestic market, as institutions will continue channeling funds more actively towards government securities deemed less risky, since the pricing of loans to the private sector is based on the Central Bank Rate as opposed to their risk profiles, and
- The government domestic borrowing requirement for the 2019/20 financial year has been reduced by 11.7%, to Kshs 283.4 bn from Kshs 321 bn, with revenues expected to increase by 14.2% from the previous fiscal year.
 During H1’2019, the Kenyan Government had 7 Treasury Bonds primary issues, with details in the table below:
|
No. |
Date |
Bond Auctioned |
Effective Tenor to Maturity (Years) |
Coupon |
Amount to be Raised (Kshs bn) |
Actual Amount Raised (Kshs bn) |
Average Accepted Yield |
Subscription Rate |
Acceptance Rate |
|
1 |
28/1/2019 |
FXD1/2019/2 |
2.0 |
10.7% |
40.0 |
23.8 |
10.7% |
254.9% |
37.7% |
|
FXD1/2019/15 |
15.0 |
12.9% |
14.7 |
12.9% |
|||||
|
2 |
02/11/2019 |
FXD1/2019/2 (Re-open) |
2.0 |
10.7% |
12.0 |
7.5 |
10.3% |
555.0% |
35.2% |
|
FXD1/2019/15 (Re-open) |
15.0 |
12.9% |
16.0 |
12.8% |
|||||
|
3 |
25/2/2019 |
FXD1/2019/5 |
5.0 |
11.3% |
50.0 |
20.6 |
11.3% |
156.5% |
68.2% |
|
FXD1/2019/10 |
10.0 |
12.4% |
32.8 |
12.4% |
|||||
|
4 |
25/3/2019 |
IFB1/2019/25 |
25.0 |
12.2% |
50.0 |
16.3 |
12.7% |
58.8% |
55.5% |
|
5 |
15/04/2019 |
FXD2/2019/10 |
10.0 |
12.3% |
50.0 |
51.3 |
12.3% |
171.2% |
70.5% |
|
FXD1/2019/20 |
20.0 |
12.9% |
9.0 |
12.9% |
|||||
|
6 |
13/05/2019 |
FXD2/2019/5 |
5.0 |
10.9% |
50.0 |
39.2 |
10.9% |
141.7% |
82.6% |
|
FXD2/2019/15 |
15.0 |
12.7% |
19.3 |
12.7% |
|||||
|
7 |
17/06/2019 |
FXD1/2012/15 |
8.4 |
11.0% |
40.0 |
21.2 |
11.6% |
214.0% |
45.5% |
|
FXD1/2018/15 |
13.9 |
12.7% |
17.7 |
12.5% |
Performance in the Primary T-bond auctions was varied but generally remained over-subscribed averaging 221.7%, with only 1 undersubscription being recorded, attributable to favorable liquidity in the money markets. The average acceptance rate for the first half of the year came in at 56.5%, as the CBK continued to reject bids deemed expensive in order to maintain the rates at low levels.
In the money markets, 3-month bank placements ended the week at 8.8% (based on what we have been offered by various banks), 91-day T-bill at 6.7%, average of Top 10 Money Market Funds at 9.4%, with the Cytonn Money Market Fund closing the week at 10.9%.
Liquidity:
Liquidity improved during H1’2019 as indicated by a decline in the average interbank rate to 3.7% from 5.2% recorded in both H1’2018 and H2’2018, which was mainly attributable to Government payments that offset tax payments. During the week, liquidity continued to improve with the average interbank rate declining to 2.8% from 2.9% recorded the previous week. There was also a decline in the average volumes traded in the interbank market by 55.1% to Kshs 6.4 bn, from Kshs 14.3 bn, the previous week.
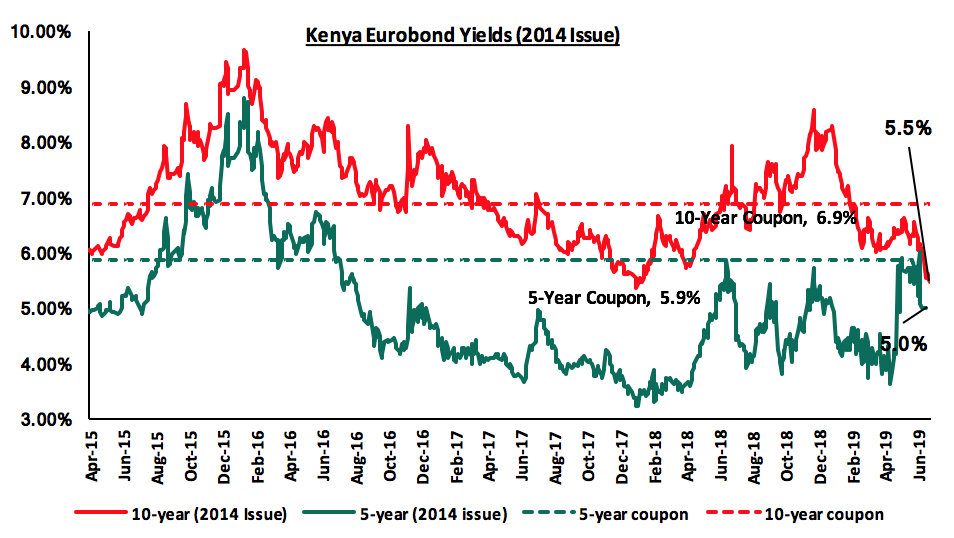
Kenya Eurobonds:
The yields on the 5-year and 10-Year Eurobonds issued in 2014 have decreased by 0.4% points and 0.5% points respectively in H1’2019. The 5-year Eurobond matured on 24th June. During the week, the yields on the 5-year Eurobond closed at 5.0%, while the 10-year Eurobond declined by 20 bps to 5.5% from 5.7%, the previous week. It is key to note that the 5-Year Eurobond matured during the week on 24th June 2019, while the 10-year Eurobond has an effective tenor of 5-years to maturity.
For the February 2018 Eurobond issue, since the issue date, yields on the 10-year Eurobond has decreased by 0.6% points while the 30-year Eurobond has decreased by 0.3% points. During the week, the yields on the 10-year Eurobond increased by 20 bps to 6.7% from 6.9% the previous week, while the yield on the 30-year Eurobond decreased by 10 bps to 7.9% from 8.0% the previous week.
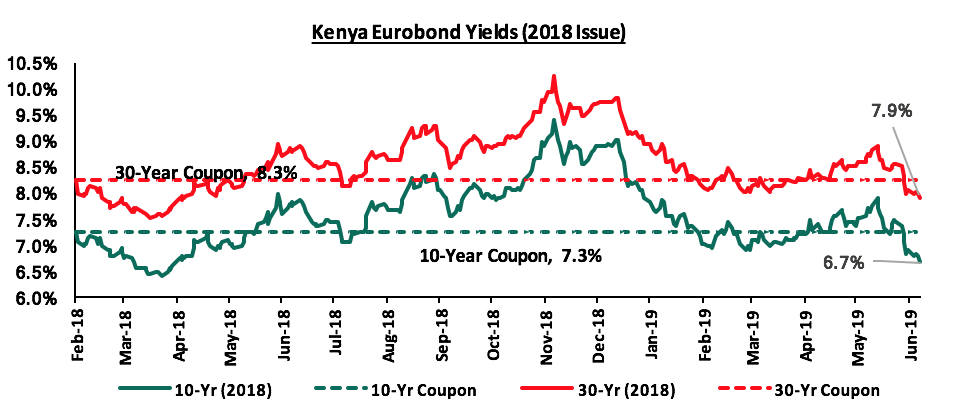
For the newly issued dual-tranche Eurobond during H1’2019, with 7-years and 12-years tenor, priced at 7.0% for the 7-year tenor and 8.0% for the 12-year tenor, respectively; the yield on the 12-year bond declined by 0.3% points to 6.3% from 6.6% recorded in the previous week, while the 12-year bond declined by 0.2% points to 7.3% from 7.5% recorded in the previous week.
Rates in the fixed income market have remained relatively stable as the government rejects expensive bids. The Government failed to meet its FY’2018/2019 domestic target narrowly by 1.3%, having borrowed Kshs 317.0 bn against a target of Kshs 321.0 bn. A budget deficit is likely to result from depressed revenue collection with the revenue target for FY’2019/2020 at Kshs 2.1 tn, creating uncertainty in the interest rate environment as additional borrowing from the domestic market goes to plug the deficit. Despite this, we do not expect upward pressure on interest rates due to increased demand for government securities, driven by improved liquidity in the market owing to the relatively high debt maturities. Our view is that investors should be biased towards medium-term fixed income instruments to reduce duration risk associated with long-term debt, coupled with the relatively flat yield curve on the long-end due to saturation of long-term bonds.
Market Performance:
The Kenyan equities market had an upward trend in the first quarter of 2019 gaining by 12.2% and declined in the second quarter of 2019 by 5.9%, bringing the half year gains for NASI and NSE 25 to 5.6% and 0.6%, respectively, and a decline for NSE 20 by 6.5%. The decline in market performance during the second quarter was as a result of declines in large cap stocks such as Co-operative Bank, NIC Group, KCB and Bamburi which gained by 19.7%, 13.6%, 13.2% and 12.9%, respectively.
During the week, the equities market was on an upward trend with NASI, NSE 25 and NSE 20 gaining by 0.7%, 0.4% and 0.1%, respectively, due to gains in large cap stocks such as NIC, Safaricom and EABL, which gained by 3.0%, 2.8% and 2.1%, respectively. For the last twelve months (LTM), NASI, NSE 25 and NSE 20 have declined by 14.9%, 19.8% and 19.3%, respectively.
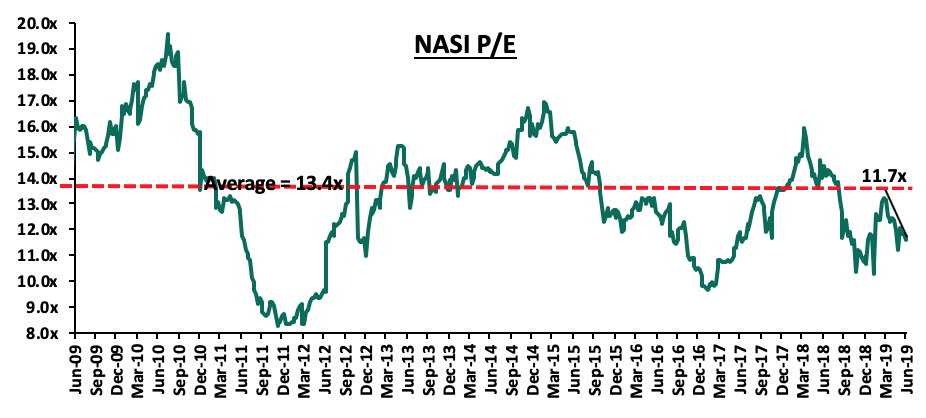
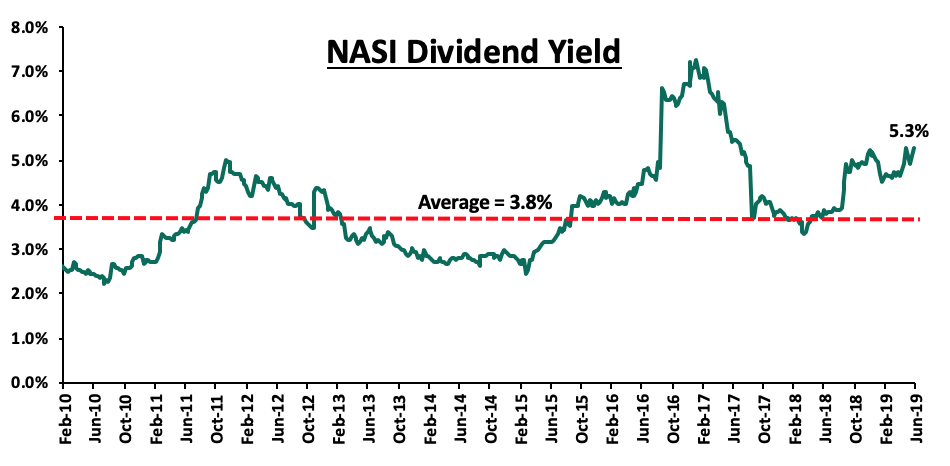
Equity turnover declined by 29.7% to Kshs 773.7 mn in H1’2019, from USD 1.1 bn in H1’2018. The market is currently trading at a price to earnings ratio (P/E) of 11.7x, 12.7% below the historical average of 13.4x. The market has a dividend yield of 5.3%, above the historical average of 3.8%.
During the first half of 2019, banks released their FY’2018 and Q1’2019 results, recording earnings growth of 13.8% and 12.2% in their core EPS in FY’2018 and Q1’2019, respectively. The growth in core EPS in FY’2018 is attributable to a 2.6% growth in Net Interest Income (NII), coupled with 3.8% growth in NFI. Non-Funded income total income proportion decline to 33.2% from 33.6% in FY’2018.
Listed Banks Q1’2019 results:
Kenyan listed banks released their Q1’2019 results, recording a 12.2% growth in core EPS compared to a growth of 14.4% in Q1’2018. The performance for Kenyan listed banks in Q1’2019 is summarized below:
|
Bank |
Core EPS growth |
Interest Income Growth |
Interest Expense Growth |
Cost of funds |
Net interest income growth |
Net Interest Margin |
Non-Funded Income Growth |
NFI to Total Operating Income |
Growth in TotaL Fees & Commissions |
Deposit Growth |
Loan Growth |
Growth in Govt Securities |
|
SCBK |
31.2% |
(6.4%) |
(28.8%) |
3.4% |
2.8% |
7.8% |
5.6% |
32.4% |
(10.0%) |
0.3% |
3.3% |
13.9% |
|
I&M |
30.5% |
8.9% |
18.2% |
5.0% |
2.1% |
6.1% |
9.7% |
38.2% |
4.0% |
28.8% |
10.6% |
8.2% |
|
Barclays |
13.8% |
7.1% |
38.8% |
3.6% |
(1.3%) |
8.7% |
14.0% |
32.2% |
11.6% |
15.9% |
9.0% |
24.0% |
|
KCB Group |
11.4% |
7.1% |
(4.1%) |
3.1% |
11.2% |
8.5% |
9.2% |
32.3% |
11.6% |
11.2% |
10.9% |
18.9% |
|
DTBK |
9.3% |
(5.1%) |
(3.0%) |
5.0% |
(6.6%) |
6.2% |
15.3% |
25.3% |
(7.4%) |
1.3% |
(2.9%) |
5.3% |
|
Equity |
4.9% |
6.5% |
7.4% |
2.6% |
6.3% |
8.6% |
6.9% |
40.8% |
3.2% |
12.1% |
12.7% |
13.0% |
|
Co-op |
4.4% |
(2.9%) |
6.2% |
3.7% |
(6.5%) |
8.7% |
19.1% |
37.7% |
33.6% |
7.4% |
(0.5%) |
33.1% |
|
NIC |
(4.3%) |
1.3% |
(7.9%) |
5.1% |
9.4% |
5.9% |
7.2% |
29.1% |
6.2% |
5.0% |
2.1% |
10.3% |
|
NBK |
N/A |
18.7% |
(17.8%) |
3.3% |
41.7% |
8.2% |
(9.2%) |
22.5% |
(10.8%) |
2.6% |
(10.2%) |
15.1% |
|
Stanbic Bank |
N/A |
12.9% |
2.2% |
3.2% |
19.3% |
4.9% |
17.7% |
49.0% |
61.5% |
29.0% |
12.6% |
(8.8%) |
|
HF |
N/A |
(16.2%) |
(8.3%) |
7.4% |
(26.7%) |
4.1% |
(8.8%) |
33.6% |
79.7% |
(5.3%) |
(13.9%) |
45.1% |
|
Q1' 2019 Weighted Average |
12.2% |
3.6% |
2.5% |
3.4% |
4.5% |
8.0% |
10.7% |
36.0% |
11.2% |
11.0% |
7.7% |
16.1% |
|
Q1' 2018 Mkt Cap Weighted Average |
14.4% |
9.3% |
11.4% |
3.6% |
8.1% |
8.1% |
9.5% |
37.1% |
12.2% |
9.4% |
6.1% |
25.0% |
Key takeaways from the table above include:
- The Listed Banks recorded a 12.2% average increase in core Earnings Per Share (EPS), compared to a growth of 14.4% in Q1’2018, with the relatively lower performance attributed to the base effect, as the sector was coming from a relatively poor performance in Q1’2017;
- Deposit growth came in at 11.0%, faster than the 9.4% growth recorded in Q1’2018. Despite the relatively fast deposit growth, interest expenses rose by 2.5% compared to 11.4% in Q1’2018 indicating that banks have been mobilizing relatively cheaper deposits;
- Average loan growth came in at 7.7%, which was faster than the 6.1% recorded in Q1’2018, indicating that there was improvement in credit extension, with banks targeting select segments such as corporate entities, and small and medium enterprises (SMEs). Government securities on the other hand recorded a growth of 16.1% y/y, which outpaced loan growth, albeit slower than the 25.0% recorded in Q1’2018. This highlights banks’ continued preference towards investing in government securities, which offer better risk-adjusted returns. Interest income increased by 3.6%, compared to a growth of 9.3% recorded in Q1’2018. The slower growth in interest income despite the increased allocations to both loans and government securities may be attributable to the decline in yields on loans owing to the 100-bps decline in the CBR, and the decline in yields on government securities, and consequently, the Net Interest Margin (NIM) declined to 8.0% from 8.1% in Q1’2018; and,
- Non-Funded Income grew by 10.7% y/y, faster than the 9.5% recorded in Q1’2018. The growth in NFI was supported by the 11.2% average increase in total fee and commission income, albeit slower than the 12.2% growth recorded in Q1’2018. The fee and commission income growth continues to be subdued by the implementation of the Effective Interest Rate (EIR) model under IFRS 9 in 2018, which requires banks to amortize the fees and commissions on loans, over the tenor of the loan. The relatively slower loan growth, a majority of which is to corporates, also inhibited the growth in fee and commission income loans, as corporates tend to be charged relatively lower commission rates.
Half-Year Highlights:
During the first half of 2019:
- Consolidation in the Banking sector has continued in the first half of 2019, with the following table summarizing the deals that have either happened or have been announced and expected to be concluded:
|
Acquirer |
Bank Acquirer |
Book value at Acquisition (Kshs bns) |
Transaction Stake |
Transaction Value (Kshs bns) |
P/Bv Multiple |
Date |
|
KCB Group |
National Bank of Kenya |
7 |
100.00% |
6.6 |
0.9x |
19-Apr* |
|
CBA Group |
Jamii Bora Bank |
3.4 |
100.00% |
1.4 |
0.4x |
19-Jan* |
|
AfricInvest Azure |
Prime Bank |
21.2 |
24.20% |
5.1 |
1.0x |
19-Jan |
|
NIC Group |
CBA Group |
30.5** |
47:53*** |
18 |
0.6x |
19-Jan* |
|
KCB Group |
Imperial Bank |
Unknown |
Undisclosed |
Undisclosed |
N/A |
18-Dec |
|
SBM Bank Kenya |
Chase Bank ltd |
Unknown |
75.00% |
Undisclosed |
N/A |
18-Aug |
|
DTBK |
Habib Bank Kenya |
2.4 |
100.00% |
1.8 |
0.8x |
17-Mar |
|
SBM Holdings |
Fidelity Commercial Bank |
1.8 |
100.00% |
2.8 |
1.6x |
16-Nov |
|
M Bank |
Oriental Commercial Bank |
1.8 |
51.00% |
1.3 |
1.4x |
16-Jun |
|
I&M Holdings |
Giro Commercial Bank |
3 |
100.00% |
5 |
1.7x |
16-Jun |
|
Mwalimu SACCO |
Equatorial Commercial Bank |
1.2 |
75.00% |
2.6 |
2.3x |
15-Mar |
|
Centum |
K-Rep Bank |
2.1 |
66.00% |
2.5 |
1.8x |
14-Jul |
|
GT Bank |
Fina Bank Group |
3.9 |
70.00% |
8.6 |
3.2x |
13-Nov |
|
Average |
|
|
78.30% |
|
1.4x |
|
|
* Announcement date ** Book Value as of the announcement date *** Shareholder swap ratio between CBA and NIC, respectively **** KCB acquired certain assets and liabilities of Imperial Bank, hence Imperial Bank remains in existence |
|
|||||
We expect more consolidation in the banking sector, as the relatively weaker banks that probably do not serve a niche become acquired by larger counterparts. For more information, see our Consolidation in Kenya’s Banking Sector Note.
- Equity Group opened a commercial representative office in Addis Ababa, Ethiopia, which is expected to commence operations in July. This is line with the bank’s strategy to expand into 10 African countries within the year, with Ethiopian market being the first phase of regional expansion drive to attain Pan African status. The venture will affirm the bank’s position as the biggest bank in Kenya by customers. Kenyan banks have been expanding their operations in neighbouring countries in search for growth, to diversify their earnings as completion intensifies in the local market, as margins remains compressed under the current interest cap regime. For more information, see our Cytonn Weekly#24/2019.
- The Central Bank of Kenya (CBK), in conjunction with five commercial banks (NIC Group, KCB Group, Diamond Trust Bank Kenya (DTBK), Co-operative Bank Kenya and Commercial Bank of Africa (CBA)), have come up with a mobile loan facility dubbed “Stawi”. The facility targeting Micro Small and Medium Enterprises (MSMEs) who don’t have access to formal credit because of their informal nature of businesses and lack of collateral. For more information, see our Cytonn Weekly #21/2019.
- The Capital Markets Authority (CMA) released The Report on the State of Corporate Governance of Issuers of Securities to the Public in Kenya. The finding suggest a “Fair” status of 55.0% weighted overall score in the application of corporate governance practices by Kenyan issuers of securities to the public. The report analysed 62 listed companies and 5 issuers of corporate bonds. For more information, see our Cytonn Weekly #12/2019.
Equities Universe of Coverage:
Below is a summary of our SSA universe of coverage:
|
Banks |
Price as at 21/06/2019 |
Price as at 28/06/2019 |
w/w change |
YTD Change |
Target Price |
Dividend Yield |
Upside/Downside |
P/TBv Multiple |
Recommendation |
|
Diamond Trust Bank |
116.0 |
117.8 |
1.5% |
(24.8%) |
228.4 |
2.2% |
99.1% |
0.6x |
Buy |
|
Zenith Bank |
20.0 |
19.8 |
(1.0%) |
(14.1%) |
33.3 |
13.6% |
80.2% |
0.9x |
Buy |
|
UBA Bank |
6.4 |
6.2 |
(3.6%) |
(19.5%) |
10.7 |
13.7% |
80.1% |
0.4x |
Buy |
|
CRDB |
120.0 |
110.0 |
(8.3%) |
(26.7%) |
207.7 |
0.0% |
73.1% |
0.4x |
Buy |
|
KCB Group |
39.0 |
38.3 |
(1.9%) |
2.1% |
60.4 |
9.2% |
64.1% |
1.0x |
Buy |
|
GCB Bank |
5.0 |
4.9 |
(1.4%) |
7.2% |
7.7 |
7.7% |
62.1% |
1.2x |
Buy |
|
I&M Holdings |
54.3 |
55.0 |
1.4% |
29.4% |
81.5 |
6.4% |
56.6% |
1.0x |
Buy |
|
CAL Bank |
0.9 |
1.0 |
7.5% |
2.0% |
1.4 |
0.0% |
50.5% |
0.8x |
Buy |
|
Co-operative Bank |
12.1 |
12.0 |
(0.8%) |
(16.1%) |
17.1 |
8.3% |
49.3% |
1.0x |
Buy |
|
Access Bank |
6.9 |
6.5 |
(5.4%) |
(4.4%) |
9.5 |
6.2% |
44.4% |
0.4x |
Buy |
|
NIC Group |
30.5 |
30.6 |
0.3% |
10.1% |
42.5 |
3.3% |
42.6% |
0.6x |
Buy |
|
Equity Group |
39.3 |
39.0 |
(0.8%) |
11.8% |
53.7 |
5.1% |
41.8% |
1.7x |
Buy |
|
Ecobank |
7.8 |
9.0 |
15.1% |
20.0% |
10.7 |
0.0% |
37.2% |
2.0x |
Buy |
|
Barclays Bank |
10.4 |
10.5 |
0.5% |
(4.6%) |
12.8 |
10.5% |
33.5% |
1.3x |
Buy |
|
Guaranty Trust Bank |
31.2 |
32.9 |
5.3% |
(4.5%) |
37.1 |
7.3% |
26.1% |
2.1x |
Buy |
|
Stanbic Bank Uganda |
30.0 |
29.0 |
(3.3%) |
(6.5%) |
36.3 |
4.0% |
24.9% |
2.1x |
Buy |
|
SBM Holdings |
5.7 |
5.6 |
(2.1%) |
(6.4%) |
6.6 |
5.4% |
20.5% |
0.8x |
Buy |
|
Stanbic Holdings |
100.0 |
99.0 |
(1.0%) |
9.1% |
113.6 |
5.9% |
19.5% |
1.1x |
Accumulate |
|
Union Bank Plc |
7.0 |
7.0 |
0.7% |
25.0% |
8.2 |
0.0% |
17.3% |
0.7x |
Accumulate |
|
Bank of Kigali |
275.0 |
290.0 |
5.5% |
(3.3%) |
299.9 |
4.8% |
13.8% |
1.6x |
Accumulate |
|
Standard Chartered |
192.0 |
194.5 |
1.3% |
0.0% |
200.6 |
6.4% |
10.9% |
1.4x |
Accumulate |
|
Bank of Baroda |
129.0 |
128.7 |
(0.2%) |
(8.1%) |
130.6 |
1.9% |
3.2% |
1.1x |
Lighten |
|
FBN Holdings |
7.0 |
6.6 |
(5.9%) |
(17.6%) |
6.6 |
3.8% |
(0.9%) |
0.4x |
Sell |
|
National Bank |
4.0 |
4.1 |
3.5% |
(22.2%) |
3.9 |
0.0% |
(1.4%) |
0.2x |
Sell |
|
Standard Chartered |
20.5 |
19.0 |
(7.2%) |
(9.4%) |
19.5 |
0.0% |
(5.1%) |
2.4x |
Sell |
|
Stanbic IBTC Holdings |
39.9 |
40.3 |
0.9% |
(16.1%) |
37.0 |
1.5% |
(5.8%) |
2.1x |
Sell |
|
Ecobank Transnational |
11.4 |
11.0 |
(3.1%) |
(35.3%) |
9.3 |
0.0% |
(18.2%) |
0.4x |
Sell |
|
HF Group |
4.3 |
4.0 |
(5.6%) |
(27.6%) |
2.9 |
0.0% |
(31.8%) |
0.2x |
Sell |
*Target price is adjusted for Dividend Yield
**Upside/(Downside) is adjusted for Dividend yield
***Banks in which Cytonn and/or its affiliates are invested in
****Share prices in respective country local currency
We are “Positive” on equities for investors as the sustained price declines has seen the market P/E decline to below its historical average. We expect increased market activity, and possible increased inflows from foreign investors, as they take advantage of the attractive valuations to support the positive performance.
Financial Services Sector:
Some of the notable deals in the Financial Services sector in H1’2019 include;
- Private Equity firms AfricInvest, based in Tunisia, and Catalyst Principal Partners, based in Kenya, acquired a minority stake in Prime Bank Kenya. The stake acquired was 24.2% of Prime Bank Kenya, through a capital injection of Kshs 5.1 bn, with the capital targeted to carry out strategic plans including expanding locally and into the region. As at Prime Bank’s last reporting in Q3’2018, the bank had a book value of Kshs 21.2 bn, and as such, the transaction was carried out at a price-to-book value (P/Bv) of 1.0x, which is a 33.3% discount to the market’s current trading valuation of 1.5x P/Bv for listed Kenyan banks. This was the first bank acquisition in 2019, and in line with our expectation of consolidation in the Kenya banking sector following the enactment of the Banking (Amendment) Act, 2015 and the fact that Kenya is overbanked, as highlighted in our Q3’2018 Banking Sector Report. For more information, see our Prime Bank Kenya Acquisition Note,
- AfricInvest, an investment and financial services firm based in Tunisia, announced a further investment of Kshs 273.0 mn in insurance group Britam, acquiring an extra Kshs 32.5 mn shares at Kshs 8.4 per share, a stake of 3.3%. For more information, see our Cytonn Weekly #23/2019,
- Sanlam Group, a South African financial services firm, sold an undisclosed amount of its stake in Sanlam Investments East Africa (SIEA), an asset management firm based in Kenya, for ZAR 101.0 mn (Kshs 730.0 mn) to an undisclosed party. Sanlam Investments East Africa currently manages an asset portfolio of over Kshs 200.0 bn, with a Money Market Fund size of Kshs 1.7 bn as at 31st December 2018, ranking it as the 5th largest asset manager in Kenya in terms of assets under management for Money Market Funds. For more information, see our Cytonn Weekly #15/2019, and
- Mauritius based Bank One, in which Kenyan banking group I&M Holdings has a 50.0% stake, is set to receive a USD 37.5 mn (Kshs 3.8 bn) loan from the International Finance Corporation (IFC), with an undisclosed tenor. The loan will be classified as senior debt, therefore ranking higher than other Bank One’s obligations. For more information, see our Cytonn Weekly #20/2019.
We expect that investors will continue to show interest in the financial services sector, motivated by attractive valuations especially in the banking sub-sector, growth of financial inclusion and regulation that requires institutions to increase their capital requirements across the sector consequently providing an opportunity for mergers and acquisitions.
FinTech Sector:
Some of the notable deals in the FinTech sector in H1’2019 are;
- Kenya’s second and third largest telecommunication companies, Airtel and Telkom, announced the signing of a binding agreement that will see the shareholders of the two companies merge their respective mobile, enterprise, and carrier services businesses in Kenya to operate under a joint venture company. We expect this merger to have the following effects on the Kenyan telecommunication space: (i) Subscriptions / Voice Market Share is expected to be split between two major players with the merged entity set to increase its share, (ii) The combined entity will command a market share of 29.6%, (iii) Airtel will make an entry into the fixed data services market, and (iv) Mobile Money is least likely to be affected given that neither of the two merging entities have a significant share in the market. The overall effect to the market is that we will now have a company that has scale to provide a credible market alternative to the currently dominant Safaricom. For more information, see our Cytonn Weekly #06/2019,
- Branch International, a San Francisco-based mobile lender, with operations in Nigeria, Kenya, and Tanzania, raised USD 170.0 mn (Kshs 17.2 bn) in a 3rd round fundraising deal, led by Foundation Capital and Visa. The capital comprises USD 100.0 mn (Kshs 10.1 bn) debt financing and USD 70.0 mn (Kshs 7.1 bn) in equity for an undisclosed stake. The funds raised will be used for international expansion to South America and Asia. For more information, see our Cytonn Weekly #15/2019, and
- Kudi, a Nigeria based Financial Technology (FinTech) company focused on digital payments and collections raised USD 5.0 mn (Kshs 503.6 mn) in Series A funding. The funding will be used to add to the Kudi team, grow its network of agents across Nigeria, and launch other financial services offerings in partnership with banks and other FinTech companies. Kudi has raised a total of USD 6.7 mn, having raised USD 1.7 mn in seed capital. For more information, see our Cytonn Weekly #14/2019.
The growing interest in FinTech sector is driven by Africa’s low penetration rates for traditional banking services at 25% according to the Global Findex database and high mobile penetration at 44% according to the Global System for Mobile Communications (GSMA) 2017 Report. We expect that investors will continue to show interest in the FinTech sector in Sub-Saharan Africa as more businesses seek to enhance efficiency and reduce costs by incorporating technology in their operations. Furthermore, the significant difference in credit extension activity in Africa compared to other regions gives FinTech lending firms a perfect opportunity to provide credit via convenient and already established channels.
Education Sector:
Deals in the Education sector in H1’2019 include;
- GEMS Education announced its plan to acquire 100.0% stake of Hillcrest International Schools from its current owners, Fanisi Capital and businessman Anthony Wahome, for Kshs 2.6 bn. Currently, Fanisi owns a 55.0% stake in the school, while Mr. Wahome owns 45.0% following an acquisition from Barclays Bank of Kenya, the family of Kenneth Matiba and other creditors in 2011, for a total of Kshs 1.8 bn. For more information, see our Cytonn Monthly – January 2019, and
- The Competition Authority of Kenya (CAK) approved the proposed acquisition of a 22.3% stake in Kenya based Riara Group of Schools by Actus Education Holdings AB, a private school chain based in Sweden, for an undisclosed amount. For more information, see our Cytonn Monthly April 2019.
We expect that investors will continue to show interest in the Education sector in Sub-Saharan Africa mainly as a result of the (i) increasing demand for quality and affordable education, and (ii) Government support, such as ease of approvals, offered to investors in the education sector as governments look to achieve Sustainable Development Goals (SDGs) targets of universal access to tertiary education.
Hospitality Sector:
- Inside Capital Partners, a Mauritian independent private equity manager announced a commitment to invest USD 7.5 mn (Kshs 756.1 mn) in Latitude Hotels Group, an African lifestyle hospitality Group based in Zambia, for an undisclosed stake. Latitude Group currently runs 3 hotels in Zambia, Malawi and Uganda. The hospitality group will use the funds to develop three additional hotels in Kenya, Ethiopia and Mauritius by 2021. The fund manager, who is currently proceeding with a second round of fundraising targeted to raise USD 60.0 mn (Kshs 6.0 bn), is expected to make further investments in the hospitality sector targeting entities with an underlying strong net asset value, above market occupancy levels and a strong development pipeline. For more information, see our Cytonn Weekly #08/2019.
We expect that investors will continue to show interest in the Hospitality sector in Sub-Saharan Africa mainly as a result of (i) high economic growth, which is projected to improve in Africa’s most developed PE markets, (ii) attractive valuations in Sub-Saharan Africa’s private markets compared to its public markets, and (iii) attractive valuations in Sub-Saharan Africa’s markets compared to global markets.
Fundraising
- The European Investment Bank announced a EUR 25.0 mn investment in the Amethis Fund II, the second pan-African investment vehicle of Amethis, an investment fund manager dedicated to long-term responsible investments in Africa. Amethis Fund II follows the same investment strategy as Amethis Fund I by providing growth capital to African mid-cap champions, through investments with an average ticket size of EUR 10.0 mn-EUR 30.0 mn or more through co-investment. Other investors in the fund include the International Finance Corporation (IFC) and Proparco, and Bpifrance, the French public investment bank. For more information, see our Cytonn Weekly #14/2019,
- Leapfrog Investments, an emerging markets-focused private equity firm, announced the close of its third Impact Fund (Fund III) at USD 700.0 mn (Kshs 70.0 bn), surpassing its USD 600.0 mn (Kshs 60.0 bn) target by 16.7%, with the funds being used to invest in healthcare and financial services companies in Asia and Africa. This close brings the total capital raised by the investment firm so far to USD 1.6 bn (Kshs 160.0 bn), with its first fund having closed at USD 135 mn (Kshs 13.5 bn) in 2010 and the second fund closing at USD 400 mn (Kshs 40.0 bn) in 2014. Fund III was led by US-based Prudential Financial and other institutional investors in participation including, pensions and asset managers, development financiers, foundations and family offices. For more information, see our Cytonn Weekly #20/2019,
- International Finance Corporation (IFC) announced plans to invest USD 50.0 mn (Kshs 5.1 bn) in private equity firm, Helios Investment Partners, through Helios’s fourth fund, Helios Investors IV L.P., which is set to close in September 2019. The funds are to be directed towards Helios’s investments across Africa. Each transaction is estimated to have a ticket size ranging between USD 30.0 mn (Kshs 3.0 bn) and USD 200.0 mn (Kshs 20.2 bn). This investment by IFC forms part of the USD 1.25 bn (Kshs 126.3 bn) that Helios is looking to raise in its fourth fund. For more information, see our Cytonn Weekly #19/2019,
- Nimai Capital, a Dubai-based financial institution that supports financial inclusion in South Asia and Africa, announced the launch of a USD 150.0 mn (Kshs 15.2 bn) Nimai Emerging Financial Services Fund (NESF) in partnership with Victoria Commercial Bank (VCB), a mid-sized Kenyan financial institution that serves premier corporate clientele. The fund aims to invest in financial services in African and South Asian countries such as Ghana, Tanzania, Kenya, Bangladesh, Sri Lanka, Nepal and India, and will be regulated by the Cayman Islands Monetary Authority. For more information, see our Cytonn Weekly #17/2019,
- Partech Ventures, a global investment platform for tech and digital firms released a report on capital raising activity for African Tech Start-ups in 2018. According to the report, funding raised by a total of 146 African tech-startups grew by 108.0% to USD 1.2 bn in 2018 from USD 560.0 mn in 2017 driven by an increased number of series A & B startups attracting funding and increased appetite of global private equity investors to invest in African tech start-ups. For more information, see our Cytonn Weekly #17/2019, and
- Kasada Capital Management, a Sub-Saharan hospitality investment platform, reached a close on its first fund, Kasada Hospitality Fund LP, having secured equity commitments of over USD 500.0 mn (Kshs 50.6 bn), with the commitments being raised from Katara Hospitality, a hotel developer based in Qatar, and Accor Group, a French-based hospitality operator, who invested USD 350.0 mn (Kshs 35.4 bn) and USD 150.0 mn (Kshs 15.2 bn), respectively. For more information, see our Cytonn Weekly #21/2019.
Reports:
- African Private Equity and Venture Capital Association (AVCA) released five reports in H1’2019. The reports are;
- The 2018 Annual African Private Equity (PE) Data Tracker, which indicated that the total value of African PE fundraising increased by 12.5% to USD 2.7 bn (Kshs 272.2 bn) in 2018 from USD 2.4 bn (Kshs 241.9 bn) in 2017. This was an indication of a positive shift in investors’ confidence in Africa’s PE industry following declines in 2016 and 2017, after a peak in 2015, which saw a handful of large funds achieving final closes during the year. For more information, see our Cytonn Weekly #11/2019,
- The 2018 Annual Limited Partner (LP) Survey, which was a study that analyses the plans, views, preferences, expectations and evolving attitudes of 60 Limited Partners (LPs) from Africa, Asia, Europe and North America regarding Private Equity (PE) in Africa. According to the report, LPs’ appetite for African PE has remained steady, with 53.0% of LPs planning to increase their PE allocation on the continent over the next three-years and Nigeria being viewed by majority of LPs as the most attractive country for PE investment in Africa over the next three-years with a popularity index ranking of 58.0%, followed by Kenya (40.0%) and Egypt (31.0%). For more information, see our Cytonn Weekly #06/2019,
- The 2019 Profile of Africa’s Institutional Investors, which mapped the different pools of capital for African private equity and provided an overview of the demographics of institutional investors with allocations to Africa. According to the report, majority of the institutions are European based with 36.0% having their head offices in Europe while North American based institutions came second at 32.0% of the total. For more information, see our Cytonn Weekly #06/2019,
- The Private Credit Strategies in Africa Report that provided an overview of some of the key opportunities and challenges facing the private credit industry in Africa. According to the report, a major driver of the increasing interest in private credit in Africa relates to the difficulties that small and medium-sized enterprises (SMEs) in Africa often face in accessing financing through traditional avenues, such as banks. For more information, see our Cytonn Monthly – February 2019, and
- Country Snapshot – Kenya, which highlighted the various developments in the private equity sector in Kenya between 2013 and 2018. According to AVCA, there were 110 reported deals during this period, translating to 57.8% of the total 190 deals reported in the 7 Eastern African countries. This was way ahead of Uganda, which was the country with the second largest share of PE deals by volume, at 18.9%, and the third, Tanzania, at 8.9% of total deals. In terms of value, Kenya ranked first, with a total deal value of USD 1.3 bn (Kshs 131.7 bn), followed by Ethiopia and Uganda, which both had an estimated share of 11% of total deals by value, translating to roughly USD 242.3 mn (Kshs 24.5 bn) of value of PE deals within the 6-year period. For more information, see our Cytonn Weekly #16/2019.
- The Competition Authority of Kenya (CAK) released their 2018 Annual Report, which highlighted the number of mergers that the Authority handled. The Authority handled 150 merger notifications in 2018, a 15.4% increase from 130 merger notifications handled in 2017. The merger notifications were mainly from the following sectors; manufacturing, real estate, distribution, investment, services, advertising and agriculture. For more information, see our Cytonn Weekly #07/2019.
- I&M Burbidge, the Corporate finance advisory of I&M Bank Limited, in their report, East Africa Financial Review, highlighted the deal activity in the East African region, for Q1’2019. According to the report, there were a total of 22 deals in this period, with 10 of these being private equity investments, 3 private equity exits, 2 joint ventures and 7 mergers and acquisitions. For more information, see our Cytonn Weekly #19/2019.
Private equity investments in Africa remain robust as evidenced by the increasing investor interest, which is attributed to; (i) rapid urbanization, a resilient and adapting middle class and increased consumerism, (ii) the attractive valuations in Sub Saharan Africa’s private markets compared to its public markets, (iii) the attractive valuations in Sub Saharan Africa’s markets compared to global markets, and (iv) better economic projections in Sub Sahara Africa compared to global markets. We remain bullish on PE as an asset class in Sub-Sahara Africa. Going forward, the increasing investor interest and stable macro-economic environment will continue to boost deal flow into African markets.
In H1’2019, the real estate sector continued to record increased activity supported by; (i) the positioning of Nairobi as a regional hub, (ii) continued National Government support for the affordable housing initiative, (ii) expansion by multinational corporations and retailers into the country, and (iii) the improving macroeconomic environment, with the country’s GDP growing by 6.3% in 2018, 1.4% points higher than the 4.9% recorded in 2017. The key challenges that continue to face developers and end users include (i) oversupply the commercial office and retail sectors with a surplus of 5.2mn SQFT and 2.0mn SQFT, respectively, as at 2018, and (ii) lack of access to financing and high financing cost for both developers and off-takers following the capping of interest rates.
In this report, we have reviewed notable activities and the performance of the residential, commercial, hospitality, land, infrastructure, and listed real estate sectors during the quarter.
- Residential Sector
In H1’2019, we continued to witness an increase in investor interest in the residential sector in Kenya. The most notable projects launched during the period were; (i) the United Nations’ Habitat Housing Cooperative Society Limited 8,888-units joint venture project with Singapore-based consortium Afra Holdings, to be located in Mavoko, (ii) Actis Garden City Apartments along Thika road, (iii) Cytonn’s Applewood in Karen, and (iv) Deltar’s project to be located in Batu Batu Gardens, Parklands.
On the affordable housing front, major highlights during the period were:
- The 2019/2020 National Budget allocation towards affordable housing initiative was raised by 61.5% to Kshs 10.5 bn, from Kshs 6.5 bn in the previous 2018/2019 budget, indicating continued government support towards the actualization of the affordable housing initiative,
- The National Treasury launched the Kenya Mortgage Refinancing Company (KMRC) after a successful mobilization of capital from key shareholders and international financial institutions. For more analysis, read our KMRC Topical,
- Leading mortgage financier in Kenya, Housing Finance (HF) announced plans to reduce its current average mortgage size by 50.0% in a bid to tap into the growing demand for home loans from the lower mid-income class,
- The Government of Kenya announced the relaxation of affordable housing regulations to include high income-earners of Kshs 100,000 and above, and
- The Kenyan Government launched the bomayangu.go.ke portal to allow citizens to register and apply for affordable housing units online.
Market Performance
Overall, apartments performed better in H1’2019 with average total returns of 5.5%, 5.5%, and 6.3% for the upper mid-end, lower mid-end suburbs, and satellite towns, respectively, in comparison to detached units at 3.8%, 4.5%, and 4.1%, for high-end, upper mid-end, and satellite towns, respectively. Apartments also recorded higher annual uptake of 22.4%, compared to 19.7% for detached units. This is as apartments have a wider market due to their relative affordability to homebuyers, which also sustains their price growth.
- Detached Units
High-End
The high-end market recorded a marginal price appreciation of 0.1%, from an average of Kshs 199,625 per SQM in H1’2018 to Kshs 201,275 per SQM in H1’2019, with select markets namely, Rosslyn and Kitisuru, recording depreciation of 2.6% and 0.4%, respectively. This is mainly as a result of the decline in asking prices, as areas like Kitisuru and Rosslyn reach their price ceilings, amidst a tough financial environment, which has led to a decline in effective demand.
(All Returns Are Annualized)
(All Values in Kshs Unless Stated Otherwise)
|
Detached Units Performance H1'2019 – Top 5: High-End |
|||||||
|
Area |
Price per SQM H1'2019 |
Rent per SQM H1'2019 |
Annual Uptake H1'2019 |
Occupancy H1'2019 |
Rental Yield H1'2019 |
Annual Price Appreciation H1'2019 |
Total Returns H1'2019 |
|
Runda |
234,697 |
888 |
17.8% |
83.8% |
4.0% |
1.8% |
5.8% |
|
Karen |
205,087 |
659 |
20.0% |
76.6% |
3.0% |
1.8% |
4.8% |
|
Kitisuru |
223,310 |
903 |
19.4% |
83.3% |
3.7% |
(0.4%) |
3.3% |
|
Lower Kabete |
165,043 |
467 |
16.3% |
89.5% |
3.3% |
0.0% |
3.3% |
|
Rosslyn |
178,237 |
757 |
19.1% |
84.3% |
4.3% |
(2.6%) |
1.7% |
|
Average |
201,275 |
735 |
18.5% |
83.5% |
3.7% |
0.1% |
3.8% |
|
|||||||
Source: Cytonn Research 2019
Upper Mid-End
The upper mid-end segment recorded the highest total annual uptake and returns in the detached units sector at 20.3% and 4.5%, respectively. This is due to areas such as Runda Mumwe and Loresho, which posted the highest average returns in the upper mid-market of 6.2% and 5.8%, respectively, attributable to their proximity to neighborhoods such as Runda for Runda Mumwe, and Lower Kabete and Kitisuru for Loresho, which make them appealing to the mid-income earners seeking exclusivity but in relatively affordable areas.
All Values in Kshs Unless Stated Otherwise)
|
Detached Units Performance H1'2019 – Top 5: Upper Mid-End |
||||||||
|
Area |
Price per SQM H1'2019 |
Rent per SQM H1'2019 |
Annual Uptake H1'2019 |
Occupancy H1’ 2019 |
Rental Yield H1'2019 |
Annual Price Appreciation H1'2019 |
Total Returns H1’2019 |
|
|
Loresho |
146,540 |
575 |
17.5% |
94.6% |
4.5% |
1.7% |
6.2% |
|
|
Runda Mumwe |
158,932 |
662 |
26.1% |
83.6% |
4.3% |
1.5% |
5.8% |
|
|
South C |
120,928 |
494 |
23.8% |
92.5% |
4.6% |
(0.7%) |
3.8% |
|
|
Redhill |
105,218 |
367 |
21.1% |
77.5% |
3.3% |
0.3% |
3.6% |
|
|
Langata |
142,183 |
556 |
13.0% |
97.2% |
4.7% |
(1.7%) |
3.0% |
|
|
Average |
134,760 |
531 |
20.3% |
89.1% |
4.3% |
0.2% |
4.5% |
|
|
||||||||
Source: Cytonn Research 2019
Satellite Towns
Ruiru and Athi River Towns were the best performing satellite towns in H1’2019 with average returns to investors of 6.0% and 5.0%, respectively. This is attributable to the presence of good infrastructure such as the Eastern Bypass and Thika Superhighway for Ruiru, with relatively low land prices (see below our land sector performance summary) for development enabling their affordability to the majority of home seekers.
(All Values in Kshs Unless Stated Otherwise)
|
Detached Units Performance H1'2019 – Top 5: Satellite Towns |
|||||||
|
Area |
Price per SQM H1'2019 |
Rent per SQM H1'2019 |
Annual Uptake H1'2019 |
Occupancy H1’2019 |
Rental Yield H1'2019 |
Annual Price Appreciation H1'2019 |
Total Returns H1’2019 |
|
Ruiru |
99,064 |
353 |
17.1% |
79.6% |
5.1% |
0.9% |
6.0% |
|
Athi River |
92,054 |
406 |
19.3% |
79.6% |
4.5% |
0.6% |
5.0% |
|
Ngong |
64,843 |
238 |
19.4% |
72.8% |
3.2% |
1.6% |
4.8% |
|
Kitengela |
73,919 |
446 |
17.7% |
66.1% |
3.1% |
1.2% |
4.3% |
|
Juja |
73,182 |
260 |
16.6% |
61.9% |
2.7% |
(2.1%) |
0.7% |
|
Average |
80,612 |
341 |
18.0% |
72.0% |
3.7% |
0.4% |
4.1% |
|
|||||||
Source: Cytonn Research 2019
- Apartments
Upper Mid-End
The upper mid-end sector posted relatively high annual uptake of 25.1% on average, owing to demand from real estate investors seeking to tap into the upper mid-end rental sector to support demand from long-stay foreigners seeking highly accessible areas with plenty of amenities. This is evidenced by the growing trend of serviced and furnished apartments in areas like Kilimani and Riverside, which attract relatively high rental rates.
(All Values in Kshs Unless Stated Otherwise)
|
Apartments Performance H1'2019 – Top 5: Upper Mid-End |
|||||||
|
Area |
Price per SQM H1'2019 |
Rent per SQM H1'2019 |
Annual Uptake H1'2019 |
Occupancy H1'2019 |
Annual Price Appreciation H1'2019 |
Rental Yield H1'2019 |
Total Returns H1’2019 |
|
Riverside |
135,813 |
737 |
22.9% |
76.2% |
0.9% |
5.1% |
5.9% |
|
Loresho |
113,122 |
479 |
20.9% |
95.4% |
1.4% |
4.3% |
5.7% |
|
Kilimani |
121,845 |
852 |
30.4% |
76.8% |
0.0% |
5.6% |
5.5% |
|
Westlands |
145,744 |
665 |
28.0% |
80.4% |
0.2% |
5.3% |
5.4% |
|
Parklands |
123,146 |
744 |
23.3% |
85.7% |
-0.3% |
5.1% |
4.8% |
|
Average |
127,934 |
695 |
25.1% |
82.9% |
0.4% |
5.0% |
5.5% |
|
|||||||
Source: Cytonn Research 2019
Lower Mid End
The lower mid-end suburbs posted average returns of 5.5% with a positive marginal price appreciation rate of 0.6%. The performance has been sustained by demand for affordable units particularly from the constant urbanization and the growing middle class.
All Values in Kshs Unless Stated Otherwise)
|
Apartments Performance H1'2019 – Top 5: Lower Mid-End |
|||||||
|
Row Labels |
Price per SQM H1'2019 |
Rent per SQM H1'2019 |
Annual Uptake H1'2019 |
Occupancy H1'2019 |
Annual Price Appreciation H1'2019 |
Rental Yield H1'2019 |
Total Returns H1'2019 |
|
Lang’ata |
97,012 |
544 |
15.0% |
83.4% |
1.3% |
5.5% |
6.8% |
|
South C |
99,059 |
555 |
20.6% |
88.1% |
0.8% |
4.8% |
5.7% |
|
Imara Daima |
63,203 |
354 |
22.3% |
90.0% |
(0.2%) |
5.6% |
5.4% |
|
Dagoretti |
89,807 |
627 |
16.5% |
88.7% |
0.0% |
5.1% |
5.1% |
|
Ngong Road |
99,800 |
508 |
20.7% |
87.2% |
0.9% |
3.8% |
4.7% |
|
Average |
89,776 |
518 |
19.0% |
87.5% |
0.6% |
5.0% |
5.5% |
|
|||||||
Source: Cytonn Research 2019
Satellite Towns
Apartments in satellite towns were the best performing category with average total returns of 6.3% (a price appreciation of 1.5% and a rental yield of 4.8%), attributable to relatively low land prices, with majority of the towns currently experiencing major infrastructural improvements enabling developers to develop and sell homes at relatively affordable prices, thus boosting uptake.
(All Values in Kshs Unless Stated Otherwise)
|
Apartments Performance H1'2019 – Top 5: Satellite Towns |
|||||||
|
Row Labels |
Price per SQM H1'2019 |
Rent per SQM H1'2019 |
Annual Uptake H1'2019 |
Occupancy H1'2019 |
Annual Price Appreciation H1'2019 |
Rental Yield H1'2019 |
Total Returns H1’2019 |
|
Ruaka |
98,098 |
454 |
20.6% |
91.9% |
2.4% |
5.6% |
8.0% |
|
Thindigua |
99,270 |
499 |
21.1% |
88.4% |
1.8% |
4.2% |
6.1% |
|
Rongai |
63,064 |
350 |
19.1% |
68.5% |
1.1% |
4.6% |
5.7% |
|
Kitengela |
60,124 |
341 |
16.5% |
76.3% |
2.2% |
4.5% |
6.6% |
|
Syokimau |
59,242 |
289 |
15.6% |
88.2% |
0.0% |
4.9% |
4.9% |
|
Average |
75,960 |
386 |
18.6% |
82.6% |
1.5% |
4.8% |
6.3% |
|
|||||||
Source: Cytonn Research 2019
Overall, we expect the residential sector to continue experiencing minimal demand in the high-end and upper mid-end sectors mainly driven by incoming expatriates. However, the lower mid-end sectors will continue to exhibit fast growing demand from the majority of Kenyans seeking to buy affordable homes amidst a tough financial environment.
- Commercial Sector
- Commercial Office
In H1’2019, the commercial office sector recorded a decline in performance recording 0.3% and 2.3% points decline in average rental yields and occupancy rates, to 7.8% and 81.0% in H1’2019, from 8.1% and 83.3%, respectively in FY’2018. Asking rents decreased by 5.3% to an average of Kshs 96.6 per SQFT in H1’2019, from Kshs 102 per SQFT in FY’2018, while asking prices increased marginally by 0.5% to Kshs 12,637 in H1’2019 from Kshs 12,573 in FY’2018. The negative performance was largely attributed to:
- A surplus of office space that stood at 5.2 mn SQFT as at 2018, which has created a bargaining chip for tenants forcing developers to reduce or maintain prices and rents in order to remain competitive and attract occupants to their office spaces, and,
- Slow growth in private sector credit following the capping of interest rates on loans offered by banks creating a tough operating environment for small and medium-sized enterprises (SMEs), leading to layoffs, downsizing or business closures.
The table below highlights the performance of the commercial office sector in Nairobi over time:
All values in Kshs unless stated otherwise
|
Summary of Commercial Office Returns in Nairobi Over Time |
|||||||
|
Year |
Q1'2018 |
H1'2018 |
Q3'2018 |
FY'2018 |
Q1’2019 |
H1’2019 |
∆ Y/Y Q4'2018/H1'2019 |
|
Occupancy (%) |
80.5% |
84.6% |
87.3% |
83.3% |
82.4% |
81.0% |
(2.3%) points |
|
Asking Rents (Kshs/SQFT) |
98.0 |
102.0 |
102.0 |
102.0 |
100.3 |
96.6 |
(5.3%) |
|
Average Prices (Kshs/SQFT) |
12,718 |
12,527 |
12,202 |
12,573 |
12,574 |
12,637 |
0.5% |
|
Average Rental Yields (%) |
9.2% |
9.3% |
9.5% |
8.1% |
8.0% |
7.8% |
(0.3%) points |
|
|||||||
Source: Cytonn Research 2019
In terms of submarket analysis, Gigiri, Kilimani and Karen were the best performing nodes in H1’2019, recording rental yields of 9.2%, 9.2%, and 9.0%, respectively, attributed to increased demand by businesses and multinational companies, as a result of their superior locations, offering quality Grade A offices, which enable them to charge a premium on rental charges.
Thika Road and Mombasa Road continue to record the lowest returns with average rental yields of 5.9% and 5.4% in H1’2019, respectively, which represents a 0.8% and 0.4% points decline from 6.7% and 5.8%, in FY’2018, respectively. This is attributed to low-quality office space and traffic snarl-ups that have made the nodes generally unattractive to firms.
The most improved nodes were Karen and Parklands which recorded rental yields of 9.0%and 8.9%, respectively, driven by increased occupancy rates of 2.6% each, as a result of its serene working environment away from the key commercial nodes such as the Nairobi CBD, thus attracting high-end clientele and premium rental rates.
The table below highlights Nairobi Commercial Office Submarket Performance in H1'2019:
All values in Kshs unless stated otherwise
|
Nairobi Commercial Office Submarket Performance 2018- H1'2019 |
|||||||||||
|
Location/Node |
Price Kshs/ SQFT H1'2019 |
Rent Kshs/SQFT H1'2019 |
Occupancy H1'2019(%) |
Rental Yield (%) H1'2019 |
Price Kshs/ SQFT FY 2018 |
Rent Kshs/SQFT FY 2018 |
Occupancy FY 2018(%) |
Rental Yield (%) FY 2018 |
∆ in Rent |
∆ in Occupancy (% points) |
∆ in Rental Yields (% points) |
|
Gigiri |
13,833 |
116.0 |
77.0% |
9.2% |
13,833 |
141.0 |
88.3% |
10.5% |
(17.7%) |
(11.3%) |
(1.3%) |
|
Kilimani |
12,680 |
91.0 |
82.9% |
9.2% |
13,525 |
98.9 |
88.3% |
8.0% |
(8.0%) |
(5.3%) |
1.1% |
|
Karen |
13,665 |
112.2 |
91.1% |
9.0% |
13,666 |
118.0 |
88.6% |
9.2% |
(4.9%) |
2.6% |
(0.3%) |
|
Parklands |
12,369 |
100.9 |
88.6% |
8.9% |
12,494 |
102.1 |
86.0% |
8.4% |
(1.2%) |
2.6% |
0.5% |
|
Westlands |
12,334 |
106.9 |
79.5% |
8.4% |
12,050 |
109.7 |
82.1% |
9.0% |
(2.6%) |
(2.6%) |
(0.6%) |
|
Nairobi CBD |
12,425 |
88.8 |
88.4% |
7.6% |
10,875 |
88.8 |
88.3% |
7.6% |
0.0% |
0.1% |
0.0% |
|
UpperHill |
12,431 |
97.6 |
82.9% |
7.3% |
12,560 |
99.8 |
80.7% |
7.9% |
(2.2%) |
2.2% |
(0.6%) |
|
Thika Road |
12,600 |
83.3 |
74.7% |
5.8% |
12,517 |
86.3 |
81.5% |
6.7% |
(3.5%) |
(6.8%) |
(0.9%) |
|
Msa Road |
11,400 |
72.8 |
64.0% |
5.3% |
11,400 |
78.8 |
65.6% |
5.8% |
(7.6%) |
(1.6%) |
(0.5%) |
|
Average |
12,637 |
96.6 |
81.0% |
7.8% |
12,547 |
102.6 |
83.3% |
8.1% |
(5.3%) |
(2.3%) |
(0.3%) |
|
*Gigiri area covers Gigiri and Limuru Road
|
|||||||||||
Source: Cytonn Research 2019
The key highlights in the commercial office sector in H1’2019 include; (i) launch of corporate serviced offices at Sanlam Tower, Waiyaki Way, Westlands by Workable Nairobi, a commercial serviced office provider, (ii) the opening of Park Medical Centre along 3rd Parklands Avenue in Parklands, and (iii) Opening of business offices by multinational corporations: Cigna, a global health service company, MAC Mobile, a FMCG technology solutions company, and Mauritius Commercial Bank (MCB) Group at the UNON Complex in Gigiri, 3 Mzima Springs Road in Kileleshwa and Pramukh towers in Westlands, respectively.
We retain a negative outlook on the performance of the commercial office sector attributable to an oversupply of 5.2mn SQFT of office space thereby reducing occupancy rates translating to decline in rental yields. Pockets of value in the sector are in differentiated concepts such as serviced offices and offices in mixed-use developments (MUDs) that attract yields of 13.4% and 8.2%, respectively.
- Retail
The retail sector performance softened, recording a 0.8% points decline in rental yield to 8.2% in H1’ 2019 from 9.0% in FY’ 2018. This is due to the retail space surplus, recording an oversupply of 2.0 mn SQFT, which saw average occupancies drop by 3.5% points from 79.1% in FY’ 2018 to 75.6% in H1’ 2019 and average rents declined by 4.9% to Kshs 170.0/ SQFT/month from Kshs 178.2/ SQFT/month in FY’2018. The decline in rent is attributable to property managers’ adoption of innovative pricing models such as reducing rental charges and rent-free grace periods of up to 6 months in order to attract tenants.
The performance of the retail sector in Nairobi over time is as shown below;
All values in Kshs unless stated otherwise
|
Retail Sector Performance H1’ 2019 |
|||||
|
Item |
H1' 2018 |
FY' 2018 |
H1’ 2019 |
∆ Y/Y |
∆ H1’2019 |
|
Average Asking Rents (Kshs/SQFT) |
190.4 |
178.2 |
170.0 |
(10.7%) |
(4.9%) |
|
Average Occupancy (%) |
82.7% |
79.1% |
75.6% |
(7.4%) |
(3.5%) points |
|
Average Rental Yields |
9.7% |
9.0% |
8.2% |
(1.8%) |
(0.8%) points |
|
|||||
Source: Cytonn Research 2019
In terms of submarket analysis in Nairobi, Westlands and Kilimani were the best performing retail nodes with average rental yields of 12.0% and 10.5% respectively, as the areas are affluent neighborhoods hosting middle – high-end income earners with high consumer purchasing power and thus tenants are willing to pay higher rents for retail space in the area. Mombasa Road and Satellite towns were the worst performing nodes recording a rental yield of 6.3% and 5.7%, respectively. The poor performance is attributable to low rental charges as a result of traffic congestion along Mombasa road and competition from informal retail space in Satellite towns.
Karen recorded the largest declines in the rental yield in H1’ 2019 of 2.2%, attributable to a 17.0% decline in average occupancy rates as a result of the opening of Waterfront and The Well malls.
All values in Kshs unless stated otherwise
|
|
Summary of Nairobi’s Retail Market Performance H1’ 2019 |
||||||||||
|
Location |
Rent Kshs/SQFT H1’ 2019 |
Occupancy H1’ 2019 |
Rental Yield H1’ 2019 |
Rent Kshs/SQFT FY’ 2018 |
Occupancy FY’ 2018 |
Rental Yield FY’ 2018 |
H1’ 2019 ∆ in Rental Rates |
H1’ 2019 ∆ in Occupancy (% points) |
H1’ 2019 ∆ in Rental Yield (% points) |
||
|
Westlands |
209 |
89.0% |
12.0% |
219 |
82.2% |
12.2% |
(4.7%) |
6.8% |
(0.2%) |
||
|
Kilimani |
173 |
91.4% |
10.5% |
167 |
97.0% |
10.7% |
3.6% |
(5.6%) |
(0.2%) |
||
|
Ngong Road |
171 |
87.5% |
9.3% |
175 |
88.8% |
9.7% |
(2.3%) |
(1.3%) |
(0.4%) |
||
|
Karen |
219 |
71.8% |
8.8% |
225 |
88.8% |
11.0% |
(2.5%) |
(17.0%) |
(2.2%) |
||
|
Eastlands |
145 |
74.2% |
7.5% |
153 |
64.8% |
6.8% |
(5.6%) |
9.4% |
0.7% |
||
|
Kiambu Road |
169 |
65.3% |
7.3% |
183 |
69.5% |
8.1% |
(7.6%) |
(4.2%) |
(0.8%) |
||
|
Thika road |
168 |
66.5% |
6.8% |
177 |
75.0% |
8.3% |
(5.4%) |
(8.5%) |
(1.5%) |
||
|
Mombasa road |
144 |
65.5% |
6.3% |
162 |
72.4% |
7.9% |
(10.7%) |
(6.9%) |
(1.6%) |
||
|
Satellite Towns |
129 |
69.2% |
5.7% |
142 |
73.7% |
6.7% |
(9.2%) |
(4.5%) |
(1.0%) |
||
|
Average |
170 |
75.6% |
8.2% |
178 |
79.1% |
9.0% |
(4.9%) |
(3.5%) |
(0.8%) |
||
|
|||||||||||
Source: Cytonn Research 2019
We expect reduced development activity of malls supply in 2019 due to the current oversupply of 2.0mn SQFT. However, our outlook for the sector is neutral as the sector continues to attract both local and international retailers to cushion the retail real estate sector performance through increased occupancy rates.
III. Hospitality Sector
In H1’ 2019, 2 industry reports related to the hospitality sector were released. The take-outs were as stated below:
|
Report |
Key Take-outs |
|
|
|
The above reports indicate an upward growth trajectory in the hospitality sector over the last year. This is reaffirmed by the recent hospitality sector activities recorded in the sector during the first half of the year. They include;
- In January, Superior Hotels Limited, a hospitality chain, opened its third hotel in Naivasha town, in an expansion move that has seen its portfolio grow to 6 hotels. The resort, which is located along Naivasha Moi South Road, brought to the market 96 rooms organized in cottages, 16 conference rooms, a business center and an amphitheater with a capacity of 1,200 people. In our view, the hotel will be a destination for meetings, incentives, conferencing and exhibitions tourism, as Naivasha town is preferred by corporates and government institutions for out-of-office meetings. Please see Cytonn Q1'2019 Market Review,
- In February, local airlines, Kenya Airways and Silverstone Air, introduced daily direct flights from Nairobi to Seychelles, and from Nairobi to Lodwar, respectively. In our view, the improving air transport operations, political stability and continued marketing of Kenya as an experience destination, will result in increased tourist arrivals. For more analysis, please see our Cytonn Weekly #03/2019,
- In February, Ministry of Tourism Cabinet Secretary Hon. Najib Balala announced plans to rehabilitate Kisumu’s Sunset Hotel into a conference center. The center, set to be complete by 2021, will have a 10,000-pax capacity with an estimated cost of Kshs 300.0 mn. In our view, the move will buck the growth of both local and international conferencing with demand being driven by national and county government officials, corporates, political parties and international delegates looking to hold meetings in the county. Please see our Cytonn Weekly #08/2019 for more analysis,
- In March, Concord Hotels, a local hotel group, announced that it was set to open Shelly Beach Hotel in Mombasa after a US 10.0 mn makeover. The phase 1 of the refurbishment will include restaurants, swimming pools, bar and 36 rooms and is set for completion by the end of 2019. We expect that the refurbishment will result in the improvement of hospitality services and thus give the hotel a competitive advantage in the wake of competition from other international brands such as the Hilton Hotel and Radisson Hotel Group. Please see Cytonn Q1'2019 Market Review, and
- In May, one of Marriott International’s brand of luxury hotels, Autograph Collection Hotels, took over Nairobi’s Sankara Hotel located in Westlands, as a franchise. Sankara Hotel, which had 168 keys, underwent renovation to suit the Autograph Collection’s brand gaining an additional 11 suites, bringing its total number of keys to 179. For analysis, see Cytonn Weekly #19.
We expect the hospitality sector to continue recording increased activities supported by; i) the improving air transport operations, ii) continued marketing of Kenya as an experience destination, iii) improved security, and iv) political stability, which have continued to boost tourists’ confidence in the country and thus making it a preferred travel destination for both business and holiday travelers.
IV. Land Sector
The land sector in the NMA recorded a 0.5% y/y decline in the asking prices, 4.3% points decline compared to the 3.8% growth rate in H1’2017, attributed to an overall slowdown in real estate investment activities. Despite the rest of the zones recording a decline in asking prices, un-serviced land in satellite towns such as Ruiru and Limuru registered a 4.1% annual capital appreciation on average, attributed to the relatively high demand for land in these areas fueled by the affordable housing initiative in addition to satellite towns acting as Nairobi’s dormitory with majority of the population moving away from the congested Central Business District.
The table below shows the performance of the sector:
All values in Kshs unless stated otherwise
|
Summary of the Land Price Performance by Zones – Nairobi Metropolitan Area 2018/19 |
|||||||||
|
Location |
*Price in 2011 |
*Price in 2015 |
*Price in H1’2017 |
*Price in H1’ 2018 |
*Price in H1’ 2019 |
7-year CAGR |
H1’ 2018 Annual Capital Appreciation |
H1’ 2019 Annual Capital Appreciation |
Y/Y ∆ in capital appreciation |
|
Satellite Towns - Unserviced Land |
9m |
17m |
22m |
23m |
23.7m |
17.8% |
5.1% |
4.1% |
(1.0%) |
|
Nairobi Suburbs - Low Rise Residential Areas |
36m |
68m |
79m |
82m |
81m |
12.4% |
5.5% |
(0.9%) |
(6.4%) |
|
Nairobi Suburbs - High rise residential Areas |
52m |
92m |
111m |
117m |
117m |
12.7% |
4.2% |
(1.6%) |
(5.7%) |
|
Nairobi Suburbs - Commercial Areas |
156m |
377m |
458m |
473m |
463m |
17.0% |
3.4% |
(1.8%) |
(5.2%) |
|
Satellite Towns - Site and service schemes |
5m |
12m |
13m |
13m |
13m |
18.9% |
1.0% |
(2.2%) |
(3.2%) |
|
Average |
15.7% |
3.8% |
(0.5%) |
(4.3%) |
|||||
|
*Asking land price per acre
|
|||||||||
Source: Cytonn Research
- Land in satellite towns such as Ruiru recorded an annual capital appreciation of 4.1% in H1’2019, 1.0% points lower than the 5.1% growth recorded in H1’2018 attributed to the relatively high demand for land in these areas, fueled by the affordable housing initiative which has been a key focus sector by both the government and private sector players, in addition to satellite towns acting as Nairobi’s dormitory with majority of the population moving away from the congested Central Business District,
- Low rise residential areas recorded a 0.9% asking price correction in H1’19, 6.4% points lower than the 5.5% price growth rate recorded in H1’2018. This is attributed to general decline in demand for development land in these areas attributed to (i) unaffordability given the relatively high asking land price per acre of Kshs 81 mn on average compared to satellite towns at approximately Kshs 24 mn per acre, and (ii) credit crunch that has led to a decline in housing units uptake and prices by 3.5% and 0.9% respectively, making these areas unattractive to investors,
- High rise residential areas recorded a 1.6% decline in asking prices in H1’2019 5.8% points decline compared to 4.2% growth rate in H1’2018, attributed to the decline in demand for development land due to reduced development activity, in the residential sector evidenced by the 12.0% decline in total value of residential building approved to Kshs 132 bn in 2018 from Kshs 150 bn in 2017 according to the Kenya National Bureau of Statistics (KNBS) Economic survey 2019,
- Commercial zones recorded a 1.8% decline in asking prices in H1’2019 5.2% points lower than 3.4% recorded in H1’2018. We attribute this to decreased development activities in commercial zones due to the existing oversupply of 5.3 mn SQFT of office space and 2.0 mn of retail space. Kilimani recorded the highest annual capital appreciation at 4.1%, attributed the continued demand for commercial land in the area by developers looking to venture into differentiated concepts such as serviced apartments and offices, which thrive in the area given that it hosts expatriates and the middle class with high purchasing power. On the other hand, Westlands recorded a 9.3% price correction given the high land prices at approximately Kshs 430 mn per acre, thus investors are not able to achieve a favourable return on investment in the area,
- Serviced land in satellite towns recorded a 2.2% annual decline in asking prices, due to decreased demand as buyers are not willing to pay a premium for the services provided, thus opt for un-serviced land and provide the services for themselves. Syokimau- Mlolongo recorded the highest annual capital appreciation of 3.5% driven by the speculative tendencies brought about by the Standard Gauge Railway (SGR). Ruai recorded the highest decline in prices of 9.4%, attributable to decreased demand for development land in the area as a result of the ongoing land repossession in parts of the area in addition to title contestation thus causing investors to adopt a wait and see attitude, which means reduced activities,
- The investment opportunity in land is in Satellite towns, in markets with high returns such as Ruiru and Utawala which recorded annual capital appreciation rates of above 5.0% in H1’2019 and Syokimau- Mlolongo areas for site and service schemes recording an average 3.5% capital appreciation in the wake of a market decline of 2.2% during the same period, thus making these areas the most recommendable for both land and real estate development.
Other highlights during the first half of the year:
- In March 2019, the Government of Kenya announced plans to incorporate blockchain technology into the land’s digitization process in a bid to end human interference in the Lands Ministry by helping track all land transactions in the country, thus leading to an efficient, transparent and fair system in a country where issues of land fraud have been rampant. See Cytonn Q1 2019 Market Review, and
- The Lands Information Management System (LIMS) went live as from 1st April 2019, as announced prior by the Ministry of Lands. The system is expected to shorten the lands registration process by 61-days, to 12-days, from 73-days required by the manual system and this is likely to enhance time-saving, cost reduction and transparency in the registration of land and thus encourage property development. For more details, see our Cytonn Weekly 11/2019.
Despite the reduced real estate activities in the NMA due to the existing oversupply in the commercial office, retail and upper- mid-end residential sectors, we expect growth in the land sector to be driven by the demand for development land especially with the affordable housing initiative, digitalization of the lands ministry thus simplifying the transaction processes, improving infrastructure and positive demographics.
V. Statutory Reviews
In June, the National Treasury read the FY2019/2020 Budget statement themed Creating Jobs, Transforming Lives - Harnessing the “Big Four” Plan. The budget proposed an increase in the rate of Capital Gains Tax (CGT) from 5.0% to 12.5%, excluding the transfer of properties necessitated by restructuring. Despite this having a positive impact on the nation, we expect the same to negatively impact on the real estate sector by resulting in;
- a “Lock-in effect” as the investors may result in holding properties that have appreciated to avoid paying the CGT on the same if the margins are low,
- the increased burden to the already struggling real estate sector, and
- increased property prices in the long run
For further details, see Cytonn Weekly 24/2019
VI. Infrastructure Sector
Infrastructure sector was characterised by the following highlights in H1’ 2019;
- Kenya National Bureau of Statistics released the Economic Survey 2019, which reported the government expenditure on roads decreased by 7.4%, to Kshs 104.8 bn in 2017/18, from Kshs 113.2 bn in 2016/17. The key notable construction activities in 2018 were the ongoing construction of Phase Two of the Standard Gauge Railway (SGR) and other public investments in transportation infrastructure, with a 9.8% increase in the total length of bitumen roads in Kenya to 18,655 km in 2018, from 16,827 km in 2017. For more information, see Cytonn Weekly #17/2019,
- The National Treasury read the FY2019/2020 budget on 13th June 2019. According to the budget, the infrastructure sector was allocated Kshs 324.7 bn, 22.5% lower than the 418.8 bn allocated in the 2018/2019 budget. The funds will be directed towards ongoing road construction projects as well as road rehabilitation and maintenance, completion of Phase 2A of the Standard Gauge Railway, the Lamu Port-South Sudan-Ethiopia-Transport (LAPSSET) Corridor project and the Mombasa Port Development Project. For more information, see Cytonn Weekly #24/2019,
- Construction of the 17.4 km Western Bypass by the China Road and Bridge Corporation commenced in April. The Kshs 17 bn project starts from Gitaru, linking to Southern Bypass and terminates at Ruaka, in Kiambu County. The increased provision of infrastructure is expected to increase accessibility and reduce traffic congestion, resulting in increased demand for property in satellite towns such as Ruaka.
Despite the slowdown in infrastructure expenditure, infrastructural development still remains a top priority and we expect the Kenyan government to remain committed in infrastructure improvements and completing ongoing projects.
VII. Listed Real Estate
The Stanlib Fahari Income-REIT closed the first half of the year at Kshs 9.2 per share, 14.4% lower than the year’s opening price of Kshs 10.8, and 54.0% from its issue price of Kshs 20. The REIT has been performing poorly mainly due to minimal acceptance by real estate investors and a general poor institutional framework inhibiting its growth.
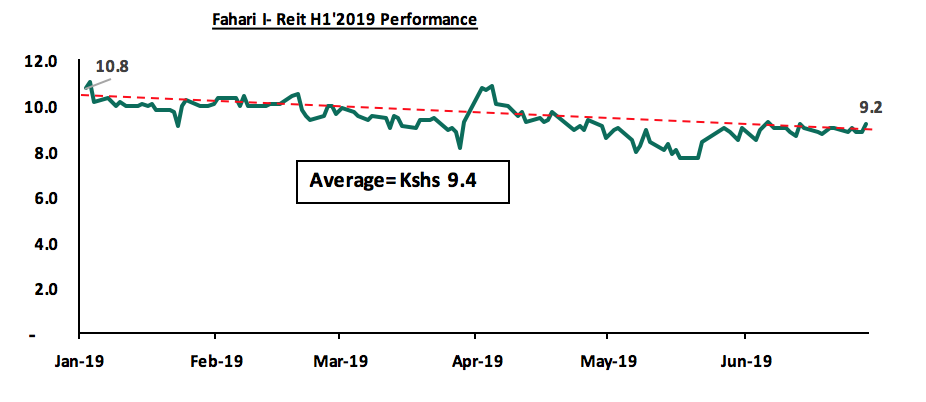
Other highlights in the sector:
- In March, Stanlib Fahari I-REIT released their FY’2018 earnings, registering a 13.1% growth in earnings to Kshs 1.07 per unit from Kshs 0.95 per unit in FY’2017, attributable to a 10.9% growth in rental income to Kshs 309.8 mn from Kshs 279.4 mn in FY’2017. The net profit in 2018 grew by 13.1% to Kshs 193.5 mn, from Kshs 171.1 mn in FY’2017. The REIT recorded 1.6% points increase in dividend yield to 8.1% in 2018 from 6.5 % in 2017, attributable to its declining stock price closing at Kshs 9.2 per unit as at 29th March 2019 in comparison to Kshs 11.6 as at 29th March 2018, representing a 20.3% loss of value. To date, that is as at 28th June 2019, the value of the REIT has declined by 54.0%, closing at Kshs 9.2 per share, compared to its initial listing price of Kshs 20.0 in November 2015. For a more comprehensive analysis on the REIT FY’2018 performance, see our Stanlib Fahari I-REIT Earnings Note - 2019,
- In April, Stanlib Fahari I-REIT announced plans to acquire more properties from pension firms and insurers who will be compensated in the form of units in the REIT. The proposed structure eliminates the need for the firm to raise large sums of new capital to buy more buildings, in addition to expanding the pool of income-generating buildings owned by the REIT and raising earnings for the expanded investor base. For more information and analysis, see our Cytonn Weekly #17/2019,
- Nairobi Securities Exchange (NSE) admitted property development company, ‘My Space Properties’, under the Ibuka Incubator Programme, following successful vetting of the subject company. My Space Properties plans to officially list after the incubation, which will make it the second property developer to be listed in Kenya, after Home Afrika Limited, which went public on 15th July 2013. For more information and analysis, see our Cytonn Weekly #14/2019,
- In June, the 2019 Finance Bill was published, and it proposes an amendment of the Income Tax Act to include the exemption of REIT investee companies from income tax. If successful, the amendment which is subject to Parliament’s approval will have a positive impact on the performance of the REIT market through resulting in higher returns to the investors, thus attracting them and this will deepen the capital markets. The move signifies the growing institutional support of the REIT by institutions such as the Capital Markets Authority (CMA).
Our outlook for Stanlib’s listed real estate is neutral supported by the improved dividend yield, in line with the real estate performance.
Disclaimer: The views expressed in this publication are those of the writers where particulars are not warranted. This publication, which is in compliance with Section 2 of the Capital Markets Authority Act Cap 485A, is meant for general information only and is not a warranty, representation, advice or solicitation of any nature. Readers are advised in all circumstances to seek the advice of a registered investment advisor.

- Talk to us
- Kenya
- P.O Box 20695 - 00200, Nairobi, Kenya
- Cell +254709101200
- Tel +254709101200
- WhatsApp +254741676635
- United States
- +254709101200
- DOWNLOAD OUR APP
-


- Kenya
- 8th Floor, Pinetree Plaza, Kaburu Drive, Ngong Road, Nairobi, Kenya
- USA
- Suite 1150, 1775 Eye Street NW, USA, Washington DC 20006, USA
- Investments
- High Yield
- Private Equity
- Real Estate
- Real Estate
- RiverRun Estates
- Cytonn Towers
- The Ridge
- Taraji Heights
- The Alma