Nanyuki Real Estate Investment Opportunity, 2019, & Cytonn Weekly #23/2019
By Research Team, Jun 9, 2019
Executive Summary
Fixed Income
T-bills remained oversubscribed during the week, with the overall subscription rate declining to 116.0%, from 129.4% recorded the previous week. The continued oversubscription is attributable to favorable liquidity in the market supported by government payments. Kenya’s headline PMI reading rose to 51.3 in May, from 49.3 recorded in April to signal an improvement in the health of the Kenyan private sector. Readings above 50.0 signal an improvement in business conditions, while readings below 50.0 show a deterioration. The National Treasury is set to release the 2019/20 fiscal year (FY) budget on 13th June 2019. As such, a lot of pre-budget discussions are taking place ahead of the official release, we have written a note with our views before the budget is officially released. In the money markets, 3-month bank placements ended the week at 9.0% (based on what we have been offered by various banks), 91-day T-bill at 6.9%, average of Top 10 Money Market Funds at 9.3%, with the Cytonn Money Market Fund closing the week at 11.1%;
Equities
During the week, the equities market recorded a positive performance, with NASI, NSE 20 and NSE 25 gaining by 0.4%, 0.9% and 0.9%, taking their YTD performance to gains/ (losses) of 7.1%, (4.7%) and 2.7%, for NASI, NSE 20 and NSE 25, respectively. Co-operative Bank of Kenya highlighted its plan of leveraging on its large client base, to grow the business of its subsidiary Co-op Bank Fleet;
Private Equity
During the week, Velocity Capital Fintech Ventures, a Netherlands-based private equity firm investing in Fintech companies in Europe, Africa and North America, announced the launch of its USD 120.0 mn (Kshs 12.2 bn) venture fund aimed at investing in early-stage companies focusing on banking, payments, credit and other Fintech areas;
Real Estate
During the week, Knight Frank, a real estate management firm, released its periodic report titled ‘Prime Global Cities Index (PGCI) Q1’2019’, highlighting a 6.5% annual decline in prices of prime residential houses in Nairobi, between Q1’2018 and Q1’2019. Deltar Real Estate, a real estate developer, announced their plan to develop a 90-unit, 15-storey residential apartment located along Batubatu Gardens in Parklands, Nairobi. The International Finance Corporation (IFC), an international development financial institution, disclosed that it is set to invest in straight equity of up to USD 2 million (Kshs 202 mn) in common shares of Kenya Mortgage Refinancing Company (KMRC);
Focus of the Week
In line with our regional coverage strategy, we continue to carry out research on various markets in Kenya. Currently, we have done research in counties such as Mombasa, Nakuru, Kisumu, Laikipia, Meru, Nyeri, and Uasin Gishu. This week we focus on Nanyuki Town by highlighting its performance informed by the 2019 market research. Nanyuki Town real estate market recorded a 4.7% average rental yield in the residential sector, 7.6% in the commercial sector and an annualized capital appreciation of 4.7% in the land sector, compared to the Nyeri market average of 5.1%, 6.3% and 19.1%, respectively.
- Cytonn Money Market Fund closed the week at an average yield of 11.1%, to subscribe, just dial *809#;
- In line with increasing the product offering to our clients, we are happy to announce that Cytonn Asset Managers has received two more licenses to offer personal retirement benefits scheme with a monthly payment platform from the Retirement Benefits Authority (RBA). The licenses allow Cytonn Asset Managers to; manage segregated funds, personal pension funds and the income drawdown fund. https://bit.ly/2K6xs6u. For more information on the pension products, email us at pensions@cytonn.com;
- Interested in learning about real estate investments in a relaxing environment? Be sure to stop by our stand at The Village Market next weekend, on the 15th and 16th of June 2019, from 9:00 am - 6:00 pm and start your investments journey;
- Ian Kagiri - Investments Analyst was on KTN News to discuss the rise of mobile lending apps that are on the rise in Kenya. Watch him here;
- Juster Kendi – Research Analyst was on K24 to discuss the current state of the retail sector in Kenya. Watch her here;
- Cytonn held its Q2’2019 client dinner at the Sarova Panafric on 6th June 2019. Read the event note here.
- For an exclusive tour of Cytonn’s real estate developments, visit: Sharp Investor’s Tour and for more information, email us at sales@cytonn.com;
- Following the completion and handover of Amara Ridge in Karen, we have now launched our next Karen project, dubbed Applewood, a Kshs 2.5 bn residential development located in Miotoni, Karen. This signature development shall comprise luxury homes, each sitting on 1/2 acre. We invite you to the exhibition of Applewood which is ongoing at the Amara Ridge Clubhouse (Location pin: https://goo.gl/maps/B3GVnu8pHyn) or at the Applewood Sales Centre on Miotoni Road (Location pin: https://goo.gl/maps/ZfABuGjFo1z) from 9:00 am to 5:00 pm daily. Call 0709 101 000 or email resales@cytonn.com to reserve a villa! See Video here;
- We continue to hold weekly workshops and site visits on how to build wealth through real estate investments. The weekly workshops and site visits target both investors looking to invest in real estate directly and those interested in high yield investment products to familiarize themselves with how we support our high yields. Watch progress videos and pictures of The Alma, Amara Ridge, and The Ridge;
- We continue to see very strong interest in our weekly Private Wealth Management Training (largely covering financial planning and structured products). The training is at no cost and is open only to pre-screened participants. We also continue to see institutions and investment groups interested in the training for their teams. Cytonn Foundation, under its financial literacy pillar, runs the Wealth Management Training. If interested in our Private Wealth Management Training for your employees or investment group, please get in touch with us through wmt@cytonn.com. To view the Wealth Management Training topics, click here;
- For recent news about the company, see our news section here;
- We have 10 investment-ready projects, offering attractive development and buyer targeted returns. See further details here: Summary of Investment-Ready Projects.
Money Markets, T-Bills & T-Bonds Primary Auction:
T-bills remained oversubscribed during the week, with the overall subscription rate declining to 116.0%, from 129.4% recorded the previous week. The continued oversubscription is attributable to favourable liquidity in the market supported by government payments. The yields on the 91-day and 182-day papers both declined by 0.1% points to 6.9% and 7.6%, from 7.0% and 7.7% recorded the previous week, respectively, while the yield on the 364-day paper remained unchanged at 9.3%. The acceptance rate declined to 62.2%, from 91.9% recorded the previous week, with the government accepting a total of Kshs 17.3 bn of the Kshs 27.8 bn worth of bids received, lower than the weekly quantum of Kshs 24.0 bn, as the government is currently under no borrowing pressure being 17.1% ahead of the FY’2018/2019 borrowing target. Investors’ participation remained skewed towards the longer-dated paper, with the continued demand being attributable to the scarcity of newer short-term bonds in the primary market. The 364-day recording improved subscription to 261.1%, from 210.5% the previous week, while the subscription rates for the 91-day and 182-day papers declined to 22.6% and 8.1%, from 146.1% and 46.4% recorded the previous week, respectively.
In the money markets, 3-month bank placements ended the week at 9.0% (based on what we have been offered by various banks), 91-day T-bill at 6.9%, average of Top 10 Money Market Funds at 9.3%, with the Cytonn Money Market Fund closing the week at 11.1%.
Liquidity:
During the week, the average interbank rate declined to 3.9%, from 4.7% recorded the previous week, pointing to improved liquidity conditions in the money market supported by government payments, which saw commercial banks’ excess reserves coming in at Kshs 14.5 bn in relation to the 5.25% cash reserves requirement (CRR). The average volumes traded in the interbank market also declined by 31.7% to Kshs 7.6 bn, from Kshs 11.1 bn the previous week.
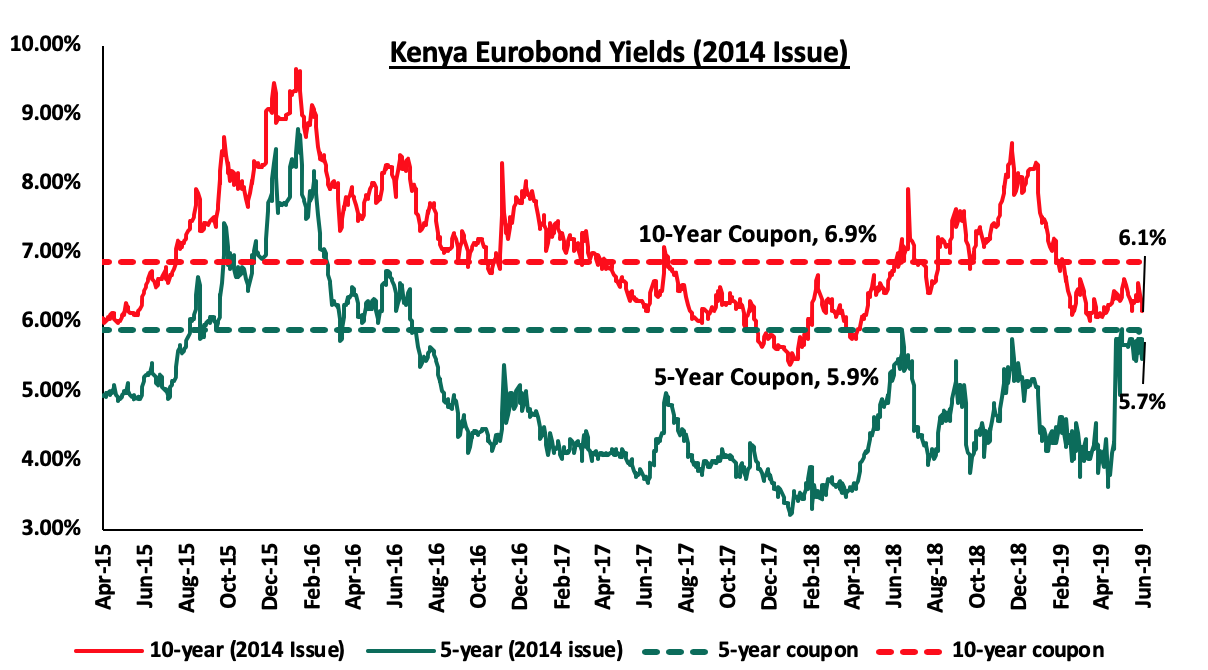
Kenya Eurobonds:
The yield on the 10-year Eurobond issued in 2014 declined by 0.3% points to 6.1%, from 6.4% the previous week, while that of the 5-year remained unchanged from the previous week at 5.7%. Key to note is that these bonds have 16-days and 5.0-years to maturity for the 5-year and 10-year, respectively.
For the February 2018 Eurobond issue, yields on the 10-year Eurobond declined by 0.3% points to 7.4% from 7.7% recorded the previous week, while the yield on the 30-year Eurobond also declined by 0.3% points to 8.5% from 8.8% the previous week.
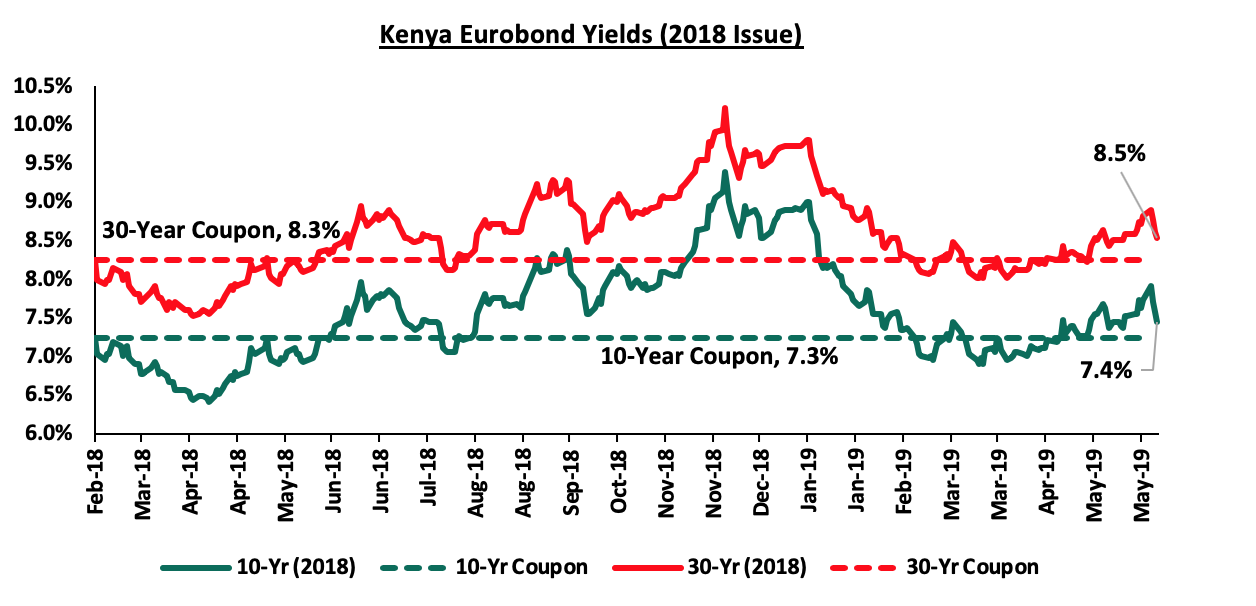
For the newly issued dual-tranche Eurobond with 7-Years and 12-years tenor, priced at 7.0% for the 7-year tenor and 8.0% for the 12-year tenor, respectively, the yield on the 7-year bond and 12-year bonds both declined by 0.2% points to 6.9% and 7.9%, respectively from 7.1% and 8.1% recorded the previous week.
The Kenya Shilling:
During the week, the Kenyan Shilling appreciated by 0.1% against the US Dollar to close at Kshs 101.3, from Kshs 101.4 the previous week, supported by inflows from diaspora remittances, which outweighed dollar demand from merchandise importers. The Kenya Shilling has appreciated by 0.5% year to date in addition to the 1.3% appreciation in 2018, and in our view, the shilling should remain relatively stable to the dollar in the short term, supported by:
- The narrowing of the current account deficit with data on balance of payments indicating continued narrowing to 4.5% of GDP in the 12-months to April 2019, from 5.5% recorded in April 2018. The decline has been attributed to the resilient performance of exports particularly horticulture and coffee, strong diaspora remittances, and higher receipts from tourism and transport services. Growth of imports also slowed mainly due to lower imports of food,
- Improving diaspora remittances, which have increased cumulatively by 3.8% in the Q1’2019 to USD 665.6 mn, from USD 641.5 mn recorded in a similar period of review in 2018. The rise is due to:
- Increased uptake of financial products by the diaspora due to financial services firms, particularly banks, targeting the diaspora, and,
- New partnerships between international money remittance providers and local commercial banks making the process more convenient,
- CBK’s supportive activities in the money market, such as repurchase agreements and selling of dollars, and,
- High levels of forex reserves, currently at an all-time high of USD 10.1 bn (equivalent to 6.4-months of import cover), above the statutory requirement of maintaining at least 4-months of import cover, and the EAC region’s convergence criteria of 4.5-months of import cover.
Highlights of the Week-
According to Stanbic Bank’s Monthly PMI released during the week, Kenyan firms saw a solid rise in new business and a renewed improvement in operating conditions during the month of May, after recording a deterioration in April for the first time since November 2017. The headline PMI reading rose to 51.3 from 49.3 recorded in April to signal an improvement in the health of the Kenyan private sector. Readings above 50.0 signal an improvement in business conditions, while readings below 50.0 show a deterioration. This increase was the first in the last five months. In the private sector, new orders grew with several businesses reporting that they had acquired new clients including some International ones. Consequently, output levels expanded but the gain was marginal and weaker compared to the last sequence of growth that ended in March. This was as a result of cash flow problems in the economy, but many businesses remained resilient and raised activity in line with the increased demand. Notably, many firms held back on purchases with the rise in input prices. The higher demand levels contributed to modest growth in employment among Kenyan businesses in terms of increase marketing roles. Firms were, however, unable to keep up with the new orders and backlogs grew at the fastest rate since September. Going forward, risk of high input prices remains abound due to the continued rising fuel prices coupled with the effects of delayed onset of long rains this year. Should the government clear the arrears as promised, this is expected to lead to a pick up in the sector due to improved cash flows which have continued to be a major problem in recent months.
The National Treasury is set to release the 2019/2020 fiscal year (FY) budget on 13th June 2019. As such, a lot of pre-budget discussions are taking place ahead of the official release and we have written a note with our views before the budget is officially released. Below is a summary of the budget estimates as per the National Treasury FY’2019/20 budget estimates:
|
Key Highlights of the 2019/20 proposed Budget (Kshs. Billion) |
|||
|
|
2018/2019 |
2019/2020 |
% Change |
|
National Government |
1,764.1 |
1,841.3 |
4.4% |
|
Judiciary |
16.1 |
18.9 |
17.3% |
|
Parliament |
35.1 |
43.6 |
24.2% |
|
County Allocation (Inc. conditional) |
376.5 |
371.6 |
-1.3% |
|
Consolidated Fund Services |
962.6 |
805.8 |
-16.3% |
|
Overall Budget |
3,154.4 |
3,081.2 |
(2.3%) |
|
Source: Parliamentary Budget Office and National Treasury FY’2019/20 Budget Estimates |
|||
The Total FY’2019/20 budget inclusive of the three arms of government, county allocation and the Consolidated Fund Services (CFS) is estimated at Kshs 3.08 tn, a 2.3% reduction from the Kshs 3.2 tn upward revised FY’2018/19 budget; mainly due to a 16.3% reduced allocation to CFS. The budget, however, is expansionary compared to the initial FY’2018/19 budget, which was at Kshs 3.07 tn but was later adjusted upwards by Kshs 80.0 bn, which is equal to a 2.6% increment. Assuming the current budget ends up experiencing the same adjustments, we shall end up at Kshs 3.2 tn.
|
Item |
FY'2018/2019 (Revised) |
FY'2019/2020 |
Change y/y |
|
Total revenue |
1,852.6 |
2,115.9 |
14.2% |
|
Grants |
48.5 |
38.8 |
(20.0%) |
|
Total revenue & external grants |
1,901.1 |
2,154.7 |
13.3% |
|
Total expenditure |
2,509.1 |
2,762.5 |
10.1% |
|
Fiscal deficit including grants |
(608.0) |
(607.8) |
0.0% |
|
Deficit(excluding grants) as % of GDP |
6.6% |
5.4% |
|
|
Net foreign borrowing |
287.0 |
324.3 |
13.0% |
|
Net domestic borrowing |
321.0 |
283.5 |
(11.7%) |
|
Total borrowing |
608.0 |
607.8 |
0.0% |
|
GDP Estimate |
9,990.0 |
11,346.5 |
|
|
Source Budget Summary, 2019 |
|
|
|
- Revenue
Total revenue collected is expected to increase by 14.2% to Kshs 2.1 tn, from the Kshs 1.9 tn as per the revised FY’2018/2019 revised Budget, mainly driven by a 12.2% rise in ordinary revenue to Kshs 1.9 tn, from an estimated Kshs 1.7 tn in the revised FY’2018/19 budget.
In recent years there has been an underperformance in revenue collections and the Government has not been able to meet its revenue target with the worst year being FY’2017/18 where it only managed to raise 89.6% of the targeted total revenue mainly due to a shortfall of Kshs 195.0 bn in ordinary revenue.
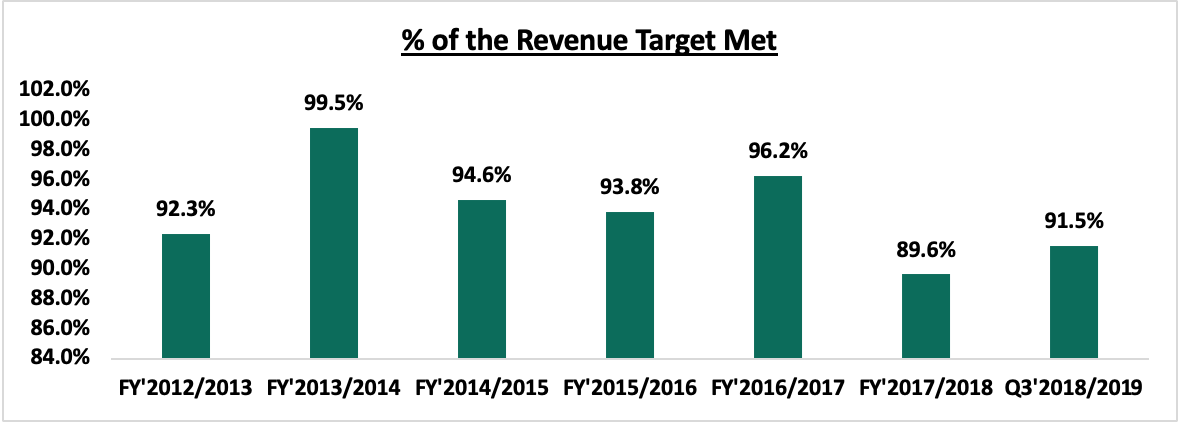
As per the Q3’2018/19 Budget outturn, the Kenya Revenue Authority (KRA) had only managed to raise Kshs 1.2 tn against a target of Kshs 1.3 tn representing 91.5% of the targeted revenue collection and it is doubtful that it will meet its target. The continued underperformance has been attributed to ambitious revenue targets set by the Government masking the true budget deficit position. For instance the Kshs 2.12 tn revenue estimate is a Kshs 35.0 bn upward revision from Kshs 2.08 tn as per the 2019 Budget Policy Statement which in effect mitigates the rise in the fiscal deficit as a percentage of GDP inclusive of grants to around 5.4% of GDP only slightly higher than the 5.1% envisioned in the BPS 2019. Despite the Government’s fiscal consolidation efforts, the ambitious revenue targets have often led to the rationalization of the budget later on with the development expenditure mainly taking the hit.
- Expenditure
As per the budget books estimates, total expenditure is set to increase by 10.1% to Kshs 2.8 tn from Kshs 2.5 tn as per the revised FY’2018/19 Budget. Key to note
According to the budget books estimates, development expenditure is set to increase by 14.8% to Kshs 684.1 bn from Kshs 595.7 bn in FY’2018/19 with the highest percentage of the outlay expected to support critical infrastructure. Recurrent expenditure, on the other hand, is estimated to increase by 10.4% to Kshs 1.7 tn from Kshs 1.5 tn as per the revised FY’2018/19 budget.
- Public Debt
From the estimates, the total public debt requirement for the FY 2019/20 is set to decline marginally by 0.03% to Kshs 607.8 bn from Kshs 608.0 bn in FY 2018/19. This is attributable to an 11.7% decline in net domestic borrowing to Kshs 283.5 bn from Kshs 321.0 bn in FY’2018/2019 coupled with a 13.0% rise in net foreign borrowing to Kshs 324.3 bn from Kshs 287.0 bn in FY’2018/19.
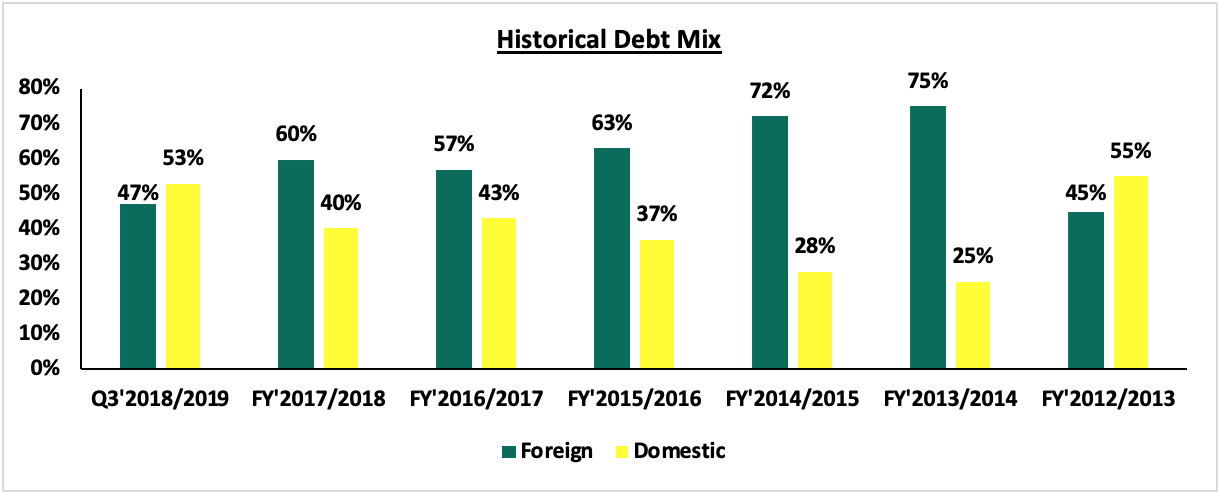
Key to note, public debt requirement mix, however, is changing, comprising of 53% foreign debt and 47% domestic debt, compared to 47% foreign debt and 53% domestic debt as per the revised FY’2018/19 budget. Foreign financing is higher mainly driven by increased project loans by Kshs 4.8 bn. below is a chart with the debt mix as per recent years budget estimates:
For a comprehensive analysis on this please read our FY 2019/20 Pre-Budget Discussion Note
Rates in the fixed income market have remained relatively stable as the government rejects expensive bids as they are currently 17.1% ahead of its domestic borrowing target for the current financial year, having borrowed Kshs 349.2 bn against a pro-rated target of Kshs 298.2 bn. A budget deficit is likely to result from depressed revenue collection, creating uncertainty in the interest rate environment as additional borrowing from the domestic market goes to plug the deficit. Despite this, we do not expect upward pressure on interest rates due to increased demand for government securities, driven by improved liquidity in the market owing to the relatively high debt maturities. Our view is that investors should be biased towards medium-term fixed income instruments to reduce duration risk associated with long-term debt, coupled with the relatively flat yield curve on the long-end due to saturation of long-term bonds.
Market Performance:
During the week, the equities market recorded a positive performance, with NASI, NSE 20 and NSE 25 gaining by 0.4%, 0.9% and 0.9%, taking their YTD performance to gains/ (losses) of 7.1%, (4.7%) and 2.7%, for NASI, NSE 20 and NSE 25, respectively. The performance of NASI was driven by gains in large-cap stocks such as Bamburi, EABL, Equity Group and Barclays Bank, which recorded gains of 9.4%, 3.0%, 3.0% and 2.5%, respectively. The gain in the NASI was however weighed down by declines in BAT, Standard Chartered Bank Kenya (SCBK) and Safaricom, which recorded declines of 2.6%, 1.6% and 1.5%, respectively.
Equities turnover declined by 65.8% during the week to USD 12.9 mn, from USD 37.6 mn the previous week, due to reduced market activity and a shortened trading week, taking the YTD turnover to USD 680.0 mn. Foreign investors remained net buyers for the week, with a net buying position of USD 0.3 mn, a 97.5% decline from a net buying position of USD 11.2 mn last week.
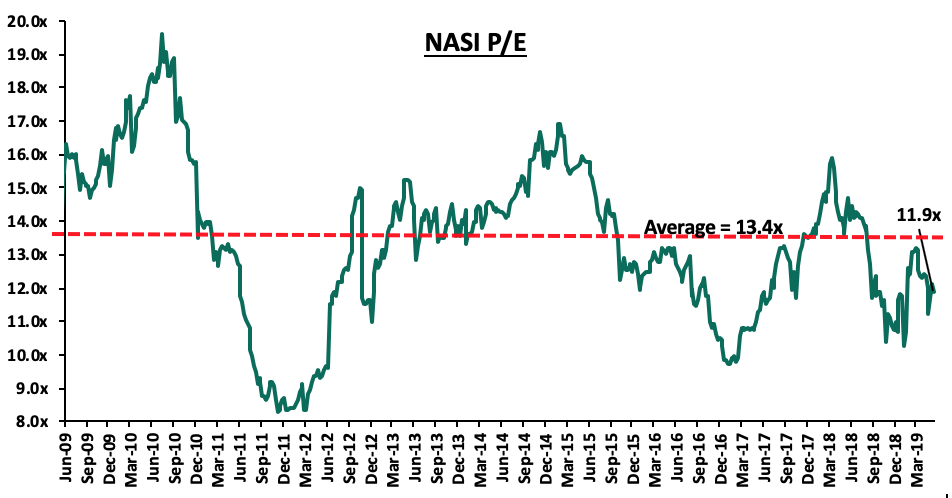
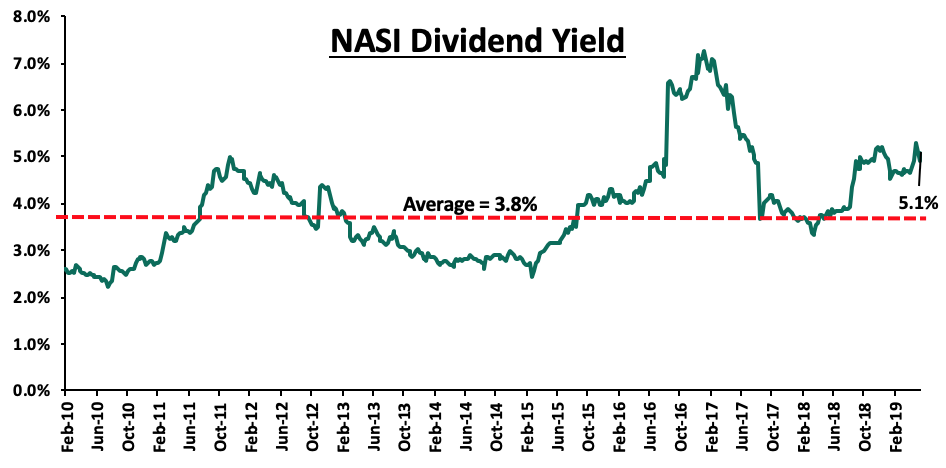
The market is currently trading at a price to earnings ratio (P/E) of 11.9x, 10.9% below the historical average of 13.4x, and a dividend yield of 5.1%, above the historical average of 3.8%. With the market trading at valuations below the historical average, we believe there is value in the market. The current P/E valuation of 11.9x is 21.4% above the most recent trough valuation of 9.7x experienced in the first week of February 2017, and 43.4% above the previous trough valuation of 8.3x experienced in December 2011. The charts below indicate the historical P/E and dividend yields of the market.
Weekly Highlights
National Bank of Kenya (NBK) shareholders approved the buyout offer by KCB Group, in agreement with the company’s Board of Directors who also unanimously agreed on the buyout offer by KCB Group. NBK’s two main principal shareholders The National Treasury, and the National Social Security Fund who will own a combined 93.2% after the conversion of the preference shares into ordinary shares, voted in favor of the transaction, as both the major shareholders and the board of directors expect the acquisition to be beneficial to both shareholders and the bank’s clients. If successful, the transaction will see KCB Group significantly increase its balance sheet, with management highlighting in a circular sent to shareholders, that they expected to reach the Kshs 1.0 tn mark by the end of 2022, consequently cementing KCB Group’s position as the largest bank by assets. In a bid to streamline the operations of the group, management also highlighted that there may be job cuts, as the bank removes overlapping roles, reduce the associated expenses, and consequently improve the overall efficiency. We expect completion of the transaction to negatively affect KCB Group’s asset quality in the short term, largely due to NBK’s relatively larger Non-Performing Loans Ratio of 47.6% as at FY’2018. With adequate capital buffers, we do not expect a significant impact on KCB Group’s capital base, which would necessitate a capital raise by the bank. The merger should aid KCB in getting a majority of the government business handled by NBK, and presumably aid in keeping the cost of funds relatively low, as NBK’s cost of funds of 3.3%, as at Q1’2019, and KCB’s cost of funds of 3.1%, should see the combined entity maintain the cost of funds below the market average of 3.4%, as at Q1’2019. We maintain our view that Kenya remains overbanked, and there is the need to remove the struggling banks that are undercapitalized, do not serve any niche, and do not have any systemic importance, so as to improve the sector’s overall stability.
Co-operative Bank of Kenya highlighted its plan of growing the business of its leasing-focused subsidiary Co-op Bank Fleet. Co-op Bank Fleet intends to leverage on the synergies created by Co-operative Bank’s client base to grow its business, with the main business case of the subsidiary being the easing of the cash flow constraints of acquisitions of fleets, repair and maintenance, thus allowing businesses to focus on their core business. Thus, with lower costs, firms would be able to acquire more fixed assets, which would aid in boosting their productivity. With a leasing deal of Kshs 890.0 mn already sealed with the government, the subsidiary focusses not only on government entities but also on non-government entities. As the business gains traction, we are of the view that this would continue to aid Co-operative Bank in growing its Non-Funded Income (NFI) as the bank continues to focus on this segment of income. We note that continued focus on this segment has seen its contribution to total operating income rise to 37.7% in Q1’2019, from 32.2% in Q1’2018. This should continue to buffer the bank’s bottom line from significant declines, as interest revenue remains depressed in the current interest-capped regime.
Universe of Coverage
Below is a summary of our SSA universe of coverage:
|
Banks |
Price as at 31/05/2019 |
Price as at 7/06/2019 |
w/w change |
YTD Change |
Target Price* |
Dividend Yield |
Upside/Downside** |
P/TBv Multiple |
Recommendation |
|
Diamond Trust Bank |
120.0 |
120.0 |
0.0% |
(23.3%) |
241.5 |
2.2% |
103.4% |
0.6x |
Buy |
|
UBA Bank |
6.3 |
6.3 |
0.0% |
(18.8%) |
10.7 |
13.6% |
84.8% |
0.4x |
Buy |
|
Zenith Bank |
20.1 |
20.4 |
1.2% |
(11.7%) |
33.3 |
13.3% |
77.0% |
0.9x |
Buy |
|
CRDB |
120.0 |
120.0 |
0.0% |
(20.0%) |
207.7 |
0.0% |
73.1% |
0.4x |
Buy |
|
CAL Bank |
0.8 |
0.8 |
(1.2%) |
(17.3%) |
1.4 |
0.0% |
72.8% |
0.7x |
Buy |
|
NIC Group |
30.5 |
30.6 |
0.2% |
9.9% |
48.8 |
3.3% |
63.0% |
0.8x |
Buy |
|
KCB Group*** |
39.5 |
39.5 |
0.0% |
5.5% |
60.0 |
8.9% |
60.8% |
1.0x |
Buy |
|
GCB Bank |
5.0 |
5.1 |
0.2% |
9.8% |
7.7 |
7.5% |
60.4% |
1.2x |
Buy |
|
Access Bank |
6.1 |
6.3 |
3.3% |
(7.4%) |
9.5 |
6.3% |
57.1% |
0.4x |
Buy |
|
Co-operative Bank |
12.5 |
12.5 |
0.0% |
(12.9%) |
18.5 |
8.0% |
56.6% |
1.1x |
Buy |
|
I&M Holdings |
57.0 |
58.0 |
1.8% |
36.5% |
83.9 |
6.0% |
50.6% |
1.2x |
Buy |
|
Equity Group |
38.9 |
40.0 |
3.0% |
14.8% |
58.1 |
5.0% |
50.3% |
1.7x |
Buy |
|
Barclays Bank |
10.2 |
10.5 |
2.5% |
(4.6%) |
13.1 |
10.5% |
35.9% |
1.4x |
Buy |
|
Ecobank |
8.0 |
8.0 |
0.0% |
6.7% |
10.7 |
0.0% |
34.1% |
1.8x |
Buy |
|
Guaranty Trust Bank |
31.6 |
30.4 |
(3.8%) |
(11.8%) |
37.1 |
7.9% |
29.9% |
1.9x |
Buy |
|
Stanbic Bank Uganda |
30.0 |
29.1 |
(3.0%) |
(6.2%) |
36.3 |
4.0% |
28.7% |
2.1x |
Buy |
|
Stanbic Holdings |
98.0 |
98.3 |
0.3% |
8.3% |
115.6 |
6.0% |
23.6% |
0.9x |
Buy |
|
Bank of Kigali |
265.0 |
265.0 |
0.0% |
(11.7%) |
299.9 |
5.2% |
18.4% |
1.5x |
Accumulate |
|
National Bank |
4.1 |
4.4 |
8.3% |
(16.5%) |
5.2 |
0.0% |
17.1% |
0.3x |
Accumulate |
|
SBM Holdings |
5.9 |
5.9 |
0.0% |
(1.7%) |
6.6 |
5.1% |
17.1% |
0.8x |
Accumulate |
|
Union Bank Plc |
6.3 |
7.0 |
12.0% |
25.0% |
8.2 |
0.0% |
16.4% |
0.7x |
Accumulate |
|
Standard Chartered |
186.5 |
190.0 |
1.9% |
(2.3%) |
203.8 |
6.6% |
13.8% |
1.4x |
Accumulate |
|
Bank of Baroda |
129.0 |
128.2 |
(0.6%) |
(8.4%) |
130.6 |
1.9% |
3.8% |
1.1x |
Lighten |
|
FBN Holdings |
7.1 |
7.0 |
(1.4%) |
(12.6%) |
6.6 |
3.6% |
(1.0%) |
0.4x |
Sell |
|
Ecobank Transnational |
11.2 |
10.0 |
(10.3%) |
(41.2%) |
9.3 |
0.0% |
(7.2%) |
0.4x |
Sell |
|
Standard Chartered GH |
21.7 |
21.7 |
(0.2%) |
3.1% |
19.5 |
0.0% |
(10.1%) |
2.7x |
Sell |
|
Stanbic IBTC Holdings |
42.0 |
42.5 |
1.2% |
(11.4%) |
37.0 |
1.4% |
(11.5%) |
2.2x |
Sell |
|
HF Group |
4.4 |
4.4 |
0.0% |
(20.6%) |
2.9 |
8.0% |
(26.1%) |
0.2x |
Sell |
*Target Price as per Cytonn Analyst estimates
**Upside / (Downside) is adjusted for Dividend Yield
***Banks in which Cytonn and/or its affiliates holds a stake.
****Stock prices indicated in respective country currencies
We are “Positive” on equities for investors as the sustained price declines have seen the market P/E decline to below its historical average. We expect increased market activity, and possibly increased inflows from foreign investors, as they take advantage of the attractive valuations, to support the positive performance.
In Fintech, Velocity Capital Fintech Ventures, a Netherlands-based private equity firm investing in Fintech companies in Europe, Africa and North America, announced the launch of its USD 120.0 mn (Kshs 12.2 bn) venture fund aimed at investing in early-stage companies focusing on banking, payments, credit and other Fintech areas. Through this fund, Velocity has already invested in two companies. On June 3rd 2019, it announced its investment of USD 3.4 bn (Kshs 344.1 bn) in Owlin, a technology company based in Amsterdam and had previously in May 2019 made an investment of GBP 4.0 mn (Kshs 459.2 mn) in Twisto, a credit and payment solutions provider based in Prague.
In Africa, Velocity Capital has invested in three Fintech companies namely Yoco, a South African point-of-sale provider, Mines, a digital Credit-as-a-Service platform for domestic banks, mobile operators, retailers, and payment processors, and, Cellulant, a leading Pan-African digital payments service provider. With the creation of the fund, we expect increased investment in fintech companies across Africa and the resultant growth of Africa’s Fintech segment due to increased access to capital.
We maintain a positive outlook on private equity investments in Africa as evidenced by the increasing investor interest, which is attributed to; (i) economic growth, which is projected to improve in Africa’s most developed PE markets, (ii) attractive valuations in Sub Saharan Africa’s private markets compared to its public markets, and (iii) attractive valuations in Sub Saharan Africa’s markets compared to global markets.
- Industry Report
During the week, Knight Frank, a real estate management firm, released its periodic report titled ‘Prime Global Cities Index (PGCI) Q’1 2019’, which tracks the movement of luxury residential prices in 45 cities around the world. The report covered the general performance of the high-end residential market and did not specify the performance of sub-markets. Major take-outs from the report were as follows:
- Luxury home price growth has slowed in recent years averaging to 1.3% p.a across the 45 cities tracked. This is the lowest annual growth rate since Q4’ 2009 which recorded lower than 1.3% growth rate due to the financial crisis recorded across the world,
- Berlin and Moscow were the best performing cities in the index, recording annual price growths of 14.1% and 12.0%, respectively between Q1’ 2018 and Q1’ 2019 attributed to the limited supply of luxury residential properties and relative affordability,
Focusing on the Nairobi City market;
- Prime residential houses in Nairobi recorded a 6.5% annual decline in prices between Q1’ 2018 and Q1’ 2019, 5.6% points more than 0.9% annual decline recorded between Q1’ 2017 and Q1’ 2018. In Q1’ 2019 the prices retained the declining trend, recording a 0.5% q/q decline, 1.3% points lower than 1.8% decline recorded in Q’4 2018. The annual decline in prime residential properties is attributed to a continued oversupply of luxury residential properties and relatively few transactions in the high-end residential market,
The graph below summarizes luxury residential unit performance over the last four years
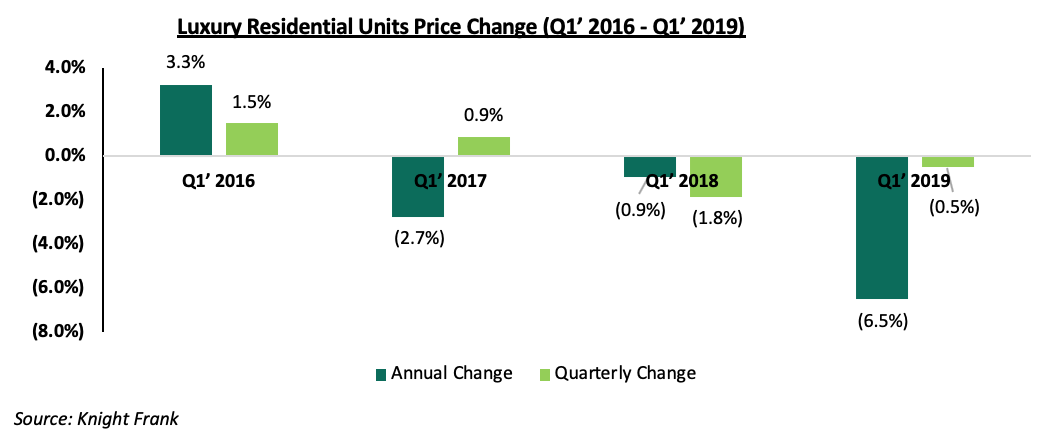
- Prime residential home prices have declined by 9.2% over the last 3 years since its peak in Q1’2016 recording a 3.3% annual price growth rate. The prices are, however, 38.0% higher than in 2010, representing capital gains in the high-end market segment, and
- On the Prime residential sector outlook, the market is expected to soften further, owing to the high value of the properties, the current oversupply levels in the segment and the ongoing credit crunch.
The report is in line with our Cytonn Q1’2019 Markets Review, where the high-end market recorded a subdued performance in Q’1 2019, registering an annual price depreciation of 1.5%, as a result of the decline in asking prices in markets such as Kitisuru and Lower Kabete as developers attempt to attract buyers.
We expect reduced developer activity in the high-end residential market due to limited credit advancement on both development and offtake occasioned by capping of the interest rate. However, we expect the lower mid-end markets to continue experiencing increased demand and uptake as home buyers seek affordability.
- Residential Sector
During the week, Deltar Real Estate, a real estate developer, announced their plan to develop a 90-unit, 15-storey residential apartment located along Batubatu Gardens in Parklands, Nairobi. The development dubbed, ‘Sydney Residence’ will comprise of 170 SQM 4-bed units selling at Kshs 16.0 mn each. This translates to a price per SQM of Kshs 94,118, 19.9% lower than the parklands market average of Kshs 112,931 per SQM, according to our Cytonn Q1’2019 Markets Review. This is attributable to a decline in effective demand for upper mid-end property amid the growing supply, pushing developers to come up with innovative pricing models in order to match the purchasing power of the buyers
Parklands presents an ideal investment opportunity for residential development due to;
- High effective demand for residential units. In Q1’ 2019, Parklands area registered an average annual uptake of 25.0%, compared to the upper mid-end suburb market average of 23.7%, and
- Good infrastructure network and proximity to the Nairobi Central Business District (CBD) and major business nodes creating demand for residential units to house the working population in these business nodes.
However, Parklands area recorded lower than average rental yields driven by low rental rates attributable to the increased commercialization of the area, making parklands unattractive to tenants, as investors seek to gain from a more attractive return from commercial offices which recorded a rental yield of 9.1% within the same period, 2.7% points higher than residential returns of 6.4%. We, therefore, expect the parklands real estate market to record entry of Mixed-use developments, embracing the convenience of work live and play concept while tapping into the demand for residential units and commercial space in the area.
The table below shows a summary of residential - apartments performance in upper mid-end suburb markets;
|
Apartments: Top 5 Upper Mid-End Suburb Markets Performance Q1’2019 |
||||||||
|
Location |
Average Price Per SQM Q1'2019 |
Average Rent Per SQM Q1'2019 |
Average Annual Uptake Q 1'2019 |
Average Occupancy 2019 |
Average Rental Yield Q1'2019 |
Q/Q Price Change |
Annual Price Appreciation |
2018 /2019 Total Returns |
|
Riverside |
138,125 |
793.2 |
20.2% |
88.4% |
6.0% |
1.7% |
8.8% |
14.8% |
|
Kilimani |
124,197 |
598.4 |
28.2% |
70.2% |
3.9% |
1.6% |
8.8% |
12.6% |
|
Westlands |
147,374 |
744.4 |
21.2% |
89.7% |
5.2% |
(1.6%) |
4.3% |
9.5% |
|
Parklands |
112,931 |
465.8 |
25.0% |
94.4% |
4.5% |
0.8% |
1.9% |
6.4% |
|
Kileleshwa |
115,634 |
819.7 |
24.2% |
71.0% |
5.2% |
0.8% |
0.8% |
5.9% |
|
Average |
127,652 |
684.3 |
23.7% |
82.8% |
4.9% |
0.7% |
4.9% |
9.8% |
|
· Parklands recorded annual uptake and total returns of 25.0% and 6.4%, respectively compared to the market average at 23.7% and 9.8%, respectively · The lower than average rental yields was driven by low rental rates attributable to the increased commercialization of the area, making parklands unattractive to tenants, as investors seek to gain from a more attractive return from commercial offices |
||||||||
(All Values in Kshs Unless Stated Otherwise)
Source: Cytonn Research 2019
Also, during the week, the International Finance Corporation (IFC), an international development financial institution, disclosed that it is set to invest in straight equity of up to USD 2 mn (Kshs 202 mn) equivalent in common shares of Kenya Mortgage Refinancing Company (KMRC). The KMRC is a non-bank financial institution, incorporated as a limited liability company to provide affordable long-term funding and capital market access to primary mortgage lenders such as banks and financial co-operatives. The KMRC was launched last month and has so far mobilized Kshs 37.2 bn receiving funding support from the World Bank, the African Development Bank (AfDB), and Shelter Afrique.
In our view, the increasing financial support from development finance institutions and the private sector, which were billed to be the key shareholders of KMRC since its incorporation in April 2018, is a step in the right direction towards the successful operationalization of the facility. The mortgage refinancing company is set to be 80.0% owned by the private sector (Banks, SACCOs and Development Finance Institutions), while the Government of Kenya will have a 20.0% stake, thus, we expect the recent developments to attract other stakeholders to commit their expected contributions to the mortgage refinancing company. For more information on KMRC, see our topical, Kenya Mortgage Refinancing Company Update.
We maintain a neutral outlook on the residential sector as we expect reduced developer activity in high and middle-upper markets with a continued focus on the provision of affordable housing for the low and lower-middle-income segment of the market
- Commercial Office Sector
Workable Nairobi, a commercial serviced office provider, has launched a new state-of-the-art corporate serviced office at Sanlam Tower, Waiyaki Way, Westlands. The facility occupies 12,000 SQFT and consists of 110 desks, two meeting rooms, a full-service in-house café and an events terrace. Rates for the space range from USD 1,200 (Kshs 121,476)/month for two occupants to USD 9,000 (Kshs 911,070)/month for fourteen occupants, with additional amenities including printing and Wi-Fi.
Serviced offices are increasingly becoming popular in Nairobi driven by;
- High returns – The commercial office sector has recently experienced subdued performance over the last two years, driven by 4.7% and 0.4% points decline in occupancy rates and rental yields, respectively to 83.3% and 8.1% in 2018 from 88.0% and 8.5%,respectively in 2016, attributable to an oversupply of 5.2mn SQFT of office space as at 2018. Investors are therefore embracing differentiated concepts such as serviced offices, which offer attractive returns, as a result of its low supply and low market share of just 0.35% of commercial office stock in Nairobi. Serviced offices in Nairobi commercial zones, recorded an average rental yield of 13.9% in 2018, 5.8% points higher than the un-serviced spaces at 8.1%,
- Great deal of flexibility because one can: i) quickly and easily change their premises depending on business requirements, ii) can be configured to suit one’s own personal needs and vary in size, iii) they are fairly cost effective as they are utilized when need be, and iv) the business is able to get a fully functional office space immediately the need arises, and
- Increasing demand from, multinationals seeking to establish business locations in the various cities of operations, start-up companies and SME’s - Small to medium businesses or enterprises which don't want to make a financial commitment to a longer-term lease and home-based businesses.
We expect investors to embrace differentiated concepts such as serviced offices to cushion the commercial office sector’s performance through increased occupancy rates and higher rental yields.
We expect the real estate sector to continue recording increased activities supported by the continued investments in differentiated concepts and focus on the provision of affordable housing by both the private sector players and the government.
In line with our regional coverage strategy, we continue to carry out research on various markets in Kenya. So far we have done research in counties such as Mombasa, Nakuru, Kisumu, Laikipia, Meru, Nyeri and Uasin Gishu. The exercise is aimed at identifying the best real estate investment opportunities for our investors outside Nairobi and taking advantage of the benefits of the devolution in these counties. This week, we focus on Nanyuki town in Laikipia County, by highlighting our findings on the Nanyuki real estate market, having collected and analyzed our research data as at January 2019. In summary, in terms of investment returns, we found that the Nanyuki real estate market recorded an average rental yield of 4.7% for the residential sector, 7.6% in the commercial sector and a capital appreciation of 4.7% in the land sector, compared to the Nyeri market average of 5.1%, 6.3% and 19.1%, respectively.
To comprehensively review the real estate investment opportunity in Nanyuki Town, we will cover the following;
- Overview of Laikipia County, zeroing into Nanyuki Town,
- Factors Driving Real Estate Investment in Nanyuki,
- Challenges Facing the Real Estate Sector in Nanyuki
- Nanyuki Real Estate Market Performance,
- Regional Comparative Analysis, and,
- Investment Opportunity and Outlook.
- Overview of Laikipia County, zeroing into Nanyuki Town
Laikipia County borders Samburu County to the North, Isiolo County to the North East, Meru County to the East, Nyeri County to the South East, Nyandarua County and Nakuru County to the South West and Baringo County to the West. The county has a total population of 479,072 and a population growth rate of 2.5% as at 2017 according to the Laikipia County Statistical Abstract. According to Kenya National Bureau of Statistics, the Laikipia county Gross County Product per Capita (2017), stands at USD 1,533, thus ranked 17th county in Kenya, with the 1st being Nyandarua County with a GCP per Capita of USD 3,467. Tourism is one of the highest contributors to County’s economy as it is richly endowed with wildlife, distributed in most parts of the county extending to Aberdare, Samburu, Meru and Mt. Kenya Wildlife corridors.
In terms of infrastructure, Laikipia is served by water from the Nanyuki water and sewerage Company limited (NAWASCO) and Nyahururu water and sewerage company (NYAHUWASCO). The area has good mains electricity, landline and mobile telephony. Main roads in the area are bitumen and in a good state of repair and maintenance while feeder roads in the ranches are paved and earthen roads that are navigable. Key to note, in the wake of a growing population and evolving economic state of the county, the county government is in the process of revising the zoning regulations that are intended to guide land use standards, zoning schemes and ordinances for all urban settlements in the county, to facilitate physical planning.
The main towns in Laikipia County include; Nanyuki town, which temporarily hosts the county headquarters, Dol Dol, Rumuruti and Nyahururu. For this topical, we will focus on Nanyuki Town, which lies northwest of Mount Kenya and currently has a projected population of 63,022. Nanyuki is famous for farms, ranches, game parks and wildlife conservancies in the region, in addition to hosting the British Army Training Grounds.
B. Factors Driving Real Estate Investment in Nanyuki
Over the last 5-years, Nanyuki has witnessed increased real estate activities in the town and its environs driven by:
- Tourism – Nanyuki hosts key tourist attractions such as the Ol Pejeta Conservancy and Mount Kenya National Park. The town thus acts as a major tourist circuit to Mt. Kenya and the Northern Region, enhancing demand for hospitality services which continues to promote the hospitality sector,
- Growth of Small and Medium Enterprises (SMEs) – The informal sector is estimated to constitute 98% of business in Kenya, contributing to 83.4% of jobs as per the 2018 KNBS Economic Survey. There is an increase in the number of SME’S due to ease in business registration that takes a maximum of 2 weeks. Nanyuki hosts several of these companies such as Mawingu Networks that require office space and housing for the employees, hence drive the demand for real estate,
- Devolution - Decentralisation has opened up major towns across the 47 counties attracting government institutions, private investors and entrepreneurs across all the county headquarters. This has increased the urbanisation rate hence attracting financial institutions such as ECLOF Kenya and Faulu Kenya, to the county level to tap into the unbanked population. The positive demographics, attributable to devolution have thus, created demand for office space, retail space and residential units to host investors and government officials, and
- Hosts the British Army Training Grounds- The British Army Training Unit Kenya (BATUK) is a training support unit of the British Army located in Nanyuki under long-standing cooperative agreements with the country. The presence of the same has resulted in a growing demand for housing by the army officers mainly hosting their families in the town.
C. Challenges Facing Real Estate Sector in Nanyuki
Despite the above factors supporting the real estate sector in Nanyuki, the sector continues to face challenges which include;
- Lack of Structured Planning Regulations – The town currently lacks updated structured planning regulations outlining areas zoned for commercial, residential and special needs. This is likely to lead to urban sprawl in the town and thus reduced land use maximization. The Laikipia County Government is, however, working on revising the zoning regulations to formulate land use standards, zoning schemes and ordinances for all urban settlements in the county,
- Inadequate Infrastructure - Despite most of the roads in Nanyuki being tarmacked, majority of these are in a bad state of repair. In addition, the sewerage system is insufficient thus does not serve some parts of the town, thus making the area unattractive to investors due to additional development costs resulting in the slow growth of real estate,
- Unavailability of Development Land – the unavailability of development class land in the town attributed to the area being largely an agricultural area and inadequacy of trunk infrastructure, leading to slow investment growth.
D. Nanyuki Real Estate Market Performance
Our market research focused on;
- Plinth Area - Research on the size of the units found in the market allows us to gauge the current offering, and establish the home buyer’s preferences for sizes of houses,
- Annual Uptake - This allows the investor to appreciate the rate at which available property is sold over a specific period, thus helps him/her gauge how fast they can exit the market,
- Occupancy - This measure the number of units or the size of the development that is let out, in order to inform on the expected rental yield of the building,
- Prices - Research on prices will be used in comparison with our products against the market prices,
- Rental Rates - Research on rental rates allows us to inform prospective investors on the rental yield they can gain from investing in the Nanyuki Real Estate Market.
We covered the residential, commercial (retail and offices), hospitality(holiday homes) and the land sectors. The performance per theme was as follows:
- Residential Sector
The residential housing development market in Nanyuki is still nascent with most of the estates, having existed for less than 3 years. The key drivers of the growth include; the British Army station, government decentralisation, urbanisation and growth of the middle class in the region.
The key residential areas are distributed within the Nanyuki CBD, Maiyan and near the airstrip, and mainly comprise of owner-built and occupied stand-alone houses, as the market lacks institutional developers. The residential market in and around Nanyuki town is mainly rental, as most of the investors target foreigners on long term stay of approximately 2 years.
The performance was as follows:
|
All values in Kshs unless stated otherwise |
||||||
|
Nanyuki Residential Apartments Market Performance 2019 |
||||||
|
Typology |
Unit Plinth Area |
Price per SQM (2019) |
Monthly Rent (2019) |
Monthly Rent per SQM (2019) |
Annualized Uptake (2019) |
Rental Yield (2019) |
|
Studio |
48 |
10,333 |
218 |
4.5% |
||
|
1 bedroom |
65 |
14,500 |
225 |
4.5% |
||
|
2 bedroom |
78 |
56,034 |
20,700 |
278 |
50% |
6.0% |
|
3 bedroom |
144 |
59,028 |
25,000 |
174 |
25% |
3.5% |
|
Average |
57,531 |
224 |
38% |
4.6% |
||
|
*Rental yields assume 100% occupancy · Apartments recorded a 4.6% average rental yield, with the 2- bed units recording the highest rental yield of 6.0%, compared to studios, 1 bed and 3-bedroom units at 4.5%, 4.5% and 3.5%, respectively. This is attributed to the relatively high monthly rate per SQM of the 2-bedroom units at Kshs 278, compared to the market averages at Kshs 224 per SQM, fueled by the high demand of the typology in the market by young families thus attracting the relatively high rent prices |
||||||
Source: Cytonn Research, 2019
The market stand-alone units’ performance was as follows:
|
All values in Kshs unless stated otherwise |
||||||
|
Stand Alone Residential Units Performance 2019 |
||||||
|
Typology |
Unit Plinth Area |
Price per SQM (2019) |
Monthly Rent (2019) |
Monthly Rent per SQM (2019) |
Annualized Uptake (2019) |
Rental Yield (2019) |
|
3 bedroom |
262 |
66,667 |
75,000 |
262 |
20% |
3.0% |
|
5 bedroom |
415 |
66,667 |
150,000 |
371 |
6.7% |
|
|
Average |
66,667 |
316 |
20% |
4.8% |
||
|
*Rental yields assume 100% occupancy · The average rental yield of the standalone units is 4.8%, at an average price per square metre of Kshs 66,667 and an average rent per square meter of Kshs 316, · The market has a low supply of standalone units, attributable to the low demand for the same as most residents prefer to purchase land and build their own homes, · Key to note, the available standalone units in the market are rental and have been introduced into the market in the last 1 year |
||||||
Source: Cytonn Research, 2019
On the overall, the Nanyuki residential market recorded an average rental yield of 4.7% and an annualized uptake rate of 29.0%. Below is the summary table:
|
All values in Kshs unless stated otherwise |
||||
|
Residential Market Performance Summary |
||||
|
Price per SQM (2019) |
Monthly Rent per SQM (2019) |
Annualized Uptake (2019) |
Rental Yield (2019) |
|
|
Apartments |
57,531 |
224 |
38% |
4.6% |
|
Stand Alone Units |
66,667 |
316 |
20% |
4.8% |
|
Average |
62,099 |
270 |
29% |
4.7% |
|
· For residential properties, the average price and rent price per SQM for the units came in at Kshs 62,099 and Kshs 270, respectively · The standalone units recorded a higher rental yield of 4.8%, compared to apartments at 4.6%, attributed to the high rent prices of the standalone units, which mainly target army officers hosting their families in the town |
||||
Source: Cytonn Research, 2019
ii. Commercial Sector
The commercial sector in Nanyuki is yet to record entry of quality commercial space especially in the office sector where most of the offices are classified grade C and below. In the last 2-years, we have seen the establishment of new buildings such as the Ubii Plaza, which lack modern facilities such as lifts. The retail sector is served by two formal shopping malls; Nanyuki Mall and Cedar Mall with some of the key retailers being Botswana’s Choopies, Chandarana Food Plus Supermarket and American fast food restaurant chain, Kentucky Fried Chicken (KFC).
The performance of the sector was as follows:
|
All values in Kshs unless stated otherwise |
||
|
Mixed Use Developments Performance 2019 |
||
|
Element |
Retail Sector |
Office Sector |
|
Rent per SQFT |
95 |
81 |
|
Occupancy (%) |
73.0% |
73.0% |
|
Rental yield (%) |
8.3% |
7.0% |
|
· The commercial properties recorded an average rental yield of 7.6%, at an average occupancy rate of 73.0%, assuming an exit price of Kshs 9,951 per SQFT obtained from the MUD and Office development valuation, and Kshs 10,068 per SQFT for Nanyuki and Cedar Malls · The average rent price per SQFT for the retail space is Kshs 95, while the service charge stands at an average of Kshs 21, which is 22.0% of the average cost of the space. The sector recorded an 8.3% average rental yield, at an occupancy rate of 73.0% · For the commercial office sector, the average rental yield came in at 7.0%, 1.3% points lower than that of the retail sector. On average, the rent per SQFT for the commercial office space came in at Kshs 81 |
||
Source: Cytonn Research, 2019
iii. Land Sector
Land prices in Nanyuki town are highly dependent on the proximity to the main roads and proximity to the CBD. In the CBD, the land price is relatively high at an average price of up to Kshs 100 mn per acre, while an acre in the outskirts costs approximately Kshs 1.6 mn. Most of the land in Nanyuki has been utilized as ranches which are privately owned and could be as large as over 100 acres each. Despite having several ranches, the market has continued to embrace the selling of plots mainly 1/4 and 1/8 acres, with several property agents having entered the market.
The plots for sale recorded average annual sales of 45.8%, attributed to a growing demand for development land in the area fueled by speculations for higher property value boosted by the opening of the Northern Corridor.
|
All values in Kshs unless stated otherwise |
||||
|
Land Price Performance - Nanyuki |
||||
|
Size of plot |
Selling Price 2016 |
Selling Price 2019 |
Annual Sales (%) 2019 |
Compounded Annual Price Appreciation |
|
1/8 |
300,000 |
350,000 |
53.1% |
5.3% |
|
1/4 |
425,000 |
484,750 |
39.3% |
4.5% |
|
1/2 |
722,500 |
824,075 |
45.0% |
4.5% |
|
Average |
45.8% |
4.7% |
||
|
· The plots for sale in the market are mainly in 1/8 acres, 1/4 acres and 1/2acres at an average price of Kshs 0.4 m, Kshs 0.5 mn and Kshs 0.8 mn respectively, · The 1/8 acre plots recorded the highest annual uptake at 53.1%, and a relatively high price appreciation of 5.3%, attributed to their relatively high demand by individuals who prefer to build their own residential houses and speculators who expect to reap from the capital appreciation · On average, the land in Nanyuki recorded an annual capital appreciation of 4.7%, attributable to the growing demand for development land mainly by speculators who expect to benefit from the high capital appreciation, in addition to individuals looking to build their own residential homes |
||||
Source: Cytonn Research 2019
iv. Holiday Homes
Nanyuki hosts key tourist attractions such as the Ol Pejeta Conservancy and Mount Kenya National Park, making the town a major tourist circuit to Mt. Kenya and the Northern Region. This has continued to create demand for hospitality services and facilities, thus the development of holiday homes such as Maiyan Homes and the Mt. Kenya Wildlife Estates.
The performance of holiday homes was as follows:
|
All values in Kshs unless stated otherwise |
|||
|
Holiday Homes Market Performance 2019 |
|||
|
Element |
2017 |
2019 |
Annualized ∆ |
|
Selling Price per SQM |
95,374 |
107,645 |
6.4% |
|
Rent Price per SQM |
557 |
653 |
8.6% |
|
Average Daily Rate (ADR) |
4,212 |
5,460 |
14.8% |
|
Revenue per Available Room (RevPAR) |
1,685 |
2,271 |
17.4% |
|
· The Average Daily Rate stood at Kshs 5,460 in 2019, 14.8% higher than the Kshs 4,212 recorded in 2017, while Revenue per Available Room came in at Kshs 2,271, 34.7% higher than the Kshs 1,685 recorded in 2017, · We attribute the increase in revenues to an annualized increase in rent prices of 8.6%, to Kshs 653 per SQM from Kshs 557 in 2017, due to the growing demand for hospitality services and facilities as the concept of holiday homes continues to become popular |
|||
Source: Cytonn Research, 2019
v. Nanyuki Real Estate Market Performance Summary
|
Nanyuki Real Estate Market Performance Summary |
|||
|
Theme |
Occupancy Rates |
Rental Yield |
Annual Capital Appreciation |
|
Residential |
100% |
4.7% |
|
|
Commercial Office |
73% |
7.0% |
|
|
Retail Sector |
73% |
8.3% |
|
|
Land Sector |
4.7% |
||
|
Average |
85% |
6.7% |
4.7% |
|
· The market recorded an annual capital appreciation of 4.7% in the land sector, attributed to the increased demand for property, fuelled by the positive demographics, devolution and speculations with the opening of the northern corridor, · The Nanyuki real estate sector recorded an average rental yield of 6.7%, with the retail sector recording the highest rental yield at 8.3%, attributed to the high demand for retail space in the town, which is currently undersupplied with only two shopping malls; Nanyuki Mall and Cedar Mall |
|||
Source: Cytonn Research 2019
E. Regional Comparative Analysis
Comparing across the 6 counties we have tracked so far;
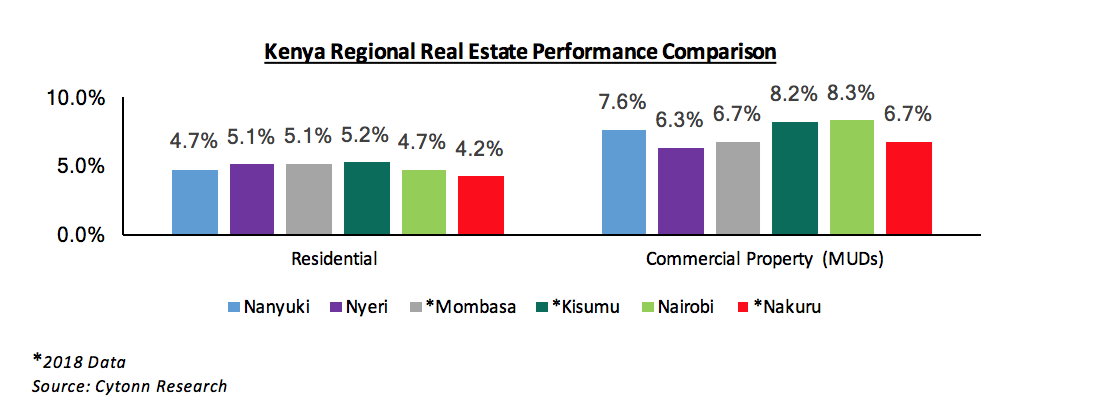
- In the residential sector, Kisumu recorded the highest rental yield at 5.2%, while Nanyuki, Nyeri and Nakuru recorded rental yields of 4.7%, 5.1% and 4.2%, respectively
- In the commercial sector, Nairobi recorded the highest rental yield at 8.3%, while Kisumu, Nanyuki, Nakuru and Mombasa followed at 8.2%, 7.6%, 6.7% and 6.7%, respectively
Below is the comparison of the performance of the 6 counties:
F. Investment Opportunity & Outlook
We have a positive outlook for 4 sectors; commercial office, retail, hospitality and land sector and a neutral outlook for the residential sector in Nanyuki. The opportunity is in the commercial, hospitality and land sectors (unserviced land), supported by the high tourist numbers in the region, drawn by the wildlife conservancies and national parks, increasing demand for development land and an existing market gap for quality commercial buildings.
The table below shows a summary of the outlook and investment opportunity:
|
Theme |
Performance (2019) |
Investment Opportunity |
Outlook |
|
Residential Sector |
The residential sector has an average rental yield of 4.7%, and an annualized uptake of 29.0% The Residential sector is still nascent, with most of the estates, having less than 5 years existence, and yet to adopt a build for sale model |
The market is yet to embrace the build for sale model, thus the focus should be on rental units The investment opportunity lies in rental apartments which recorded an average rental yield of 4.7% For standalone units, we have a negative outlook as the market lacks demand for the same, in addition to not embracing the built for sale concept, evidenced by the low current supply and a relatively low annual uptake of 20.0% |
Neutral |
|
Retail Sector |
The rent price per SQFT for the retail space stands at approximately Kshs 95. The sector recorded an average rental yield of 8.3%, at an occupancy rate of 73.0% |
Our outlook for the retail space is positive given the relatively high rental yields of 8.3%, as compared to areas such as Nakuru and Nyeri that have average rental yields of 5.8% and 6.3%, respectively There exists a demand for retail space in Nanyuki as the town has only two malls that is Nanyuki Mall and Cedar Mall. In addition, the Mt Kenya region currently has an undersupply of retail space in the wake of the increasing retail business aimed at serving the increasing urban population |
Positive |
|
Commercial Office Sector |
The commercial office sector has an average rental yield of 7.6% and an average occupancy of 73.0%. |
The market lacks quality offices with the old commercial blocks being in a poor state of repair, while the few new commercial properties lack facilities such as lifts. However, there are relatively high occupancy rates in both the new and the old blocks, at an average of 73.0%, thus signalling a growing demand for commercial office space |
Positive |
|
Land Sector |
Unserviced plots recorded an average annual capital appreciation of 4.7% at an annual uptake of 45.8% |
Selling of unserviced land present an investment opportunity in the Nanyuki, with increased demand for owner-built residential units, mainly on 1/8th acre plots which recorded relatively high annualized uptake of 53.1%, as the markets embrace the tradition of building their own homes and the demand for investment land especially in Nanyuki due to speculation given the improving state of infrastructure |
Positive |
|
Holiday Homes |
The Average Daily Rate stood at Kshs 5,460 in 2019, 14.8% higher than the Kshs 4,212 recorded in 2017, while Revenue per Available Room came in at Kshs 2,271, higher than the Kshs 1,685 recorded in 2017, |
Given the high tourist numbers in the region, drawn by the wildlife conservancies and national parks, holiday homes present an investment opportunity, targeting both leisure tourism, business tourists and conferencing |
Positive |
We have a positive outlook for the Nanyuki real estate market, driven by devolution, positive demographics, and the growing demand for development land in addition to the improving infrastructural development. For investment, we recommend investing in the land sector, hospitality and the commercial sector given the relatively high rental yield and existing market gap for quality commercial buildings.
Disclaimer: The views expressed in this publication are those of the writers where particulars are not warranted. This publication, which is in compliance with Section 2 of the Capital Markets Authority Act Cap 485A, is meant for general information only and is not a warranty, representation, advice or solicitation of any nature. Readers are advised in all circumstances to seek the advice of a registered investment advisor.

- Talk to us
- Kenya
- P.O Box 20695 - 00200, Nairobi, Kenya
- Cell +254709101200
- Tel +254709101200
- WhatsApp +254741676635
- United States
- +254709101200
- DOWNLOAD OUR APP
-


- Kenya
- 8th Floor, Pinetree Plaza, Kaburu Drive, Ngong Road, Nairobi, Kenya
- USA
- Suite 1150, 1775 Eye Street NW, USA, Washington DC 20006, USA
- Investments
- High Yield
- Private Equity
- Real Estate
- Real Estate
- RiverRun Estates
- Cytonn Towers
- The Ridge
- Taraji Heights
- The Alma