Cytonn Q1’2019 Markets Review
By Cytonn Research Team, Mar 31, 2019
Executive Summary
Global Markets Review
Global markets are expected to record a slower growth in 2019 compared to 2018, with the IMF projecting 2019 global growth to come in at 3.5%, a downward revision from the estimated 2019 growth of 3.7% as at October 2018, weighed down by the weakening financial market sentiments owing to (i) the current uncertainty on the direction of trade policy between the US and China, (ii) country-specific uncertainty such as Britain’s exit (“Brexit”) from the European Union, and, (iii) higher debt levels in emerging and developing economies, especially those dependent on commodity exports, such as Nigeria. In March 2019, the US Federal Open Market Committee (FOMC) maintained the Federal Funds Rate at the current range of 2.25% - 2.50%, indicating that the policy rate was likely to remain unchanged in 2019, a shift from the 2018 expectations of at least two hikes;
Sub-Saharan Africa Region Review
During the quarter, the International Monetary Fund (IMF) projected Sub-Saharan Africa (SSA) GDP to grow by 3.5% in 2019, and 3.6% in 2020, up from an expected growth of 2.9% in 2018. Most of the regional currencies, except the Malawian Kwacha, the Kenya Shilling, and the Nigerian Naira, depreciated against the dollar during the quarter on account of falling prices for major export commodities reducing the flow of dollars into the continent. Yields on the various sovereign bonds in the region have been declining, reflecting improving investor sentiment. The various regional stock markets showed bullish trends with the Kenya, Uganda and South Africa stock exchanges gaining 12.2%, 9.4% and 5.4% on a YTD basis;
Kenya Macroeconomic Review
The macroeconomic environment in Kenya has remained relatively stable in the first quarter of 2019, supported by (i) a stable interest rate environment, evidenced by the declining yields in government securities in the primary market, which has enabled the Kenyan Government to continue accessing cheap domestic debt, (ii) a relatively stable currency, having gained by 1.1% against the US Dollar in Q1’2019, and (iii) improved business confidence and strong private consumption as evidenced by the Stanbic Bank Monthly Purchasing Manager’s Index (PMI), which albeit easing to 51.2 in February from 53.2 the previous months still remains above 50, which is an indication of improving business conditions. The average inflation rate for Q1’2019 declined to 4.4%, from 4.5% in Q1’2018, with the inflation rates for the month of January, February and March coming in at 4.7%, 4.1% and 4.4%, respectively, compared to 4.8%, 4.5% and 4.2% for a similar period of review in 2018;
Fixed Income
During the first quarter of 2019, T-bills were oversubscribed, with the overall subscription rate coming in at 157.2%, up from 74.3% in Q4’2018. Overall subscriptions for the 91, 182, and 364-day papers came in at 110.0%, 111.4% and 221.9% in Q1’2019, from 107.1%, 37.7% and 97.7% in Q4’2018, respectively. Yields on the 91-day T-bill rose by 20 bps to close at 7.5% in Q1’2019 from 7.3% in Q4’2018, whereas yields on the 182-day and the 364-day T-bills declined by 80 bps and 60 bps to close at 8.2% and 9.4% from 9.0% and 10.0% in Q4’2018, respectively;
Equities
During the quarter, the equities market was on an upward trend, with NASI, NSE 25 and NSE 20 gaining by 12.2%, 10.8% and 0.4%, respectively, taking their YTD performance as at the end of March to 12.2%, 10.8% and 0.4% for NASI, NSE 25 and NSE 20, respectively. For the last twelve months (LTM), NASI, NSE 25 and NSE 20 have declined by 17.6%, 20.7% and 26.0%, respectively. Listed banks in Kenya released their FY’2018 results during the quarter, recording an average core earnings per share growth of 13.8%, compared to a decline of 1.0% the previous year. For a summary of the FY’2018 banking sector results and our key takeaways from the results, please see our Cytonn FY’2018 Banking Sector Performance Note. We shall be releasing our FY’2018 Banking Report on 14th April, 2019.;
Private Equity
During the quarter, we witnessed increased private equity activity across the Financial Services, FinTech, Education, and Hospitality sectors. Notable transactions in the Financial Services sector during the quarter include (i) a capital injection of USD 12.0 mn (Kshs 1.2 bn) into Kenyan Tier 3 lender Sidian Bank by the Investment Fund for Developing Countries (IFU), a Danish Development Finance Institution, (ii) the acquisition of a minority stake in Prime Bank by private equity firms AfricInvest and Catalyst Principal Partners, and (iii) the successful fundraising of USD 4.9 mn (Kshs 500.0 mn) by Branch International. In the Education sector, GEMS Education announced plans to acquire a 100.0% stake of Hillcrest International Schools from its current owners, Fanisi Capital and businessman Anthony Wahome, for Kshs 2.6 bn;
Real Estate
The real estate sector, in Q1’2019, recorded increased activity in the residential, commercial and hospitality themes, mainly due to (i) intensified focus on affordable housing provision by 2022, (ii) continued entry of international retailers into the country, (iii) marketing of Kenya as a holiday destination, and (iv) continued infrastructural development. In terms of performance, the residential sector recorded a 0.3% points q/q increase in price appreciation, while commercial offices and retail space recorded 0.1% points and 0.5% points q/q decline in rental yield to 8.0% and 8.5% from 8.1% and 9.0%, respectively, in FY’2018. For a detailed analysis of the Q1’2019 Real Estate performance, see our Cytonn Q1’2019 Real Estate Market Review.
- Edwin H. Dande - Chief Executive Officer, was on KTN News to discuss Sacco management and governance. Watch Edwin here;
- Caleb Mugendi - Senior Investments Analyst, was on K24 to discuss market performance and domestic borrowing. Watch Caleb here;
- Faith Maina - Investments Analyst was on KTN News to discuss making long term investments, the difference between long and short-term investments and partnerships involved in investments. Watch Faith here;
- Derrick Kieya - Investments Analyst was on NTV to discuss the growth in digital lending. Watch Derrick here;
- For an exclusive tour of the developments, visit: Sharp Investor’s Tour and for more information, email us at sales@cytonn.com;
- Following the recent approval by Retirement Benefits Authority (RBA), for Cytonn Asset Managers to manage pension funds, we are looking for business development consultants and agents with networks in the pensions industry to build our pensions business at very attractive commissions. If interested in being an agent or know someone who can be an agent, kindly contact us at pensions@cytonn.com;
- Following the completion and handover of Amara Ridge in Karen, we have now launched our next Karen project, dubbed Applewood, a Kshs 2.5 bn residential development located in Miotoni, Karen. This signature development shall comprise luxury homes, each sitting on 1/2 acre. We invite you to the exhibition of Applewood which is ongoing at the Amara Ridge Clubhouse (Location pin: https://goo.gl/maps/B3GVnu8pHyn) or at the Applewood Sales Centre on Miotoni Road (Location pin: https://goo.gl/maps/ZfABuGjFo1z) from 9:00 am to 5:00 pm daily. Call 0709 101 000 or email resales@cytonn.com to reserve a villa! See Video here;
- We continue to hold weekly workshops and site visits on how to build wealth through real estate investments. The weekly workshops and site visits target both investors looking to invest in real estate directly and those interested in high yield investment products to familiarize themselves with how we support our high yields. Watch progress videos and pictures of The Alma, Amara Ridge, and The Ridge. Key to note is that our cost of capital is priced off the loan markets, where all-in pricing ranges from 16.0% to 20.0%, and our returns on real estate developments range from 23.0% to 25.0%, hence our top-line gross spread is about 6.0%. If interested in attending the site visits, kindly register here;
- We continue to see very strong interest in our weekly Private Wealth Management Training (largely covering financial planning and structured products). The training is at no cost and is open only to pre-screened participants. We also continue to see institutions and investment groups interested in the training for their teams. Cytonn Foundation, under its financial literacy pillar, runs the Wealth Management Training. If interested in our Private Wealth Management Training for your employees or investment group, please get in touch with us through wmt@cytonn.com. To view the Wealth Management Training topics, click here;
- For recent news about the company, see our news section here;
- We have 10 investment-ready projects, offering attractive development and buyer targeted returns of around 23.0% to 25.0% p.a. See further details here: Summary of Investment-Ready Projects;
- We continue to beef up the team with ongoing hires for Financial and Real Estate Advisors for our offices in Nairobi, Nakuru, Kisumu, and Nyeri. Visit the Careers Section on our website to apply.
Introduction
The global economy is expected to record a slower growth compared to 2018, with the IMF in their January World Economic Outlook Update projecting 2019 growth to come in at 3.5%, against growth of 3.7% in 2018. Headwinds to global growth include the weakening financial market sentiments owing to (i) the current uncertainty on the direction of trade policy between the US and China, (ii) Britain’s exit (“Brexit”) from the European Union, and (iii) higher debt levels in emerging and development economies, especially those dependent on commodity exports, such as Nigeria. Reduced consumption expenditure in major global economies such as Germany has also been touted as a major reason for reduced economic growth, as it has consequently led to reduced industrial production, as evidenced by the decline in the Germany’s Purchasing Managers Index (PMI) to 47.6 in February 2019.
United States:
The US economy grew by 2.9% in 2018, and is expected to grow by 2.5% and 1.8% in 2019 and 2020, respectively, according to the IMF. The slower growth is anticipated owing to a removal of the one-off tax benefits enjoyed in 2018, the fiscal stimulus injected by increased government spending, and an expected decline in the prices of commodities, compared to 2018. In March, the Federal Open Monetary Committee (FOMC) maintained the Federal Funds Rate at the range of 2.25% - 2.50%, citing:
- The current low inflation of 1.5%, being below the 2.0% target,
- Low unemployment rate currently at 3.8%, which is below the Non-Accelerating Inflation Rate of Unemployment (NAIRU) of 4.6%. A reading of below 4.0% considered to be close to full employment, and,
- Slowing economic growth caused by reduced household spending and business fixed investment in Q1’2019, evidenced by the 1.0% decline in new vehicle demands, and the 4.0% decline in car sales as at February 2019.
The stock market has been on an upward trend, with the S&P 500 gaining by 11.9% during the first quarter of 2019. The gain was largely supported by improved earnings by a majority of counters in financial services, oil and gas, consumer goods and technology, largely attributed to the implemented tax reforms by the current administration, as the corporate tax rate was reduced to a uniform rate of 21.0% from the previous revenue-based tiered system that had the lowest tax for corporations at 25.0%. US valuations are still higher than their long-term historical average with the Shiller Cyclically Adjusted P/E (CAPE) multiple currently at 29.9x, which is 76.4% above the historical mean of 16.9x.
Eurozone:
According to the IMF, the Eurozone is expected to grow at rate of 1.6% and 1.7% in 2019 and 2020, respectively, lower than the 1.8% growth recorded in 2018. The projected 2019 growth was revised lower by 0.3% points, as the regional growth was downgraded following dampened sentiments in major economies such as Germany, which has seen reduced private consumption, and declining industrial production especially in the automobiles sector, following the introduction of the revised auto emission standards amid subdued foreign demand. Uncertainty over the United Kingdom’s (UK’s) exit from the European Union (“Brexit”) has also led to increased uncertainty in the Eurozone regarding the impact, and the type of exit deal to be adopted by the UK. Other major economies facing uncertainty include France and Italy, with uncertainty in France arising from the ongoing intermittent yellow vest movement and industrial protests. The yellow vest movement protests are motivated by rising fuel prices and high cost of living. Italy dipped into a recession, as it grapples with reduced domestic demand and consumption coupled with higher sovereign debt servicing obligations due to the rising yields on government issued debt.
The European Commercial Bank (ECB) maintained the base lending rate at 0.0%, and the rates on the marginal lending facility and deposit facility at 0.25% and (0.40%), respectively, indicating that it was unlikely to make changes to the policy rate until the end of the year, adopting an easing stance from its earlier expectations of an interest rate hike in Q3’2019. With the ECB having completed its Quantitative-easing program, they are likely to adopt a more accommodative monetary policy through the use of Targeted Long-Term Refinancing Operations (TLTRO), which essentially involves the bank issuing loans to commercial banks, for onward lending to commercial enterprises and households, so as to consequently spur economic activity and boost spending. Inflation has remained subdued, currently at 1.2%, below the 2.0% target.
The Stoxx 600 index rose by 12.0% in Q1’2019 as gains in the equities markets were driven by the increased purchases by investors taking up positions in anticipation of the earnings season, coupled with a flight from fixed income securities, as several securities’ yields have slipped into negative territory. The P/E ratio is currently at 17.5x, 10.5% below the historical average of 19.5x, indicating markets are currently trading at relatively cheaper valuations.
China:
The Chinese economy is estimated to have grown by 6.6% in FY’2018, the slowest growth rate since 1990. The major cause of the relatively slower growth was the prolonged trade dispute between the US and China, which culminated in a 90-day truce in January 2019, as US and China negotiated on trade terms, coupled with intellectual property ownership, a major issue used by the US to instigate tariffs against China.
The IMF expects China to grow at 6.2% in 2019, comparable to the Chinese government’s target of “around 6.5%”. In order to support economic recovery, the government has adopted a more accommodative stance by injecting liquidity in the economy by reducing the reserve requirements for banks, and resuming public investment, which should result in increased liquidity and consequently higher domestic consumption.
Renewed optimism of a resolution of the trade war has improved investor sentiments, and consequently, the Shanghai Composite has gained by 20.1% in Q1’2019, with the largest gaining sectors being real estate, communication services, healthcare, industrials and financial, with gains of 31.6%, 29.1%, 27.2%, 21.7% and 18.7%, respectively. The gains have led to the market’s valuation rising by 1.4% above the historical average to 14.7x compared to the historical average of 14.5x.
Commodity Prices:
Global commodity prices were generally on a recovery trend in Q1’2019. According to the World Bank Commodity Prices Index, energy, precious metals, minerals, and agriculture segments gained by 6.6%, 5.8%, 5.3% and 1.5%, respectively, during the quarter. Below is a chart showing the performance of select commodity groups for Q1’2019.
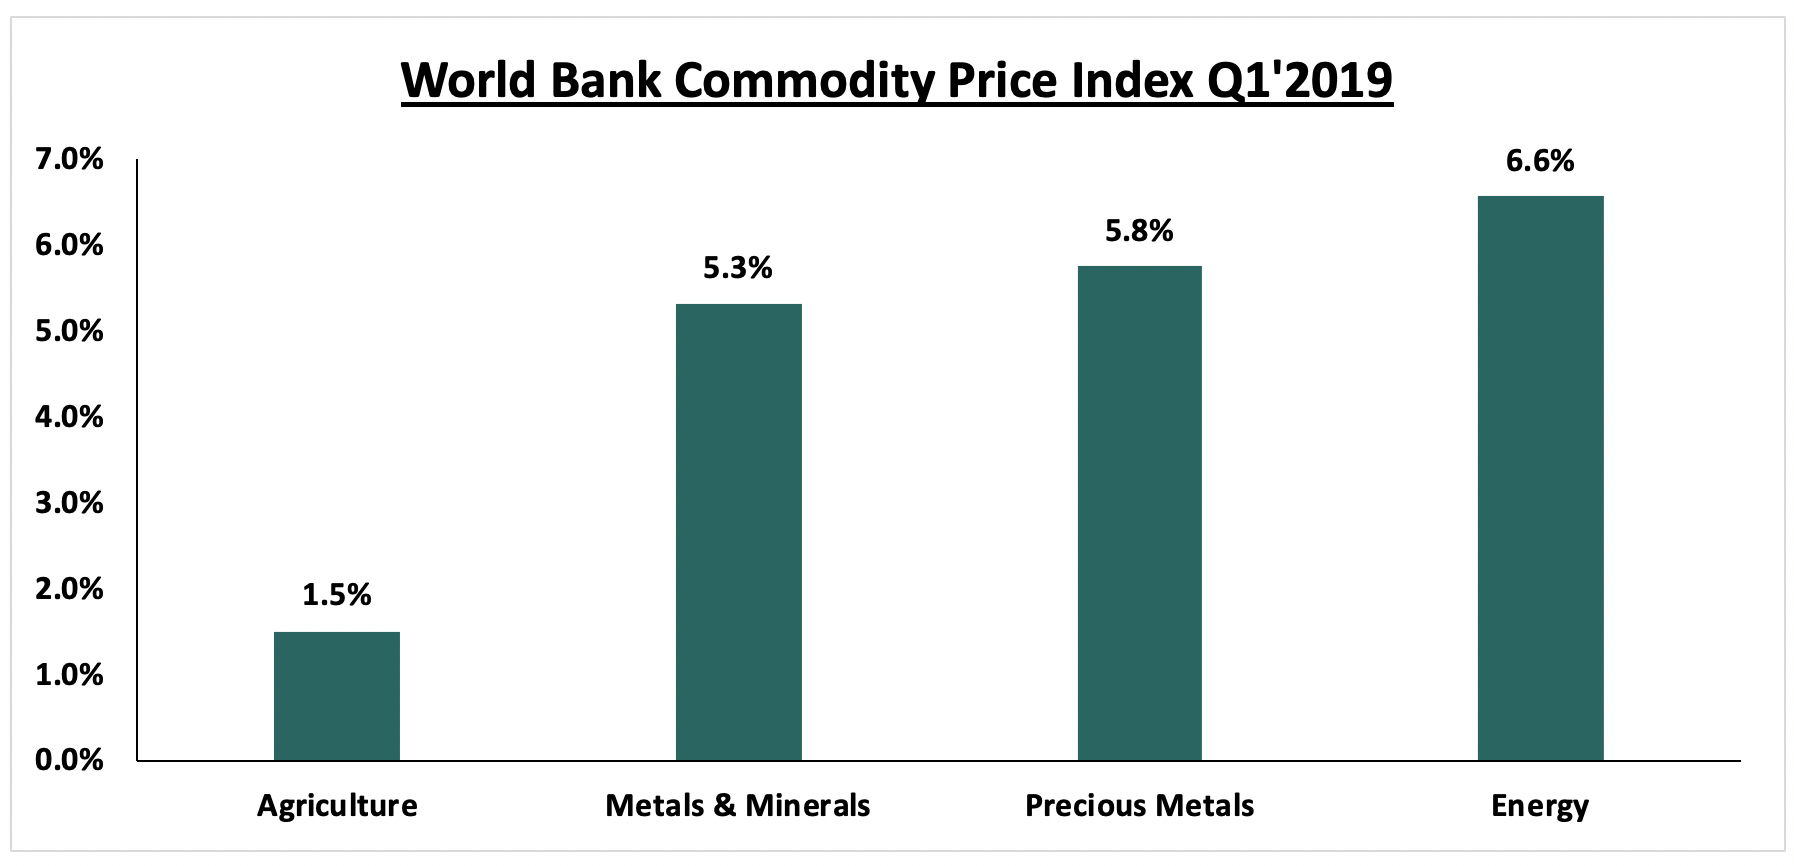
As per the chart above,
- All the highlighted commodity groups recorded increased prices, as the gains in energy were majorly driven by the recovery in oil prices, owing to disruptions in the production of oil in some oil producing areas such as Venezuela and Iran, coupled with OPEC’s agreement to cut oil supply. Brent prices rose by 18.9% to USD 67.1 per barrel in March 2019, from USD 56.5 per barrel in December 2018,
- The gains in agriculture were largely driven by the gains in oils & meals, timber and other raw materials, which recorded gains of 2.5%, 2.3% and 2.3%, respectively. The gains were however weighed down by the 0.7% decline in beverage prices.
During Q1’2019, the International Monetary Fund (IMF) released the World Economic Outlook Update for January 2019, projecting Sub-Saharan Africa (SSA) GDP to grow by 3.5% in 2019, and 3.6% in 2020, from an expected 2.9% in 2018. The higher growth rate was majorly attributed to improvement in weather conditions which is expected to boost agricultural production. The projections for both 2019 and 2020 are 30 bps lower than the previous projection of October 2018, which stood at 3.8% and 3.9%, respectively. This was as a result of downward revisions for Angola and Nigeria with the IMF citing concerns on softening oil prices. The largest economy in SSA, Nigeria, is expected to experience less robust GDP growth in 2019 with the IMF revising this downward by 30 bps to 2.0%, from 2.3% previously, citing softening of global oil prices and political uncertainty due to the elections that were held in February 2019.
Currency Performance
Majority of the currencies depreciated against the US Dollar with the Malawian Kwacha, the Kenya Shilling, and the Nigerian Naira being the only gainers. The Ghanaian Cedi was the worst performer, depreciating by 8.4% against the dollar YTD owing to perceptions about the country’s inability to manage its finances properly after a four-year bailout with the International Monetary Fund that ends in April 2019. The Kenya shilling appreciated against the dollar with inflows from horticulture exports and non-governmental organizations matching end-month dollar demand from the energy sector. Below is a table showing the performance of select African currencies:
|
Select Sub Saharan Africa Currency Performance vs USD |
||||||
|
Currency |
Mar-18 |
Dec-18 |
Mar-19 |
Last 12 Months change (%) |
YTD change (%) |
|
|
Malawian Kwacha |
725.7 |
736.8 |
724.5 |
0.2% |
1.7% |
|
|
Kenyan Shilling |
101.1 |
101.8 |
100.7 |
0.4% |
1.1% |
|
|
Nigerian Naira |
360.0 |
362.6 |
361.0 |
(0.3%) |
0.4% |
|
|
Ugandan Shilling |
3691.2 |
3708.5 |
3714.9 |
(0.6%) |
(0.2%) |
|
|
Botswana Pula |
9.5 |
10.7 |
10.8 |
(11.7%) |
(0.6%) |
|
|
Tanzanian Shilling |
2257.2 |
2298.7 |
2315.5 |
(2.5%) |
(0.7%) |
|
|
South African Rand |
11.9 |
14.3 |
14.5 |
(17.9%) |
(1.4%) |
|
|
Mauritius Rupee |
33.6 |
34.3 |
34.9 |
(3.8%) |
(1.8%) |
|
|
Zambian Kwacha |
9.4 |
11.9 |
12.2 |
(22.5%) |
(1.9%) |
|
|
Ghanaian Cedi |
4.4 |
4.9 |
5.4 |
(17.8%) |
(8.4%) |
|
African Eurobonds:
Yields on African Eurobonds declined in Q1’2019 after an increase in 2018. This was partly attributed to the perceived end to the tightening monetary policy regime adopted by the U.S Federal reserve amid a suddenly cloudy outlook for the US economy. As a result, there was increased investor interest in Africa’s debt market.
During the quarter, the government of Ghana, on 19th March 2019 issued its seventh Eurobond after its maiden appearance on the international capital market in 2007. An amount of USD 3.0 bn was raised in 3 tranches of 7, 12, and 31-years, where the bond was 7x oversubscribed. The proceeds of the bond as stipulated in the 2019 budget is for budgetary support and liability management similar to previous bonds.
Below is a graph showing the Eurobond secondary market performance of select 10-year Eurobonds issued by the respective countries:
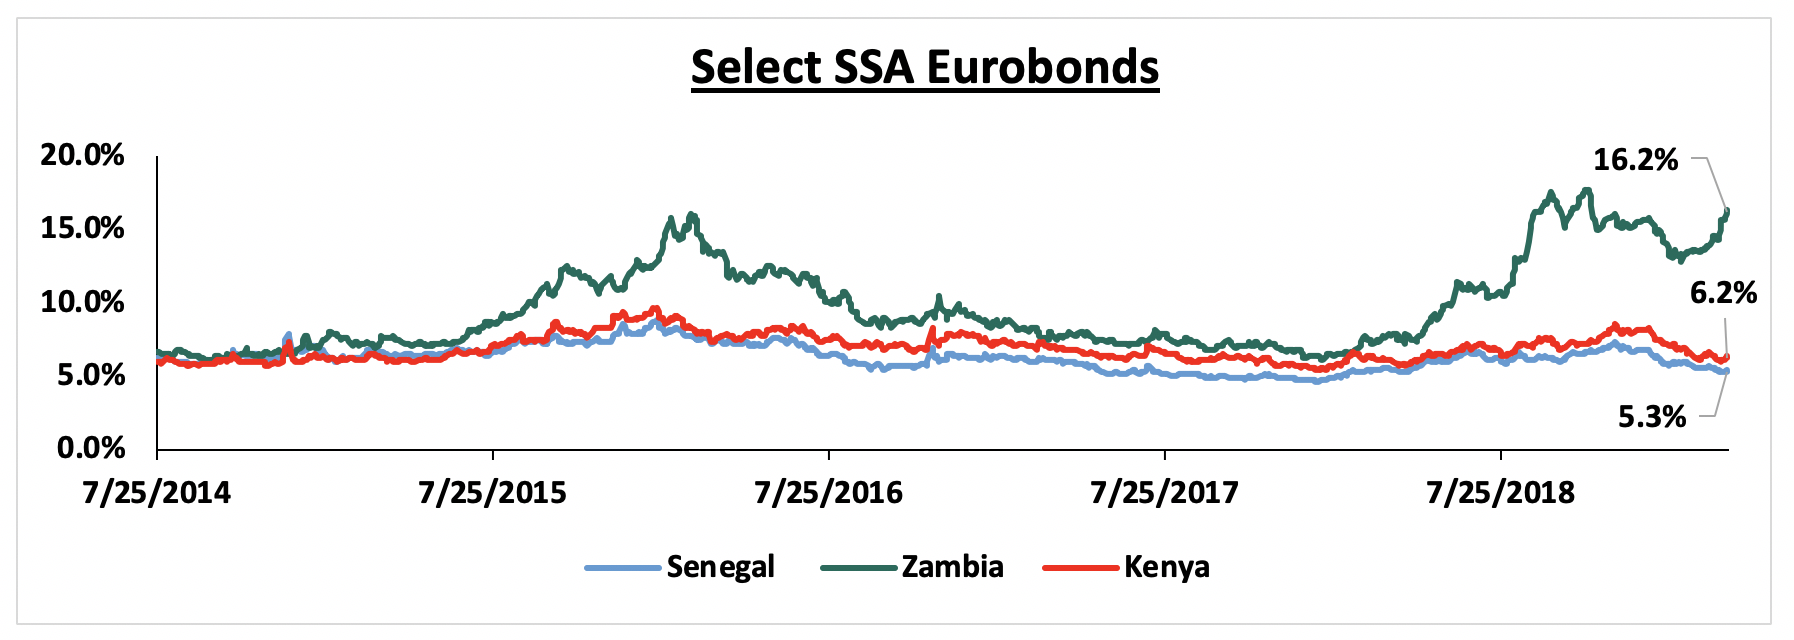
Analysis of trends observed in the chart above is as follows:
- Yields on the Zambia Eurobond increased in 2018 a result of mass exodus of foreign investors amid fears of the country’s debt sustainability, most believing it to be close to default.
- Yields on Kenyan and Senegalese Eurobonds have been on a decline since the beginning of the year, signaling that the demand for the instruments has risen during the period. This has been mostly attributed to macroeconomic stability in both countries.
Equities Market Performance
Most of the Sub-Saharan African (SSA) stock markets recorded positive returns in Q1’2019. The region experienced capital inflows, a recovery from last year’s recorded outflows. Below is a summary of the performance of key exchanges:
|
Equities Market Performance (Dollarized*) |
|||||
|
Country |
Mar-18 |
Dec-18 |
Mar-19 |
Last 12 Months change (%) |
YTD change (%) |
|
Kenya |
1.9 |
1.4 |
1.5 |
(17.6%) |
12.2% |
|
Uganda |
0.6 |
0.4 |
0.5 |
(21.3%) |
9.4% |
|
South Africa |
4690.5 |
3667.1 |
3866.2 |
(17.6%) |
5.4% |
|
Zambia |
572.6 |
441.1 |
460.5 |
(19.6%) |
4.4% |
|
BRVM |
0.4 |
0.3 |
0.3 |
(24.9%) |
0.1% |
|
Tanzania |
1.1 |
0.9 |
0.9 |
(19.0%) |
(1.0%) |
|
Nigeria |
115.3 |
86.5 |
85.4 |
(25.9%) |
(1.3%) |
|
Malawi |
34.9 |
39.8 |
37.7 |
8.0% |
(5.3%) |
|
Rwanda |
0.2 |
0.2 |
0.1 |
(6.2%) |
(5.8%) |
|
Ghana |
762.2 |
510.8 |
458.8 |
(39.8%) |
(10.2%) |
|
*The index values are dollarized for ease of comparison |
|||||
NASI is the best performing index following gains made in large cap counters such as NIC Group, Safaricom and Equity Group which have recorded gains of 30.8%, 24.1% and 19.4%, respectively
The Sub-Saharan Africa region is expected to perform well supported by increased public spending on infrastructural development owing to the high demand for basic needs. Key risks remain difficult business conditions and poor infrastructure, reliance on commodity exports, political tension in some countries and debt sustainability due to high levels of public debt in most economies in the region. Stock markets valuations remain attractive for long-term investors. The improved regional economic growth prospects remain key towards enhancing investor sentiment and attracting investment inflows into the region.
During the quarter, we tracked Kenya GDP growth projections for 2019 released by 16 organizations, that comprised of research houses, global agencies, and government organizations. The average, including Cytonn’s 2019 growth estimate of 5.8%, came to 5.8%. The common view was that GDP growth would remain stable in 2019, from an estimated growth of 6.0% in 2018, having registered an average of 6.1% in the first 3 quarters of 2018. Economic growth is expected to be driven by:
- Stable growth in the agriculture sector on the back of favorable weather conditions despite delayed onset of the long rains in most parts of the country,
- Implementation of the Big 4 Agenda projects by the Kenyan Government, and,
- Recovery in the business environment as evidenced by the Stanbic Bank Monthly Purchasing Manager’s Index (PMI), which albeit easing to 51.2 in February from 53.2 in January, still remains above 50, an indication of improving business conditions.
Below is a table showing average projected GDP growth for Kenya in 2019; noteworthy being that the highest projection is by the Central Bank of Kenya at 6.3%. We shall be updating this table should projections change and shall highlight who had the most accurate projection at the end of the year.
|
Kenya 2018 Annual GDP Growth Outlook |
|||
|
No. |
|
2018 Outlook |
2019 Outlook |
|
1 |
Central Bank of Kenya |
6.2% |
6.3% |
|
2 |
International Monetary Fund (IMF) |
5.5% |
6.1% |
|
3 |
Citigroup Global Markets |
5.6% |
6.1% |
|
4 |
African Development Bank (AfDB) |
5.6% |
6.0% |
|
5 |
PNB Paribas |
6.0% |
|
|
6 |
UK HSBC |
6.0% |
|
|
7 |
Euromonitor International |
5.9% |
|
|
8 |
World Bank |
5.5% |
5.8% |
|
9 |
Cytonn Investments Management Plc |
5.5% |
5.8% |
|
10 |
Focus Economics |
5.3% |
5.8% |
|
11 |
JP Morgan |
5.7% |
|
|
12 |
Euler Hermes |
5.7% |
|
|
13 |
Oxford Economics |
5.7% |
5.6% |
|
14 |
Standard Chartered |
4.6% |
5.6% |
|
15 |
Capital Economics |
5.5% |
|
|
16 |
Fitch Solutions |
5.5% |
5.2% |
|
|
Average |
5.5% |
5.8% |
The Kenya Shilling:
During Q1’2019, the Kenya Shilling gained against the US Dollar by 1.1% to close at Kshs 100.8, from Kshs 101.8 at the end of December 2018, mainly driven by inflows from diaspora remittances amid thin dollar demand from oil importers. This week, the Kenya Shilling depreciated marginally by 0.05% against the dollar to close at Kshs 100.8, from Kshs 100.7 the previous week, due to end-month demand from the energy and manufacturing sector exceeding dollar inflows from remittances. In our view, the shilling should remain relatively stable to the dollar in the short term, supported by:
- The narrowing of the current account deficit with preliminary data on balance of payments indicating continued narrowing to 4.6% of GDP in the 12-months to January 2019, from 5.5% recorded in January 2018. The decline has been attributed to improved agriculture exports, increased diaspora remittances, strong receipts from tourism, and lower food and SGR-related equipment relative to 2017,
- Improving diaspora remittances, which increased by 38.6% in 2018 to USD 2.7 bn, from USD 1.9 bn recorded in 2017. The rise is due to;
- Increased uptake of financial products by the diaspora due to financial services firms, particularly banks, targeting the diaspora, and,
- New partnerships between international money remittance providers and local commercial banks making the process more convenient,
- CBK’s supportive activities in the money market, such as repurchase agreements and selling of dollars, and,
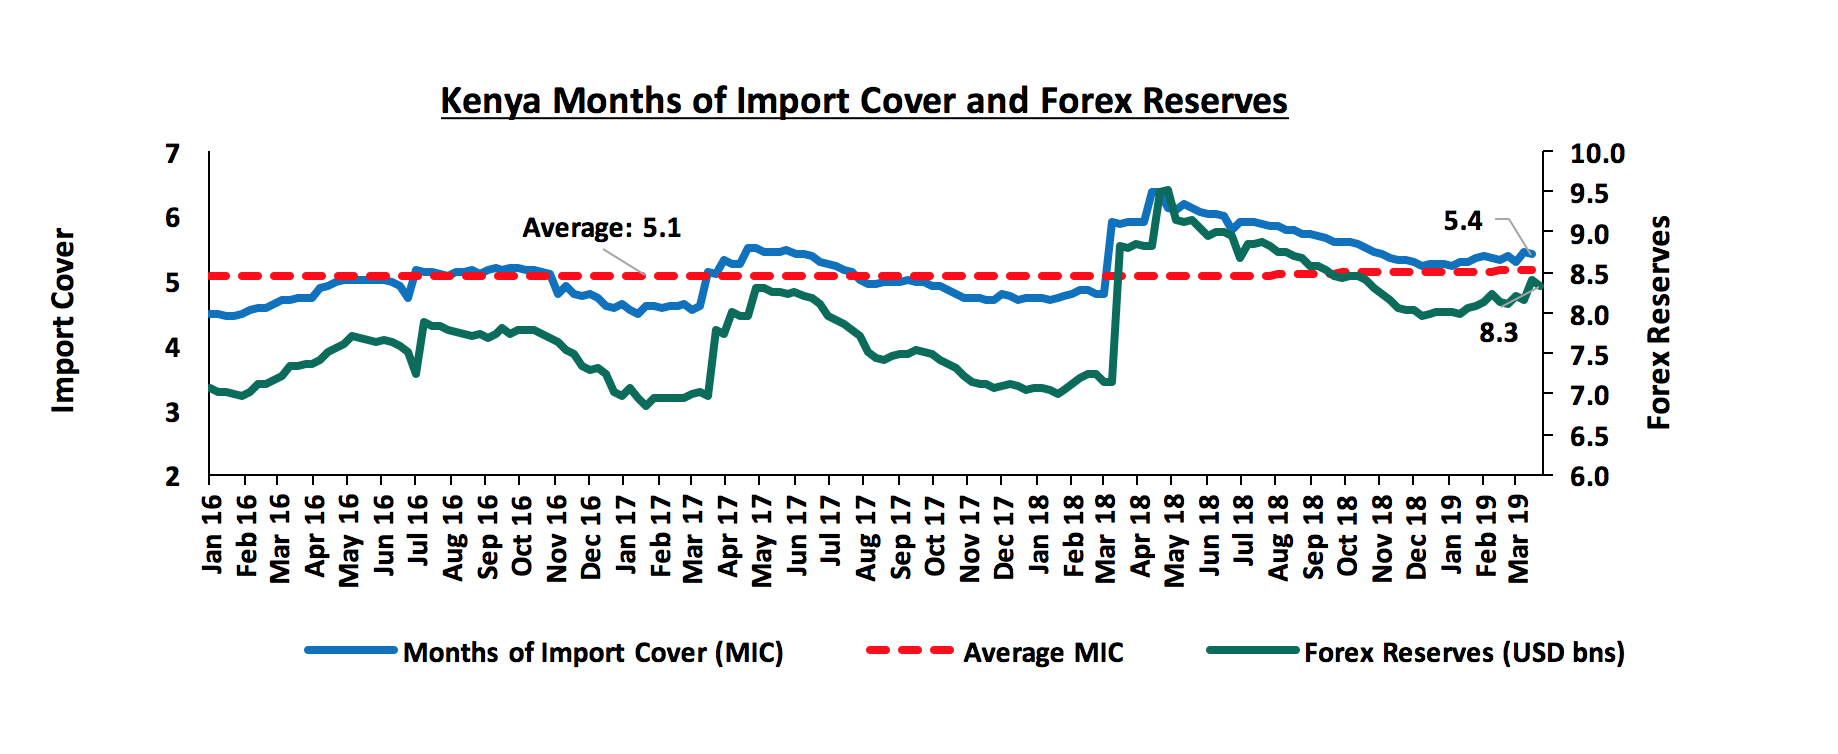
- High forex reserves, currently at USD 8.3 bn, equivalent to 5.4-months of import cover, thus meeting the statutory requirement of maintaining at least 4-months of import cover, and the EAC region’s convergence criteria of 4.5-months of import cover.
Inflation:
The inflation rate declined to an average of 4.4% YTD as compared to 4.5% in a similar period in 2018. Inflation came in at 4.7%, 4.1% and 4.4% for the month of January, February and March, respectively, compared to 4.8%, 4.5% and 4.2% for a similar period of review in 2018. The decline in inflation has been on account of stable food prices, lower electricity and fuel prices, and muted demand driven inflationary pressures. Going forward, however, we expect moderate upward pressure on inflation in the near-term due to:
- The rise of international oil prices, as experienced in Q1’2019, owing to disruptions in the production of oil in some oil producing areas such as Venezuela and Iran, coupled with OPEC’s agreement to cut oil supply, which may exert moderate upward pressure on prices of fuel, and,
- An expected rise in food inflation due to the expected late onset and poor distribution of the March-April-May rains, which is likely to impact negatively on the agricultural sector, leading to food insecurity.
Monetary Policy:
The Monetary Policy Committee (MPC) met twice in Q1’2019 (28th January 2019 and 27th March 2019). In both meetings, the MPC retained the prevailing monetary policy stance leaving the Central Bank Rate (CBR) unchanged at 9.0%, which was in line with our expectations citing that inflation expectations remained well anchored within the target range and that the economy was operating close to its potential as evidenced by:
- Muted inflationary pressures largely due to stable food prices, lower electricity and fuel prices, and muted demand driven inflationary pressures,
- Stability in the foreign exchange market supported by the narrowing of the current account deficit to 4.7% of GDP in the 12 months to February from 5.5% in February 2018 driven by robust performance of exports particularly horticulture, resilient diaspora remittances, and higher receipts from tourism and transport services, and,
- Improving private sector credit growth despite being below historical averages coming in at 3.4% in the 12 months to February, compared to 3.0% in the 12 months to January, and is expected to strengthen in 2019, with the anticipated higher economic activity and improved lending to the Micro, Small and Medium Enterprises (MSMEs).
As such, the MPC concluded that the current policy stance was still appropriate, but would continue to monitor any perverse response to its previous decisions and thus the current policy stance was still appropriate. We expect monetary policy to remain relatively stable in 2019, and lean to a possible easing, as the CBK monitors Kenya’s inflation rate and the currency
Q1’2019 Highlights:
- The National Treasury released the budgetary review for the first half of the 2018/2019 financial year during the month. The total cumulative revenue in H1’2018/2019 amounted to Kshs 794.7 bn against a target of Kshs 855.7 bn (92.9% of the target) while the total expenditure for the period under review amounted to Kshs 1,075.5 bn, against a target of Kshs 1,130.7 bn (95.1% of the target). The cumulative overall fiscal balance (on a commitment basis and excluding grants), amounted to Kshs 280.8 bn (equivalent to 2.8% of GDP), against a targeted deficit of Kshs 275.0 bn (equivalent to 2.8% of GDP). For more information, see our Cytonn Weekly #08/2019.
- The Kenya National Bureau of Statistics (KNBS) released the Gross County Product (GCP), which includes a geographic breakdown of Kenya’s Gross Domestic Product (GDP), giving an estimate of the size and structure of county economies. According to the report, the average contribution per county to gross value added over the period 2013-2017 was approximately 2.1%, with Nairobi having the highest contribution at 21.7%, followed by Nakuru and Kiambu at 6.1% and 5.5%, respectively. Isiolo had the lowest contribution coming in at 0.2%, for the same period under review. For more information, see our Cytonn Weekly #07/2019.
- The National Treasury released the 2019 Budget Policy Statement (BPS), which outlines the current performance of the Kenyan economy, as well as give the medium-term outlook. The BPS is a Government policy document that sets out the broad strategic priorities and policy goals, together with a summary of the Government spending plans, as a basis of preparing the FY 2019/20 budget. From the report, the 2019 BPS point to a 7.8% increase of the budget, to Kshs 2.7 tn from Kshs 2.5 tn in the FY’ 2018/19 revised budget. The recurrent expenditure is set to increase at a slower rate than the development expenditure; the recurrent increasing by 7.5% to Kshs 1.7 tn from Kshs 1.5 tn as per the revised budget. For more information, see our Cytonn Weekly #07/2019.
Macroeconomic Indicators Table:
The table below summarizes the various macroeconomic indicators, the actual Q1’2019 experience, the impact of the same, and our expectations going forward:
|
Macro-Economic & Business Environment Outlook |
|||
|
Macro-Economic Indicators |
YTD 2019 experience and outlook going forward |
Outlook at the Beginning of the Year |
Current outlook |
|
Government Borrowing |
• We still maintain our expectations of KRA not achieving their revenue targets with the National Treasury reporting ordinary revenue, as at February 2019, at Kshs 945.6 bn; 15.2% below the pro-rated target. This is expected to result in further borrowing from the domestic market to plug in the deficit, which coupled with heavy maturities might lead to pressure on domestic borrowing • On the international debt front, the government has a net external financing target of Kshs 272.0 bn to finance the budget deficit, coupled with the need to retire 3 commercial loans maturing in H1’2019. There are talks that the Government might issue another Eurobond with the targeted amount at USD 2.5 Bn to refinance the USD 750 Mn maturing in June but with the International Monetary Fund (IMF) having raised Kenya’s debt distress risk from low to moderate on October we expect investors to demand higher yields to match the risk profile. |
Negative |
Negative |
|
Exchange Rate |
• The Kenya Shilling has remained stable gaining by 1.1% in Q1’2019 and is expected to remain resilient against the US Dollar, due to the continued narrowing of the current account thus improved balance of payments and the continued support from the CBK in the short term through its sufficient reserves of USD 8.3 bn (equivalent to 5.4-months of import cover). |
Neutral |
Neutral |
|
Interest Rates |
• The interest rate environment has remained stable in Q1’2019, with the CBR having been retained at 9.0% in the 2 MPC meetings held during the quarter. With the heavy domestic maturities in 2019, we expect slight upward pressure on interest rates going forward, as the government tries to meet its domestic borrowing targets for the fiscal year. |
Neutral |
Neutral |
|
Inflation |
• Inflation has remained muted in Q1’2019 mainly supported by lower fuel and electricity. Going forward, inflation is expected to average 5.4% and remain within the government target range of 2.5% - 7.5%. However, risks abound in the near-term, including the late onset of the traditionally long rains season will disrupt food supply leading to a gradual flare in food inflation, which stood at 3.3% m/m in March. |
Positive |
Positive |
|
GDP |
• GDP growth is projected to range between 5.7%-5.9% in 2019, lower than the expected growth rate of 6.0% in 2018, but higher than the 5-year historical average of 5.4% |
Positive |
Positive |
|
Investor Sentiment |
• Eurobond yields were on a declining trend during Q1’2019. An improvement was also recorded in foreign inflows in the capital market to a net buying position of USD 5.6 mn from a net selling position of USD 93.4 mn in Q4’2018, an indication of improved investor sentiments. • We expect improved foreign inflows from the negative position in 2018, mainly supported by long term investors who enter the market looking to take advantage of the current cheap valuations in select sections of the market. |
Neutral |
Neutral |
|
Security |
• Security is expected to be upheld in 2019, given that the political climate in the country has eased. Despite the recent terror attack experienced during the quarter, Kenya was spared from travel advisories, evidence of the international community’s confidence in the country’s security position. |
Positive |
Positive |
Of the 7 indicators we track, 3 are positive, 3 are neutral and 1 is negative. The outlook of the 7 indicators has remained unchanged from the beginning of the year. From this, we maintain our positive outlook on the 2019 macroeconomic environment supported by expectations for strong economic growth at between 5.7%-5.9%, a stable currency, inflation rates within the government’s target, and stable interest rates in 2019.
T-Bills & T-Bonds Primary Auction:
During the first quarter of 2019, T-bills were oversubscribed, with the overall subscription rate coming in at 157.2%, up from 74.3% in Q4’2018. The oversubscription was partly attributable to improved liquidity in the market during the quarter, which saw the average interbank rate declining to an average of 3.1%, from an average of 5.1% in Q4’2018, supported by government payments and debt maturities. Overall subscriptions for the 91, 182, and 364-day papers came in at 110.0%, 111.4% and 221.9% in Q1’2019, from 107.1%, 37.7% and 97.7% in Q4’2018, respectively, with investors’ participation remaining skewed towards the longer dated paper. The demand for the longer-dated paper is attributable to the scarcity of newer short-term bonds in the primary market. Yields on the 91-day T-bill rose by 20 bps to close at 7.5% in Q1’2019, from 7.3% in Q4’2018, while yields on the 182-day and the 364-day T-bills declined by 80 bps and 60 bps to close at 8.2% and 9.4% from 9.0% and 10.0% at the end of 2018, respectively. The average acceptance rate for the quarter came in at 73.0%, down from 91.1% recorded in Q4’2018, with the government accepting a total of Kshs 330.5 bn of the total bids received during the quarter of Kshs 452.7 bn.
During the week, T-bills recorded an over-subscription, with the subscription rate coming in at 183.7%, down from 198.9% recorded the previous week. The oversubscription was partly attributed to favorable liquidity in the market. The yield on the 91-day paper declined by 20 bps to 7.5% from 7.7% recorded the previous week, while the yields on the 182-day and 364-day papers remained stable at 8.2% and 9.4%, respectively. The government continues to reject expensive bids as evidenced by the acceptance rate having declined to 69.3%, from 73.3% recorded the previous week, with the government accepting Kshs 30.5 bn of the Kshs 44.1 bn worth of bids received.
During Q1’2019, the Kenyan Government had five Treasury Bond primary issues and two bonds were re-opened, with the details in the table below:
|
No. |
Date |
Bond Auctioned |
Effective Tenor to Maturity (Years) |
Coupon |
Amount to be Raised (Kshs bn) |
Actual Amount Raised (Kshs bn) |
Average Accepted Yield |
Subscription Rate |
Acceptance Rate |
|
1 |
28/1/2019 |
FXD1/2019/2 |
2.0 |
10.7% |
40.0 |
23.8 |
10.7% |
192.3% |
30.9% |
|
28/1/2019 |
FXD1/2019/15 |
15.0 |
12.9% |
40.0 |
14.7 |
12.9% |
62.7% |
58.7% |
|
|
2 |
11/2/2019 |
FXD1/2019/2 (Re-open) |
2.0 |
10.7% |
12.0 |
7.5 |
10.3% |
418.3% |
97.3% |
|
11/2/2019 |
FXD1/2019/15 (Re-open) |
15.0 |
12.9% |
12.0 |
16.0 |
12.8% |
136.7% |
14.9% |
|
|
3 |
25/2/2019 |
FXD1/2019/5 |
5.0 |
11.3% |
50.0 |
20.6 |
11.3% |
83.9% |
49.1% |
|
25/2/2019 |
FXD1/2019/10 |
10.0 |
12.4% |
50.0 |
32.8 |
12.4% |
72.7% |
90.3% |
|
|
4 |
25/3/2019 |
IFB1/2019/25 |
25.0 |
12.2% |
50.0 |
16.3 |
12.7% |
58.8% |
55.5% |
|
Average |
146.5% |
56.7% |
|||||||
Primary T-bond auctions in Q1’2019 were oversubscribed, with the subscription rate averaging 146.5% for the quarter, higher than the average subscription rate for Q4’2018, which was 64.5%. The average acceptance rate for the quarter came in at 56.7%, as the CBK continued to reject bids deemed expensive in order to maintain the rates at low levels, with government reopening two bonds, namely the FXD1/2019/2 and the FXD1/2019/15 to plug in any deficits from the initial issuances. The re-opened bonds were better received by the market, recording a higher subscription rate averaging 213.0%, compared to 94.0% for first issuances. The government accepted Kshs 131.6 bn against a target of Kshs 254.0 bn during the quarter.
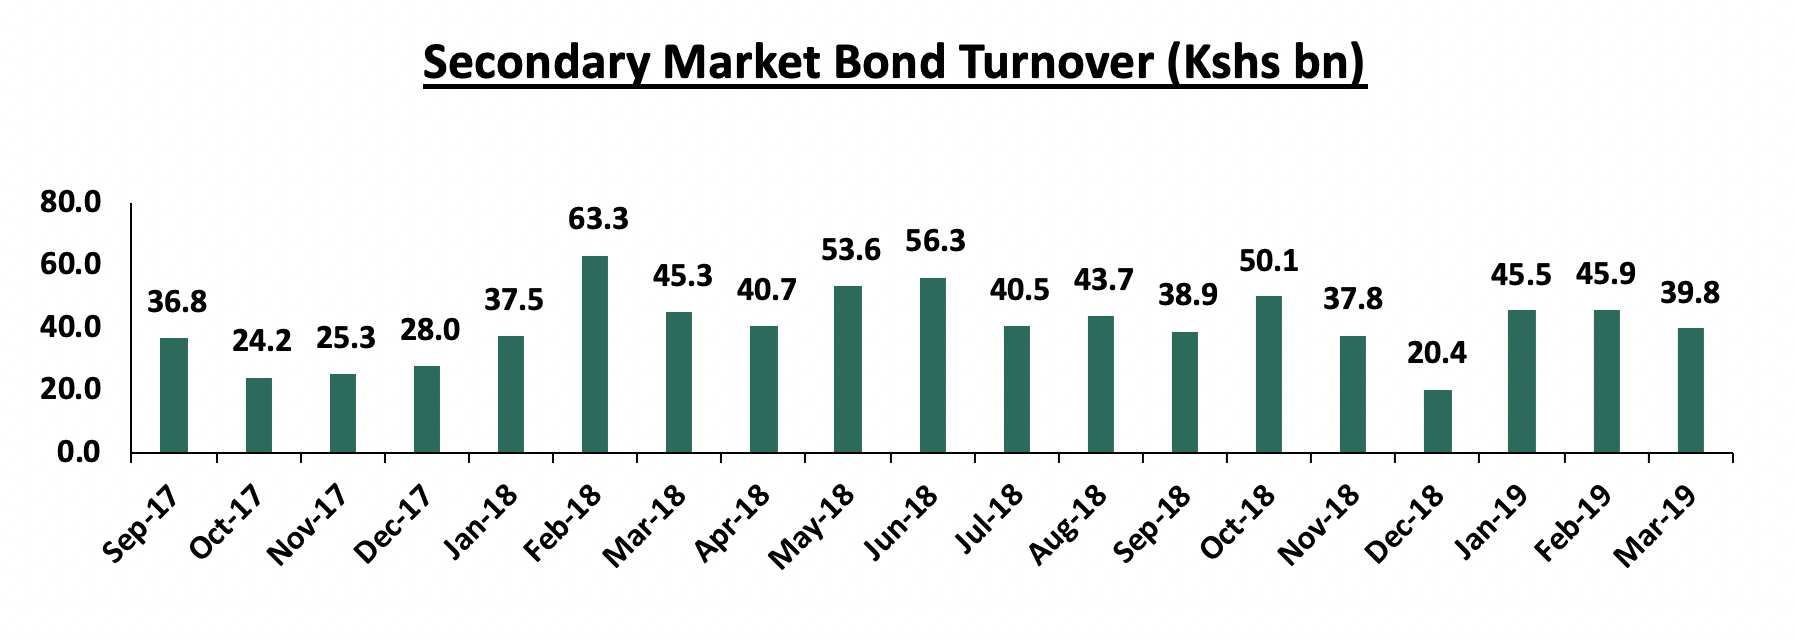
Secondary Bond Market Activity:
The NSE FTSE bond index recorded a 1.3% gain in Q1’2019, with the secondary bond market recording increased activity, with the turnover having increased by 21.1% to Kshs 131.2 bn from Kshs 108.2 bn in Q4’2018, as the local institutional investors increased their allocation to treasury bonds, mostly attributed to the interest rate cap that has seen banks shy away from lending due to the associated risk and instead increasing their allocation to government securities.
Liquidity:
In this quarter, liquidity levels remained stable and well distributed in the market as indicated by the 47.9% decline in the average volumes traded in the interbank market to Kshs 9.7 bn, from Kshs 18.6 bn recorded in Q4’2018, and the subsequent decline in the interbank rate to 3.1%, from 6.7% the previous quarter. During the week, liquidity tightened with the average interbank rate rising to 3.1%, from 2.3% recorded the previous week. There was a decrease in the average volumes traded in the interbank market by 54.3% to Kshs 1.6 bn, from Kshs 3.4 bn the previous week.
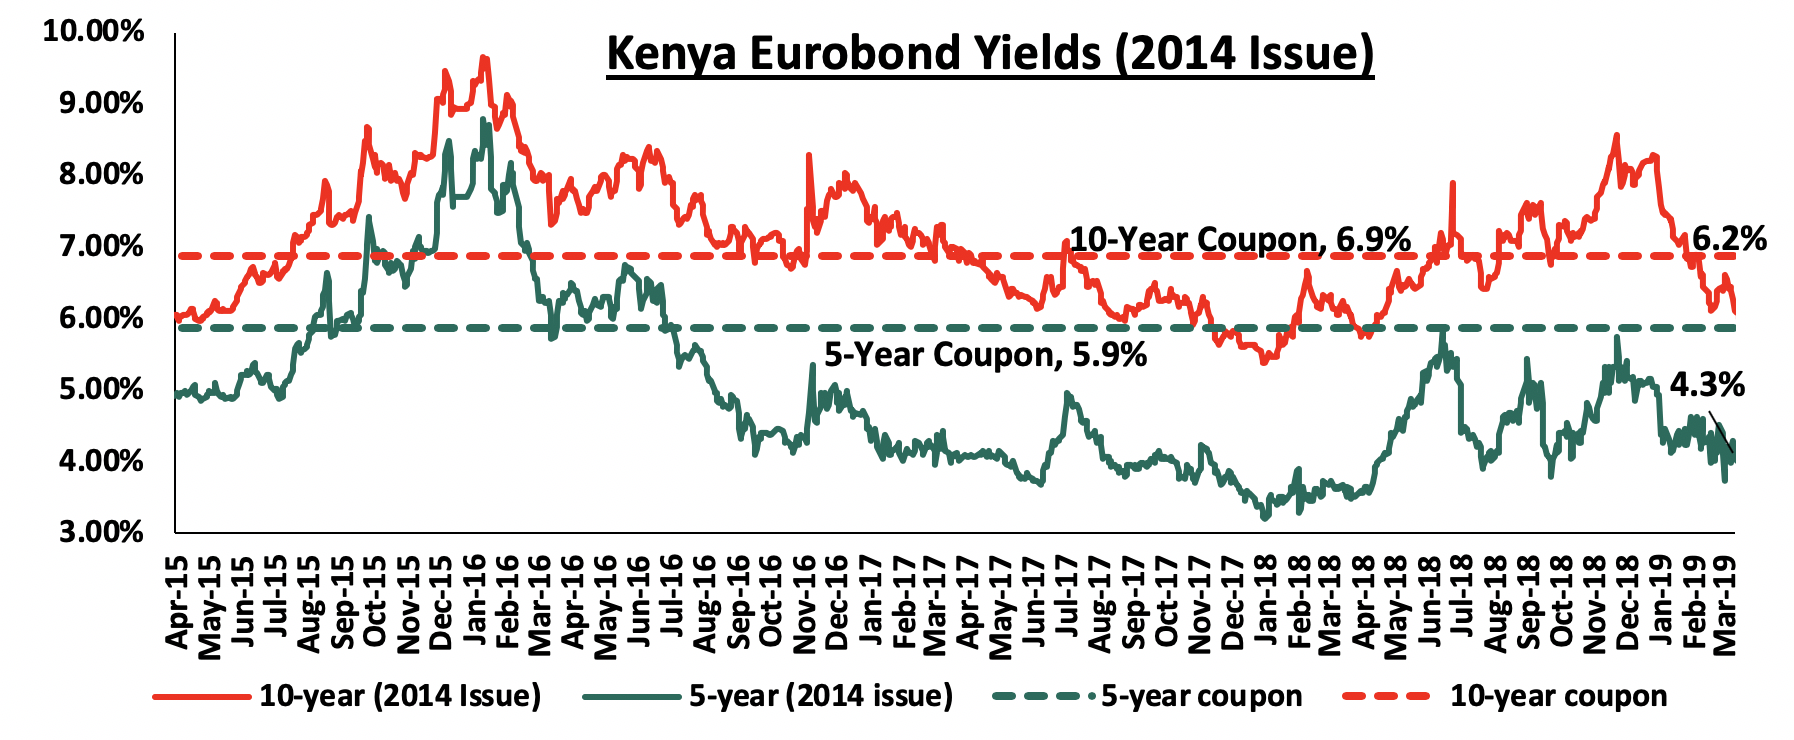
Kenya Eurobonds:
According to Bloomberg, yields on the 5-year and the 10-year Eurobond issued in 2014 declined by 0.7% points and 2.0% points to close at 4.3% and 6.2% in Q1’2019, from 5.0% and 8.2% in Q4’2018, respectively an indication of improved investor risk perception. Since the mid-January 2016 peak, yields for both the 5-year and 10-year Eurobonds have declined by 2.2% points, due to the relatively stable macroeconomic conditions in the country. Key to note is that these bonds have 0.3-years and 5.3-years to maturity for the 5-year and 10-year, respectively.
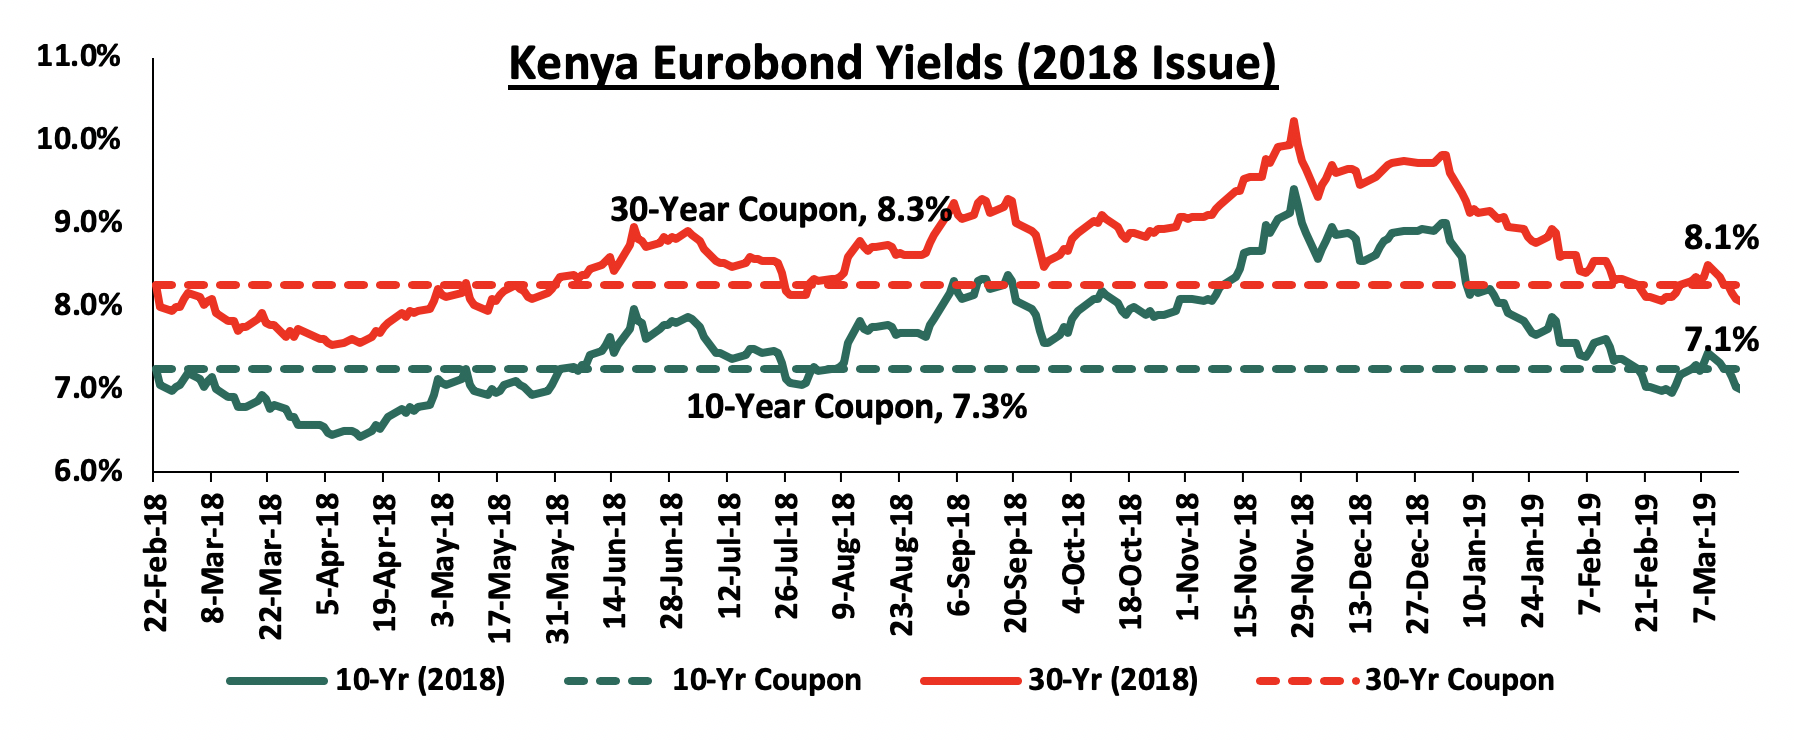
For the February 2018 Eurobond issue, the yields on the 10-year Eurobond and the 30-year Eurobond declined by 1.8% points and 1.6% points to close Q1’2019 at 7.1% and 8.1% from 8.9% and 9.7% at the end of Q4’2018, respectively.
Rates in the fixed income market have remained stable as the government rejects expensive bids, being currently 8.8% ahead of its domestic borrowing target for the current financial year, having borrowed Kshs 259.5 bn against a pro-rated target of Kshs 238.5 bn. A budget deficit is likely to result from depressed revenue collection, creating uncertainty in the interest rate environment as additional borrowing from the domestic market goes to plug the deficit. Despite this, we do not expect upward pressure on interest rates due to increased demand for government securities, driven by improved liquidity in the market owing to the relatively high debt maturities. Our view is that investors should be biased towards medium-term fixed income instruments to reduce duration risk associated with long-term debt, coupled with the relatively flat yield curve on the long-end due to saturation of long-term bonds.
Market Performance:
During Q1’2019, the equities market was on an upward trend, with NASI, NSE 25 and NSE 20 gaining by 12.2%, 10.8% and 0.4%, respectively, taking their YTD performance as at the end of March to 12.2%, 10.8% and 0.4% for NASI, NSE 25 and NSE 20, respectively. The equities market performance during the quarter was supported by gains in large caps such as NIC Group, Safaricom, Equity and EABL that rose by 30.8%, 24.1%, 19.4%, and 18.0%, respectively.
During the week, the equities market was on a downward trend with NASI, NSE 25 and NSE 20 declining by 0.3%, 0.1% and 1.7%, respectively, due to declines in large cap stocks such as Equity, DTB, Co-operative Bank and Safaricom, which declined by 4.4%, 4.1%, 3.9%, and 2.1%, respectively. For the last twelve months (LTM), NASI, NSE 25 and NSE 20 have declined by 17.6%, 20.7% and 26.0%, respectively.
Equities turnover gained by 29.5% during the quarter to USD 445.8 mn in Q1’2019 from USD 344.2 mn in Q4’2018, taking the YTD turnover to USD 445.8 mn. During the week, equities turnover declined by 10.7% to USD 30.7 mn from USD 34.4 mn in the previous week. Foreign investors remained net buyers this week, with a net buying position of USD 7.2 mn, which is a 166.8% increase from last week’s net buying position of USD 2.7 mn.
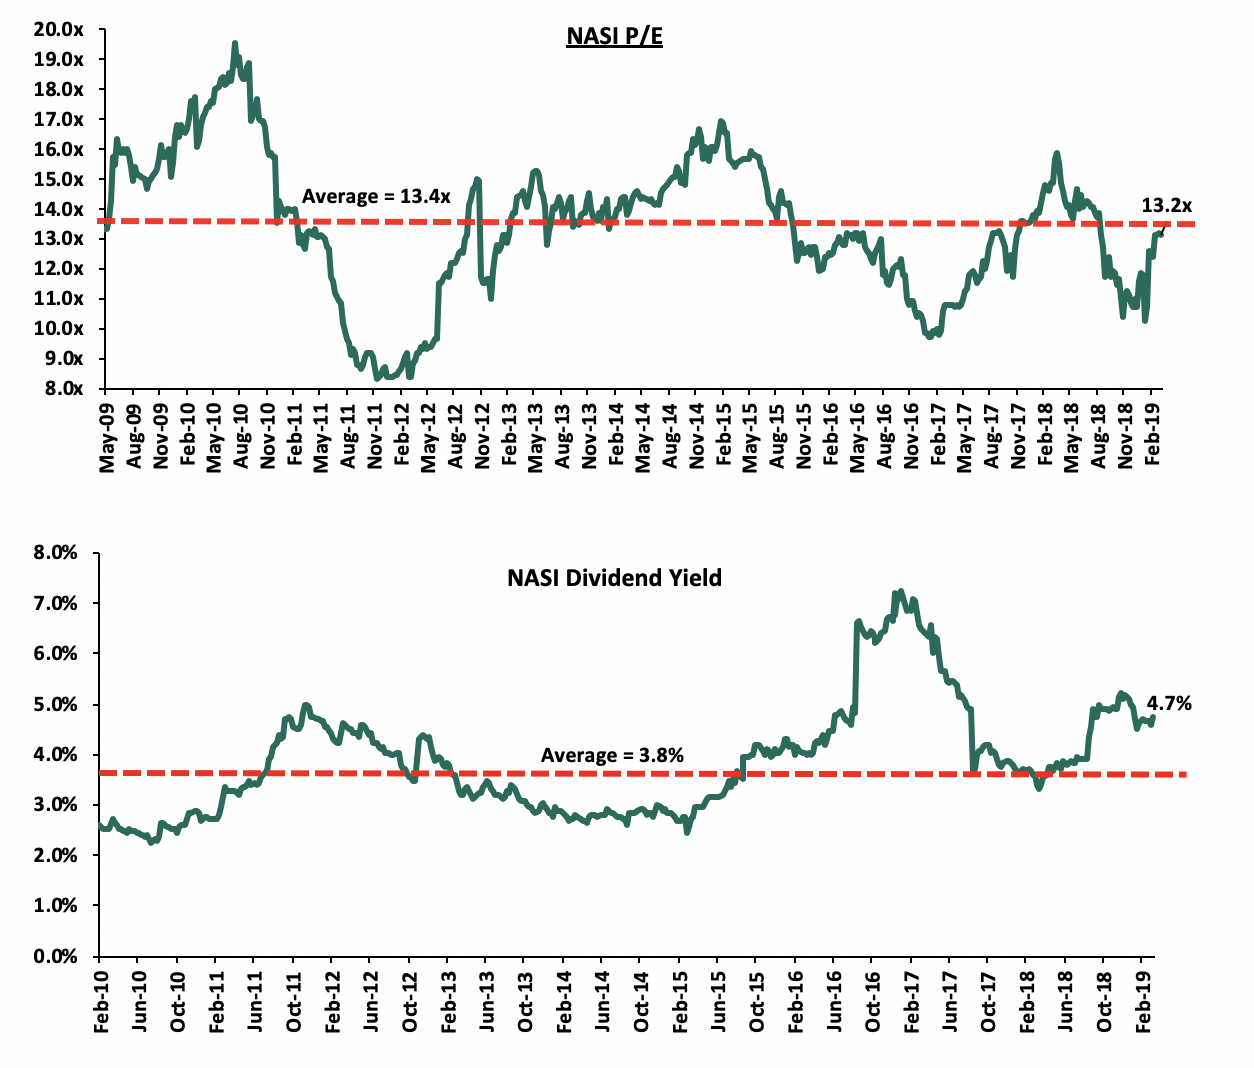
The market is currently trading at a price to earnings ratio (P/E) of 13.2x, 1.6% below the historical average of 13.4x, and a dividend yield of 4.7%, above the historical average of 3.7%. With the market trading at valuations below the historical average, we believe there is value in the market. The current P/E valuation of 13.2x is 35.7% above the most recent trough valuation of 9.7x experienced in the first week of February 2017, and 58.6% above the previous trough valuation of 8.3x experienced in December 2011. The charts below indicate the historical P/E and dividend yields of the market.
Kenyan Listed Banks Results
A number of Banks released their FY’2018 results during the week:
- Equity Holdings released FY’2018 results, registering an increase in its core earnings per share by 4.8% to Kshs 5.25 from Kshs 5.0 in FY’2017, slower than our projections of an 11.3% increase to Kshs 5.6. The performance was driven by a 3.3% increase in total operating income, which outpaced the 1.4% increase in total operating expenses. The variance in core earnings per share growth against our expectations was largely due to the 1.4% rise in total operating expenses to Kshs 38.8 bn from Kshs 38.3 bn in FY’2017, which was contrary to our expected 3.9% decline. For more information, see our Equity Holdings FY’2018 Earnings Note
- I&M Holdings released FY’2018 results, registering an increase in its core earnings per share by 17.1% to Kshs 20.6 from Kshs 17.6 in FY’2017, higher than our projections of a 15.3% increase to Kshs 20.3. The performance was driven by an 8.8% increase in total operating income, which outpaced the 2.6% increase in total operating expenses. The variance in core earnings per share growth against our expectations was largely due to the 2.6% rise in total operating expenses to Kshs 12.3 bn from Kshs 12.0 bn in FY’2017, which was slower than our expectation of a 5.9% rise. For more information, see our I&M Holdings FY’2018 Earnings Note
- National Bank of Kenya released FY’2018 results, registering an increase in its core earnings per share (EPS) by5% to Kshs 1.6, from Kshs 1.2 in FY’2017, exceeding our expectation of an 11.3% increase to Kshs 1.4. However, the core performance was due to the stripping out of an exceptional expense of Kshs 0.5 bn. The bank registered a 98.3% decline in profit after tax to Kshs 7.0 mn from Kshs 0.4 bn in FY’2017. The performance was as a result of a 12.4% decline in total operating income to Kshs 8.0 bn, from Kshs 9.2 bn in FY’2017, which outpaced the 9.6% decline in the total operating expenses to Kshs 7.6 bn, from Kshs 8.4 bn in FY’2017. The variance in core earnings per share growth against our expectations was largely due to the faster 9.6% decline in total operating expenses to Kshs 7.6 bn, from Kshs 8.4 bn previously, exceeding our expectation of a 0.6% decline. For more information, see our NBK FY’2018 Earnings Note
- HF Group released FY’2018 results, recording a loss per share of Kshs 1.7 in FY’2018, from a core earnings per share of Kshs 0.4 recorded in FY’2017, which exceeded our expectations of a loss per share of Kshs 0.2. The performance was as a result of a 17.1% decline in total operating income, coupled with a 6.2% rise in the total operating expenses. The variance in core earnings per share growth against our expectations was largely due to the 17.1% decline in total operating income to Kshs 3.6 bn, from Kshs 4.3 bn in FY’2017, which outpaced our expectation of a 10.4% decline. For more information, see our HF Group FY’2018 Earnings Note
During the quarter, listed banks in Kenya released their FY’2018 results, recording average core earnings per share growth of 13.8%, against a 1.0% decline for the same time last year. The table below highlights the performance of the banking sector, showing the performance using several metrics, and the key takeaways of the performance:
|
Summary of Performance of Listed Banks – FY’2018 |
|||||||||||||||
|
Bank |
Core EPS Growth |
Interest Income Growth |
Interest Expense Growth |
Net Interest Income Growth |
Net Interest Margin |
Non-funded income Growth |
NFI to Total Operating Income |
Growth in Total Fee and Commissions |
Deposit Growth |
Growth in Govt Securities |
Cost to Income |
Loan to Deposit Ratio |
Loan Growth |
Cost of Funds |
Return on Average Equity |
|
Stanbic |
45.7% |
13.8% |
19.2% |
14.0% |
5.0% |
18.3% |
45.1% |
15.5% |
13.5% |
3.7% |
59.5% |
79.7% |
22.1% |
3.5% |
14.3% |
|
NBK |
33.5% |
(10.5%) |
(10.9%) |
(22.6%) |
6.5% |
(30.3%) |
24.8% |
(72.5%) |
4.9% |
89.0% |
94.3% |
48.3% |
(8.8%) |
2.8% |
0.1% |
|
KCB |
21.8% |
4.1% |
14.1% |
0.9% |
8.2% |
(0.1%) |
32.0% |
(25.3%) |
7.6% |
9.1% |
52.8% |
84.8% |
7.9% |
3.2% |
21.9% |
|
SCBK |
17.1% |
2.3% |
(3.0%) |
4.5% |
7.5% |
4.9% |
32.2% |
19.7% |
5.1% |
(10.7%) |
58.6% |
52.9% |
(6.1%) |
3.3% |
17.5% |
|
I&M |
17.1% |
6.4% |
17.3% |
0.3% |
7.0% |
32.8% |
32.8% |
59.1% |
25.9% |
(20.0%) |
53.0% |
78.2% |
9.0% |
4.9% |
17.4% |
|
Co-op |
11.6% |
6.6% |
(0.2%) |
9.5% |
9.5% |
(4.4%) |
29.5% |
(3.0%) |
6.5% |
10.4% |
58.8% |
80.2% |
(3.3%) |
3.8% |
18.3% |
|
BBK |
7.1% |
7.0% |
31.6% |
0.9% |
8.6% |
14.7% |
30.6% |
6.7% |
11.5% |
58.9% |
66.4% |
85.5% |
5.3% |
3.5% |
16.8% |
|
Equity |
4.8% |
10.0% |
8.9% |
10.3% |
8.5% |
(6.3%) |
38.4% |
(16.6%) |
13.3% |
1.9% |
57.7% |
70.3% |
6.5% |
2.7% |
22.5% |
|
DTBK |
2.3% |
1.8% |
2.0% |
1.8% |
6.2% |
3.0% |
21.3% |
5.7% |
6.2% |
2.6% |
56.9% |
68.3% |
(1.5%) |
4.9% |
13.1% |
|
NIC |
2.0% |
4.8% |
14.1% |
(1.8%) |
5.7% |
11.4% |
30.5% |
9.2% |
4.0% |
12.9% |
61.7% |
81.7% |
(1.4%) |
5.2% |
12.1% |
|
HF |
N/A |
(15.2%) |
(9.1%) |
(23.9%) |
4.2% |
(2.0%) |
36.8% |
23.3% |
(5.3%) |
75.0% |
(118.2%) |
125.1% |
(12.5%) |
7.4% |
(5.5%) |
|
2018 Mkt cap Weighted Average |
13.8% |
6.4% |
10.6% |
5.2% |
7.9% |
3.8% |
33.3% |
(1.0%) |
10.3% |
8.0% |
57.5% |
75.8% |
4.3% |
3.5% |
18.9% |
|
2017 Mkt cap Weighted Average |
(1.0%) |
(2.4%) |
2.6% |
(3.8%) |
8.4% |
9.1% |
33.6% |
13.4% |
12.5% |
22.2% |
61.1% |
80.0% |
6.1% |
3.6% |
17.6% |
Key takeaways from the table above include:
- All listed Kenyan banks have released results for FY’2018, and have recorded a 13.8% average increase in core Earnings Per Share (EPS), compared to a decline of 1.0% in FY’2017, and consequently, the Return on Average Equity (RoAE) increased to 18.9%, from 17.6% in FY’2017. All listed banks apart from HF Group have recorded growths in their core EPS, with Stanbic Holdings recording the highest growth of 45.7%, and the lowest being HF Group, which recording a loss per share of Kshs 1.7,
- The sector recorded weaker deposit growth, which came in at 10.3%, slower than the 12.5% growth recorded in FY’2017. Despite the slower deposit growth, interest expenses increased by 10.6%, indicating banks have been mobilizing expensive deposits. However, with the removal of the limit of interest payable on deposits, the associated interest expenses on deposits is expected to improve in 2019, and possibly improve the cost of funds,
- Average loan growth came in at 4.3%, which was lower than the 6.1% recorded in FY’2017, indicating that there was an even slower credit extension to the economy, due to sustained effects of the interest rate cap. Government securities on the other hand recorded a growth of 8.0% y/y, which was faster compared to the loans, albeit slower than 22.2% recorded in FY’2017. This indicates that banks’ continued preference towards investing in government securities, which offer better risk-adjusted returns. Interest income increased by 6.4%, compared to a decline of 2.4% recorded in FY’2017, as banks adapted to the interest rate cap regime, with increased allocations in government securities. The Net Interest Income (NII) thus grew by 2.5% compared to a decline of 3.8% in FY’2017,
- The average Net Interest Margin in the banking sector currently stands at 7.9%, down from the 8.4% recorded in FY’2017, despite the Net Interest Income increasing by 5.2% y/y. The decline was mainly due to the faster 8.0% increase in allocation to relatively lower yielding government securities, coupled with the decline in yields on loans due to the 100 bps Central Bank Rate (CBR) decline, and,
- Non-funded Income grew by 3.8% y/y, slower than 9.1% recorded in FY’2017. The growth in NFI was weighed down as total fee and commission declined by 1.0%, compared to the 13.4% growth recorded in FY’2017. The fee and commission income continued to be subdued by the slow loan growth, coupled with the implementation of the Effective Interest Rate (EIR) model under IFRS 9, which requires banks to amortize the fees and commissions on loans, over the tenor of the loan.
For a summary of the FY’2018 banking sector results and our key takeaways from the results, please see our Cytonn FY’2018 Banking Sector Performance Note. We shall be releasing our FY’2018 Banking Report on 14th April, 2019.
Quarterly Highlights:
During the quarter;
- A ruling by a three-Judge High Court Bench in Nairobi declared the Banking (Amendment) Act 2016 to be unconstitutional. Enacted in in 2016, the law stipulates a deposit and loan-pricing framework that provided for: (i) a cap on lending rates at 4.0% above the Central Bank Rate (CBR), and (ii) a floor on the deposit rates at 70.0% of the CBR, which was scrapped in October 2018. Following the ruling, the cap on lending rates at 4.0% above the Central Bank Rate (CBR) will no longer be effective, after the 12-months suspension period. For more information see our Cytonn Weekly #11/2019
- KCB Group has highlighted its intention to set up subsidiaries in Somalia and DRC Congo, as the bank aims to increase its regional footprint to 10 countries in the Eastern African region. This comes on the back of highlighting its intention to venture into Ethiopia, with the Ethiopian market becoming increasingly liberalized due to the reforms being implemented by the government. For more information see our Cytonn Weekly #12/2019
- The Central Bank of Kenya (CBK) published draft regulations for mortgage refinance companies (MRCs), setting the stage for creation of a State-backed firm that will advance cash to banks for onward lending to home buyers. Through the CBK (Mortgage Refinance Companies) Regulations 2019, the regulator provides for establishment of non-deposit taking firms under the Companies Act, licensed by the CBK to conduct mortgage refinance business. For more information see our Cytonn Weekly #08/2019
- The Capital Markets Authority (CMA) released The Report on the State of Corporate Governance of Issuers of Securities to The Public in Kenya. The findings suggest a “Fair” status of 55.0% weighted overall score in the application of corporate governance practices by Kenyan issuers of securities to the public. The report analyzed 62 listed companies and 5 issuers of corporate bonds. For more information see our Cytonn Monthly January 2019
- The amendment to the Income Tax Act, included in the Finance Act 2018, was made public. The amendment introduced a requirement for Kenyan firms to pay a 30.0% tax on dividends received from their subsidiaries, and are redistributed to shareholders. This was a significant alteration to previous legislation in which a holding company would receive dividends from its subsidiary, without paying the withholding tax, if its ownership in the subsidiary exceeded 12.5%. For more information see our Cytonn Weekly #06/2019
- Commercial Bank of Africa (CBA) issued a cash buy-out offer of Kshs 1.4 bn to Jamii Bora bank. The Kshs 1.4 bn buyout represents a steep discount from the Kshs 3.4 bn book value as at Q1’2018. This implies the transaction, if the offer is accepted and no further injections made, would happen at a Price to Book ratio (P/Bv) of 0.4x, significantly lower than the average P/B ratio of 1.6x of recent transactions in the banking sector. For more information see our CBA Acquisition Note. In another transaction involving CBA and following the initial announcement of negotiations in December 2018, the respective Boards of Directors of CBA and NIC Group have proposed to recommend the merger of NIC and CBA to their shareholders. For a detailed analysis of the transaction, see our NIC-CBA Merger Note
Equities Universe of Coverage:
Below is our Equities Universe of Coverage:
|
Banks |
Price as at 22/03/2019 |
Price as at 29/03/2019 |
w/w change |
q/q change |
YTD Change |
Year Open |
Target Price* |
Dividend Yield |
Upside/Downside** |
P/TBv Multiple |
|
|
Diamond Trust Bank |
135.5 |
130.0 |
(4.1%) |
(16.9%) |
(16.9%) |
156.5 |
283.7 |
2.0% |
120.2% |
0.7x |
|
|
GCB Bank |
4.0 |
4.0 |
0.0% |
(13.0%) |
(13.0%) |
4.6 |
7.7 |
9.5% |
102.5% |
0.9x |
|
|
CRDB |
125.0 |
125.0 |
0.0% |
(16.7%) |
(16.7%) |
150.0 |
207.7 |
0.0% |
66.2% |
0.4x |
|
|
Zenith Bank |
22.1 |
21.8 |
(1.1%) |
(5.4%) |
(5.4%) |
23.1 |
33.3 |
12.4% |
65.2% |
1.0x |
|
|
I&M Holdings |
94.3 |
113.5 |
20.4% |
33.5% |
33.5% |
85.0 |
138.6 |
3.1% |
25.2% |
1.0x |
|
|
UBA Bank |
7.8 |
7.7 |
(1.3%) |
0.0% |
0.0% |
7.7 |
10.7 |
11.0% |
50.0% |
0.5x |
|
|
KCB Group*** |
44.7 |
44.1 |
(1.5%) |
17.6% |
17.6% |
37.5 |
61.3 |
7.9% |
47.1% |
1.4x |
|
|
Access Bank |
6.9 |
6.5 |
(5.8%) |
(5.1%) |
(5.1%) |
6.8 |
9.5 |
6.2% |
53.5% |
0.4x |
|
|
Ecobank |
7.7 |
8.0 |
3.9% |
7.1% |
7.1% |
7.5 |
10.7 |
0.0% |
33.6% |
1.7x |
|
|
CAL Bank |
1.0 |
1.1 |
1.0% |
7.1% |
7.1% |
1.0 |
1.4 |
0.0% |
33.3% |
0.9x |
|
|
NIC Group |
37.0 |
36.4 |
(1.8%) |
30.8% |
30.8% |
27.8 |
48.8 |
2.8% |
37.0% |
1.0x |
|
|
Co-operative Bank |
15.6 |
15.0 |
(3.9%) |
4.5% |
4.5% |
14.3 |
19.9 |
6.7% |
39.8% |
1.4x |
|
|
Equity Group |
43.5 |
41.6 |
(4.4%) |
19.4% |
19.4% |
34.9 |
56.2 |
4.8% |
39.9% |
2.1x |
|
|
HF Group |
5.2 |
5.0 |
(3.8%) |
(9.7%) |
(9.7%) |
5.5 |
6.6 |
7.0% |
39.0% |
0.2x |
|
|
Stanbic Bank Uganda |
29.0 |
30.0 |
3.6% |
(3.2%) |
(3.2%) |
31.0 |
36.3 |
3.9% |
24.8% |
2.1x |
|
|
Union Bank Plc |
6.9 |
6.7 |
(2.9%) |
18.8% |
18.8% |
5.6 |
8.2 |
0.0% |
22.6% |
0.7x |
|
|
Bank of Kigali |
265.0 |
275.0 |
3.8% |
(8.3%) |
(8.3%) |
300.0 |
299.9 |
5.0% |
14.1% |
1.5x |
|
|
SBM Holdings |
6.0 |
6.0 |
(0.3%) |
0.3% |
0.3% |
6.0 |
6.6 |
5.0% |
14.7% |
0.9x |
|
|
Barclays Bank |
12.0 |
11.8 |
(1.3%) |
7.8% |
7.8% |
11.0 |
12.5 |
8.5% |
14.4% |
1.6x |
|
|
Guaranty Trust Bank |
37.5 |
36.1 |
(3.9%) |
4.6% |
4.6% |
34.5 |
37.1 |
6.7% |
9.6% |
2.3x |
|
|
Bank of Baroda |
130.0 |
130.0 |
0.0% |
(7.1%) |
(7.1%) |
140.0 |
130.6 |
1.9% |
2.4% |
1.1x |
|
|
Stanbic Holdings |
97.8 |
100.0 |
2.3% |
10.2% |
10.2% |
90.8 |
92.6 |
5.9% |
(1.6%) |
0.9x |
|
|
National Bank |
5.0 |
4.9 |
(0.4%) |
(7.3%) |
(7.3%) |
5.3 |
4.9 |
0.0% |
(0.6%) |
0.4x |
|
|
Standard Chartered |
20.0 |
20.0 |
0.0% |
(4.8%) |
(4.8%) |
21.0 |
19.5 |
0.0% |
(2.7%) |
2.5x |
|
|
Standard Chartered |
217.3 |
215.3 |
(0.9%) |
10.7% |
10.7% |
194.5 |
196.3 |
5.8% |
(3.0%) |
1.8x |
|
|
FBN Holdings |
8.3 |
8.2 |
(0.6%) |
3.1% |
3.1% |
8.0 |
6.6 |
3.0% |
(16.1%) |
0.5x |
|
|
Stanbic IBTC Holdings |
45.5 |
46.0 |
1.1% |
(4.1%) |
(4.1%) |
48.0 |
37.0 |
1.3% |
(18.3%) |
2.3x |
|
|
Ecobank Transnational |
13.4 |
13.2 |
(1.5%) |
(22.4%) |
(22.4%) |
17.0 |
9.3 |
0.0% |
(29.7%) |
0.5x |
|
|
*Target Price as per Cytonn Analyst estimates **Upside / (Downside) is adjusted for Dividend Yield ***Banks in which Cytonn and/or its affiliates holds a stake. ****Stock prices indicated in respective country currencies |
|||||||||||
We are “Positive” on equities for investors as the sustained price declines has seen the market P/E decline to below its historical average. We expect increased market activity, and possibly increased inflows from foreign investors, as they take advantage of the attractive valuations, to support the positive performance.
Financial Services Sector:
Deals in the Financial Services sector during the quarter include;
- Sidian Bank, a Kenyan Tier 3 bank, received a USD 12.0 mn (Kshs 1.2 bn) Tier II capital injection from the Investment Fund for Developing Countries (IFU), a Danish Development Finance Institution (DFI). The funds are expected to boost the bank’s regulatory capital ratios as it works towards achieving its strategic objective of becoming a Tier 2 bank by 2022, as the bank’s total capital to total risk-weighted assets ratio was 14.0% as at Q3’2018 and 14.4% as at FY’2018, which is below the minimum statutory requirement of 14.5% for banks. With Sidian Bank having an equity position of Kshs 3.6 bn as at Q3’2018, the transaction was done at a price-to-book value (P/Bv) multiple of 1.6x, which is a 6.7% premium to the current listed banks trading multiple of 1.5x. For more information, see our Cytonn Weekly #10/2019, and,
- Private Equity firms AfricInvest, which is based in Tunisia, and Catalyst Principal Partners, based in Kenya, acquired a minority stake in Prime Bank Kenya. The stake acquired is 24.2% of Prime Bank Kenya, through a capital injection of Kshs 5.1 bn, with the capital targeted to carry out strategic plans including expanding locally and into the region. As at Prime Bank’s last reporting in Q3’2018, the bank had a book value of Kshs 21.2 bn, and as such, the transaction was carried out at a price-to-book value (P/Bv) of 1.0x, which is a 33.3% discount to the market’s current trading valuation of 1.5x P/Bv for listed Kenyan banks. This was the first bank acquisition in 2019, and in line with our expectation of consolidation in the Kenya banking sector following the enactment of the Banking (Amendment) Act, 2015 and the fact that Kenya is overbanked, as highlighted in our Q3’2018 Banking Sector Report. For more information, see our Prime Bank Kenya Acquisition Note.
We expect that investors will continue to show interest in the financial services sector, motivated by attractive valuations especially in the banking sub-sector, growth of financial inclusion and regulation that requires institutions to increase their capital requirements across the sector consequently providing an opportunity for mergers and acquisitions.
FinTech Sector:
Deals in the FinTech sector during the quarter include;
- Kenya’s second and third largest telecommunication companies, Airtel and Telkom, announced the signing of a binding agreement that will see the shareholders of the two companies merge their respective mobile, enterprise, and carrier services businesses in Kenya to operate under a joint venture company. We expect this merger to have the following effects on the Kenyan telecommunication space: (i) Subscriptions / Voice Market Share is expected to be split between two major players with the merged entity set to increase its share, (ii) The combined entity will command a market share of 29.6%, (iii) Airtel will make an entry into the fixed data services market, and (iv) Mobile Money is least likely to be affected given that neither of the two merging entities have a significant share in the market. The overall effect to the market is that we will now have a company that has scale to provide a credible market alternative to the currently dominant Safaricom. For more information, see our Cytonn Weekly #06/2019,
- Branch International, a mobile-based microfinance institution headquartered in California with operations in Kenya, Tanzania and Nigeria, raised Kshs 500.0 mn (USD 4.9 mn) in capital investment based on its third issued commercial paper in the Kenyan market. The Silicon Valley start-up, founded in 2015, processes loans ranging from Kshs 250 to Kshs 70,000 daily and applies machine learning to create an algorithmic approach to determine credit worthiness via customers' smartphones. The commercial paper was arranged by Barium Capital, a capital–raising advisory firm owned by Centum Investments. For more information, see our Cytonn Weekly #03/2019,
- OneFi, a Nigeria-based FinTech firm that provides mobile loans to clients, announced plans to buy out Amplified Payment System Limited (Amplify), a mobile payment solutions firm that provides platforms to connect banks based in Nigeria for an undisclosed amount. According to the announcement, OneFi will acquire Amplify’s intellectual property, staff and clientele, comprising of more than 1,000 merchants who transact on the platform. For more information, see our Cytonn Weekly #12/2019,
- Dutch impact investor Goodwell Investments made a USD 2.0 mn (Kshs 203.0 mn) investment in Nairobi-based consumer goods catalogue and delivery service Copia for an undisclosed stake. Copia, a Silicon Valley start-up launched in Kenya in 2013, uses technology and a network of more than 3,000 local agents to deliver goods and services to about 40,000 “underserved consumers” in rural Kenya. Copia enables households to access goods that would otherwise be difficult to obtain without travelling to a major city. For more information, see our Cytonn Weekly #04/2019.
The growing interest in FinTech sector, driven by Africa’s low penetration rates for traditional banking services at 25% according to the Global Findex database and high mobile penetration at 44% according to the Global System for Mobile Communications (GSMA) 2017 Report. We expect that investors will continue to show interest in the FinTech sector in Sub-Saharan Africa as more businesses seek to enhance efficiency and reduce costs by incorporating technology in their operations. Furthermore, the significant difference in credit extension activity in Africa compared to other regions gives FinTech lending firms a perfect opportunity to provide credit via convenient and already established channels.
Education Sector:
Deals in the Education sector during the quarter include;
- GEMS Education announced its plan to acquire 100.0% stake of Hillcrest International Schools from its current owners, Fanisi Capital and businessman Anthony Wahome, for Kshs 2.6 bn. Currently, Fanisi owns 55.0% stake in the school, while Mr. Wahome owns 45.0% following an acquisition from Barclays Bank of Kenya, the family of Kenneth Matiba and other creditors in 2011, for a total of Kshs 1.8 bn. For more information, see our Cytonn Monthly – January 2019.
- The African Management Initiative (AMI), a Pan-African company focused on skills development and workplace learning announced the close of a USD 1.8 mn (Kshs 180.2 mn) Series A funding round aimed at promoting in-person as well as on-the-job training for staff in African countries. Investisseurs & Partenaires (I&P), a French impact investing group dedicated to Sub-Saharan Africa, invested USD 1.0 mn in the funding round. The firm aims to use the funds to enhance its innovative mobile-based learning platform and widen its market coverage in Africa. For more information, see our Cytonn Weekly #08/2019.
We expect that investors will continue to show interest in the Education sector in Sub-Saharan Africa mainly as a result of the (i) increasing demand for quality and affordable education, with the Gross Enrolment Ratio (GER) having doubled over 10-years to 8.5% in 2016, from 4.5% in 2006, according to a report, “The Business of Education in Africa” by Caerus Capital, and (ii) support, such as ease of approvals, offered to investors in the education sector by governments looking to meet Sustainable Development Goals (SDGs) targets of universal access to tertiary education.
Hospitality Sector:
- Inside Capital Partners, a Mauritian independent private equity manager announced a commitment to invest USD 7.5 mn (Kshs 756.1 mn) in Latitude Hotels Group, an African lifestyle hospitality Group based in Zambia, for an undisclosed stake. Latitude Group currently runs 3 hotels in Zambia, Malawi and Uganda. The hospitality group will use the funds to develop three additional hotels in Kenya, Ethiopia and Mauritius by 2021. The fund manager, who is currently proceeding with a second round of fundraising targeted to raise USD 60.0 mn (Kshs 6.0 bn), is expected to make further investments in the hospitality sector targeting entities with an underlying strong net asset value, above market occupancy levels and a strong development pipeline. For more information, see our Cytonn Weekly #08/2019.
We expect that investors will continue to show interest in the Hospitality sector in Sub-Saharan Africa mainly as a result of the (i) economic growth, which is projected to improve in Africa’s most developed PE markets, (ii) attractive valuations in Sub-Saharan Africa’s private markets compared to its public markets, and (iii) attractive valuations in Sub-Saharan Africa’s markets compared to global markets.
Reports:
- African Private Equity and Venture Capital Association (AVCA) released four reports during Q1’2019. The reports are;
- The 2018 Annual African Private Equity (PE) Data Tracker, which indicated that the total value of African PE fundraising increased by 12.5% to USD 2.7 bn (Kshs 272.2 bn) in 2018 from USD 2.4 bn (Kshs 241.9 bn) in 2017. This was an indication of a positive shift in investors’ confidence in Africa’s PE industry following declines in 2016 and 2017, after a peak in 2015, which saw a handful of large funds achieving final closes during the year. For more information, see our Cytonn Weekly #11/2019,
- The 2018 Annual Limited Partner (LP) Survey, which was a study that analyses the plans, views, preferences, expectations and evolving attitudes of 60 Limited Partners (LPs) from Africa, Asia, Europe and North America regarding Private Equity (PE) in Africa. According to the report, LPs’ appetite for African PE has remained steady, with 53.0% of LPs planning to increase their PE allocation on the continent over the next three-years and Nigeria being viewed by majority of LPs as the most attractive country for PE investment in Africa over the next three-years with a popularity index ranking of 58.0%, followed by Kenya (40.0%) and Egypt (31.0%). For more information, see our Cytonn Weekly #06/2019,
- The 2019 Profile of Africa’s Institutional Investors, which mapped the different pools of capital for African private equity and also provided an overview of the demographics of institutional investors with allocations to Africa. According to the report, majority of the institutions are European based with 36.0% having their head offices in Europe while North American based institutions came second at 32.0% of the total. For more information, see our Cytonn Weekly #06/2019,
- The Private Credit Strategies in Africa Report that provided an overview of some of the key opportunities and challenges facing the private credit industry in Africa. According to the report, a major driver of the increasing interest in private credit in Africa relates to the difficulties that small and medium-sized enterprises (SMEs) in Africa often face in accessing financing through traditional avenues, such as banks. For more information, see our Cytonn Monthly – February 2019.
- The Competition Authority of Kenya (CAK) released their 2018 Annual Report, which highlighted the number of mergers that the Authority handled. The Authority handled 150 merger notifications in 2018, a 15.4% increase from 130 merger notifications handled in 2017. The merger notifications were mainly from the following sectors; manufacturing, real estate, distribution, investment, services, advertising and agriculture, which accounted for 51.2% of all the mergers that were notified to the Authority while other sectors accounted for the balance of 48.8%. Merger transactions involving international companies, mainly private equity funds, were 83 in 2018, accounting for 55.3% of the 150 merger notifications, while those involving local companies were 67 in 2018, accounting for 44.7% of the 150 merger notifications. For more information, see our Cytonn Weekly #07/2019.
Private equity investments in Africa remains robust as evidenced by the increasing investor interest, which is attributed to; (i) rapid urbanization, a resilient and adapting middle class and increased consumerism, (ii) the attractive valuations in Sub Saharan Africa’s private markets compared to its public markets, (iii) the attractive valuations in Sub Saharan Africa’s markets compared to global markets, and (iv) better economic projections in Sub Sahara Africa compared to global markets. We remain bullish on PE as an asset class in Sub-Sahara Africa. Going forward, the increasing investor interest and stable macro-economic environment will continue to boost deal flow into African markets.
In Q1’2019, the real estate sector recorded an array of activities across all themes supported by (i) continued demand for investment property from multinational individuals, firms and the growing middle class, (ii) the Kenyan Government’s efforts towards provision of affordable housing as part of its Big 4 Agenda, and (iii) continued infrastructural improvement, which is opening up new areas for development.
The key challenges that continue to face developers and end users include: (i) access to financing with private sector credit growth coming in at 4.4% in October 2018, compared to a 5-year (2013-2018) average of 14.0%, (ii) high land and construction costs, especially in the Nairobi Metropolitan Area, and (iii) increased supply in selected sectors such as the commercial office and retail sectors with a surplus of 5.2mn SQFT and 2.0mn SQFT, respectively, as at 2018.
In this report, we have reviewed notable activities and the performance of the residential, commercial, hospitality, land and listed real estate sectors during the quarter.
- Residential Sector
In Q1’2019, we continued to witness an increase in investor interest in the residential sector, particularly due to the ongoing focus on bridging the affordable housing shortage in Kenya. Residential projects unveiled during the quarter are as shown below:
|
Residential Projects in Q1’2019 |
||||||
|
Name of Developer |
Name of Project |
Location |
Typology |
Number of Units |
Project Stage |
Price Points (Kshs) |
|
Karibu Homes |
Riverview Estate |
Athi River |
1, 2, and 3 BR Apartments |
288 |
Completed |
2.5 mn – 5.8 mn |
|
Erdemann Properties |
River Estate |
Ngara |
1 & 2 BR Apartments |
2,720 |
Under construction |
3.0 mn -8.5 mn |
|
Sprinter Real Estate Investment |
Tigoni View |
Ndenderu |
2 & 3 BR Apartments |
300 |
Launch |
5.2 mn – 5.9 mn |
|
Actis |
Garden City Apartments Phase II |
Thika Rd |
|
600 |
Launch |
Unspecified |
|
Cytonn Real Estate |
Applewood |
Karen, Miotoni |
5 BR Villas |
19 |
Under Construction |
135 mn – 180 mn |
Online Sources
On the affordable housing initiative, major developments during the quarter were:
- The Government of Kenya announced the relaxation of affordable housing regulations to include high income-earners of Kshs 100,000 and above. For more information, please see Cytonn Weekly #04/2019,
- The Kenyan Government launched the bomayangu.go.ke portal, which will allow citizens to register and apply for affordable housing units online,
- Central Bank released Kenya Mortgage Refinance Company (KMRC) draft regulations for public participation, showing momentum for the actualization of the much-awaited mortgage facility.
Market Performance
The detached market registered subdued performance with an annual price depreciation of 1.5%, 2.4% and 1.4% for high-end, upper mid-end, and, lower mid-end markets, respectively. This is in comparison to apartments which posted average annual appreciation of 4.9%, 1.2% and 2.2% for upper mid-end suburbs, lower mid-end suburbs, and, Satellite Towns, respectively. Overall, apartments recorded an annual uptake of 23.6% in comparison to detached market’s 18.1%. This is as a result of increasing demand for affordable homes where apartments are more affordable to home buyers as compared to low rise properties.
- Detached
The lower mid-end market registered the highest annual average returns of 2.7% in comparison to the high-end and upper mid-end markets, which posted 1.9% and 1.7%, respectively. The subdued performance is as a result of select markets experiencing price depreciations due to a decline in demand for upmarket properties particularly due to high cost of financing and relatively low mortgage affordability in the market.
- High-End
The high-end market registered an annual price depreciation of 1.5% as a result of decline in asking prices in markets such as Kitisuru and Lower Kabete as developers attempt to attract buyers. Karen registered the highest annual returns in the high-end market with 7.3%, in comparison to other high-end markets, with an average of 1.9%. This is evidenced by the relatively high uptake during the quarter of 20.0% on average in comparison to the high-end market average of 18.0%. Karen’s demand is driven by its vibrancy especially due to the social amenities it hosts in comparison to markets like Runda and Kitisuru.
|
(All Values in Kshs Unless Stated Otherwise) |
||||||||
|
Detached Housing: High-End Markets Performance Q1’2019 |
||||||||
|
Area |
Average Price Per SQM Q1'2019 |
Average Rent Per SQM Q1'2019 |
Average Annual Uptake Q1'2019 |
Average Occupancy Q1’2019 |
Average Rental Yield Q1'2019 |
Q/Q Price Change |
Annual Price Appreciation |
2018/2019 Total Returns |
|
Karen |
203,968 |
764 |
20.0% |
76.6% |
3.4% |
1.3% |
3.9% |
7.3% |
|
Runda |
249,748 |
851 |
12.1% |
83.8% |
3.0% |
0.0% |
3.4% |
6.4% |
|
Rosslyn |
179,671 |
775 |
19.1% |
84.3% |
4.4% |
0.0% |
(5.0%) |
(0.6%) |
|
Kitisuru |
235,445 |
906 |
19.9% |
83.3% |
3.6% |
(0.9%) |
(4.5%) |
(0.9%) |
|
Lower Kabete |
175,160 |
477 |
19.0% |
89.5% |
2.8% |
0.0% |
(5.2%) |
(2.4%) |
|
Average |
208,798 |
755 |
18.0% |
83.5% |
3.4% |
0.1% |
(1.5%) |
1.9% |
|
||||||||
|
Source: Cytonn Research 2019 |
||||||||
- Upper Mid-End
The upper mid-end market posted average annual uptake of 18.7% and a price depreciation of 2.4% on average. This is owing to select markets such as South C and Lang’ata posting a decline in asking prices at 9.3% and 13.3%, respectively, attributable to a general market correction in these sub-markets.
|
(All Values in Kshs Unless Stated Otherwise) |
||||||||
|
Detached Housing: Top 5 Upper Mid-End Markets Performance Q1’2019 |
||||||||
|
Row Labels |
Average Price Per SQM Q1'2019 |
Average Rent Per SQM Q1'2019 |
Average Annual Uptake Q1'2019 |
Average Occupancy Q1’2019 |
Average Rental Yield Q1'2019 |
Q/Q Price Change |
Annual Price Appreciation |
2018/2019 Total Returns |
|
Redhill & Sigona |
105,285 |
354 |
21.1% |
77.5% |
3.5% |
0.8% |
7.5% |
11.1% |
|
Runda Mumwe |
137,654 |
599 |
26.1% |
83.6% |
4.6% |
0.0% |
2.0% |
6.6% |
|
Loresho |
146,041 |
570 |
17.5% |
94.6% |
4.4% |
1.7% |
1.3% |
5.7% |
|
South C |
120,928 |
494 |
16.3% |
92.5% |
4.6% |
(1.4%) |
(9.3%) |
(4.7%) |
|
Langata |
127,778 |
401 |
12.4% |
87.1% |
3.3% |
(0.4%) |
(13.3%) |
(10.0%) |
|
Average |
127,537 |
484 |
18.7% |
87.1% |
4.1% |
(0.1%) |
(2.4%) |
1.7% |
|
·In the upper mid-end market for detached units, Redhill posted the best returns at 11.1% attributable to an annual price appreciation of 7.5% in asking prices. Runda Mumwe prices remained flat largely attributble to increased development in the area. Langata had the least investor returns due to a decline in asking prices. This is attributable to increased densifiction of the area making it less attractive to investors seeking low rise homes |
||||||||
|
Source: Cytonn Research 2019 |
||||||||
- Low Mid-End
Ruiru had the highest returns in the lower mid-end market with 6.7% and an annual price appreciation of 2.1%, as a result of relatively high demand particularly from lower mid-income class working in Nairobi seeking a serene and easily accessible environment that is also in close proximity to commercial nodes.
|
(All Values in Kshs Unless Stated Otherwise) |
||||||||
|
Detached Housing: Top 5 Lower Mid-End Markets Performance Q1’2019 |
||||||||
|
Location |
Average Price Per SQM Q1'2019 |
Average Rent Per SQM Q1'2019 |
Average Annual Uptake Q1'2019 |
Average Occupancy Q1’2019 |
Average Rental Yield Q1'2019 |
Q/Q Price Change |
Annual Price Appreciation |
2018/2019 Total Returns |
|
Ruiru |
98,503 |
365 |
17.1% |
94.4% |
4.5% |
1.6% |
2.1% |
6.7% |
|
Donholm & Komarock |
87,539 |
343 |
21.1% |
88.0% |
4.3% |
0.8% |
0.0% |
4.3% |
|
Athi River |
93,516 |
390 |
19.5% |
72.2% |
3.7% |
0.6% |
(0.4%) |
3.4% |
|
Ngong |
56,464 |
239 |
15.0% |
72.8% |
3.9% |
(0.9%) |
(3.5%) |
0.4% |
|
Juja |
77,136 |
222 |
15.0% |
61.9% |
3.9% |
0.0% |
(5.3%) |
(1.4%) |
|
Average |
82,632 |
312 |
17.5% |
77.9% |
4.1% |
0.4% |
(1.4%) |
2.7% |
|
Ruiru had the highest returns in the lower mid-end market with 6.7% and an annual price appreciation of 2.1%, as a result of relatively high demand particularly from lower mid-income class working in Nairobi seeking a serene and easily accessible environment that is also in close proximity to commercial nodes. Juja's prices remained flat during the quarter but recorded an Annual decline of 5.3% in asking prices, largely attributable to competition from areas like Ruiru while Ngong posted a decline in prices which could be attributable to its location as well as insufficient infrastructure |
||||||||
|
Source: Cytonn Research 2019 |
||||||||
- Apartments
Apartments performed better compared to detached units with annual price appreciation averaging at 2.2% - 4.9%. This is due to increased demand for these units as they are more affordable in comparison to low rise units. Evidently, annual uptake for high rise units was relatively high averaging at 23.7%, 26.0%, and 21.1% for upper mid-end suburbs, lower mid-end suburbs, and Satellite Towns, respectively.
- Upper Mid-End Suburbs
|
(All Values in Kshs Unless Stated Otherwise) |
|||||||||
|
Apartments: Top 5 Upper Mid-End Suburb Markets Performance Q1’2019 |
|||||||||
|
Location |
Average Price Per SQM Q1'2019 |
Average Rent Per SQM Q1'2019 |
Average Annual Uptake Q 1'2019 |
Average Occupancy 2019 |
Average Rental Yield Q1'2019 |
Q/Q Price Change |
Annual Price Appreciation |
2018 /2019 Total Returns |
|
|
Riverside |
138,125 |
793.2 |
20.2% |
88.4% |
6.0% |
1.7% |
8.8% |
14.8% |
|
|
Kilimani |
124,197 |
598.4 |
28.2% |
70.2% |
3.9% |
1.6% |
8.8% |
12.6% |
|
|
Kileleshwa |
115,634 |
819.7 |
24.2% |
71.0% |
5.2% |
0.8% |
0.8% |
5.9% |
|
|
Parklands |
112,931 |
465.8 |
25.0% |
94.4% |
4.5% |
0.8% |
1.9% |
6.4% |
|
|
Westlands |
147,374 |
744.4 |
21.2% |
89.7% |
5.2% |
(1.6%) |
4.3% |
9.5% |
|
|
Average |
127,652 |
684.3 |
23.7% |
82.8% |
4.9% |
0.7% |
4.9% |
9.8% |
|
|
·Riverside and Kilimani posted the highest Annual returns of 14.8% and 12.6% driven by an increase in asking prices of 8.8% for both markets. This is as both sub-markets continue to experience demand for serviced and furnished apartments. Westlands posted a decline in asking prices during the quarter owing to increased commercialization of the area. |
|||||||||
|
Source: Cytonn Research 2019 |
|||||||||
- Lower Mid-End Suburbs
Lower mid-end suburbs registered the highest average annual uptake at 26.0% and occupancy rates of 84.1% with suburbs such as Donholm/Komarock registering 96.7% occupancy rates, a result of Nairobi’s growing urbanization and emerging middle-income class.
|
(All Values in Kshs Unless Stated Otherwise) |
||||||||
|
Apartments: Top 5 Lower Mid-End Suburbs Markets Performance Q1’2019 |
||||||||
|
Location |
Average Price Per SQM Q1'2019 |
Average Rent Per SQM Q1'2019 |
Average Annual Uptake Q1'2019 |
Average Occupancy 2019 |
Average Rental Yield Q1'2019 |
Q/Q Price Change |
Annual Price Appreciation |
2018/2019 Total Returns |
|
Kahawa West |
85,523 |
426.3 |
18.5% |
71.4% |
5.0% |
1.0% |
9.2% |
14.2% |
|
Donholm & Komarock |
84,095 |
406.6 |
20.7% |
96.7% |
5.7% |
0.5% |
5.7% |
11.3% |
|
Waiyaki Way |
86,783 |
409.9 |
26.8% |
86.2% |
4.9% |
0.1% |
2.9% |
7.8% |
|
South C |
103,199 |
617.4 |
29.2% |
82.8% |
5.9% |
0.8% |
1.4% |
7.4% |
|
Lang’ata |
110,706 |
524.6 |
27.5% |
83.5% |
4.9% |
(0.2%) |
(5.1%) |
(0.2%) |
|
Average |
96,196 |
490 |
26.0% |
87.3% |
5.4% |
0.3% |
1.2% |
6.6% |
|
·Kahawa West recorded the highest average returns at 14.2%, in comparison to the lower mid-end market average of 6.6%, owing to new developments’ increasing asking prices. Langata recorded a price depreciation as its average asking prices reach a ceiling as well as competition from surrounding markets such as South C. |
||||||||
|
Source: Cytonn Research 2019 |
||||||||
- Satellite Towns
Thindigua registered the highest annual returns amongst Satellite Towns, owing to an annual price appreciation of 4.1% driven by demand from young population working in the CBD as well as expats working in surrounding international organizations. However, Thindigua and Kikuyu also posted quarterly price depreciation of 0.7% resulting from price discounts offered by developers during the season in a bid to attract clientele amidst increasing market competition.
|
(All Values in Kshs Unless Stated Otherwise) |
||||||||
|
Apartments: Top 5 Satellite Towns Performance Q1’2019 |
||||||||
|
Location |
Average Price Per SQM Q1'2019 |
Average Rent Per SQM Q1'2019 |
Average Annual Uptake Q1'2019 |
Average Occupancy 2019 |
Average Rental Yield Q1'2019 |
Q/Q Price Change |
Annual Price Appreciation |
2018/2019 Total Returns |
|
Thindigua |
99,119 |
456.9 |
20.9% |
97.9% |
5.6% |
(0.7%) |
4.1% |
9.7% |
|
Athi River |
66,156 |
356.4 |
17.6% |
84.8% |
5.0% |
1.7% |
1.7% |
6.7% |
|
Ruaka |
104,997 |
430.1 |
27.2% |
80.3% |
4.3% |
0.4% |
2.1% |
6.4% |
|
Ruiru |
91,629 |
439.2 |
17.9% |
62.3% |
3.3% |
1.0% |
1.0% |
4.3% |
|
Kikuyu |
79,112 |
369.8 |
21.8% |
85.4% |
5.1% |
(0.7%) |
2.1% |
7.3% |
|
Average |
88,203 |
410 |
21.1% |
82.1% |
4.6% |
0.4% |
2.2% |
6.9% |
|
·Thindigua had the highest Annual returns amongst Satellite Towns, owing to an Annual price appreciation of 4.1% driven by demand from young population working in the CBD. However, Thindigua and Kikuyu posted price depreciation of 0.7% each as a result of price discounts offered by developers during the season in a bid to attract clientele amidst increasing competition, ·Athi River posted the highest price appreciation among the Satellite Town with 1.7% q/q, in comparison to the Satellite Towns market average of 0.4%, owing to increased demand from investors and home buyers. This is as Athi River currently hosts majority of affordable investment grade projects thus attracting both investors and actual home buyers. |
||||||||
|
Source: Cytonn Research 2019 |
||||||||
We expect the residential market to continue recording modest performance due to factors such as finance which continues to be elusive for home buyers, and developers as well. However, we expect the lower mid-end markets to continue experiencing increased demand and uptake as home buyers seek affordability.
- Commercial Sector
- Office
In Q1’2019, the commercial office sector recorded a marginal decline in performance recording 0.1% and 0.9% points decline in average rental yields and occupancy rates, to 8.0% and 82.4% in Q1’2019, from 8.1% and 83.3%, respectively, in FY’2018. The negative performance was largely driven by a reduction in asking rents by property managers to attract tenants as a result of a surplus of office space that stood at 5.2 mn SQFT as at 2018 giving tenants a higher bargaining power. Asking rents decreased by 1.7% to an average of Kshs 100 per SQFT from Kshs 102 per SQFT in 2018, while asking prices remained stable at Kshs 12,574 per SQFT.
The table below highlights the performance of the commercial office sector in Nairobi over time:
|
(All values in Kshs unless stated otherwise) |
||||||||
|
Summary of Commercial Office Returns in Nairobi - Q1’2019 |
||||||||
|
Year |
Q1'2018 |
H1'2018 |
Q3'2018 |
Q4'2018 |
Q1’2019 |
∆ Y/Y |
∆ Q1'2019 |
|
|
Occupancy (%) |
80.5% |
84.6% |
87.3% |
83.3% |
82.4% |
1.9% points |
(0.9%) points |
|
|
Asking Rents (Kshs/SQFT) |
98 |
102 |
102 |
102 |
100 |
2.29% |
(1.7%) |
|
|
Average Prices (Kshs/SQFT) |
12,718 |
12,527 |
12,202 |
12,573 |
12,574 |
(1.14%) |
0.0% |
|
|
Average Rental Yields (%) |
9.2% |
9.3% |
9.5% |
8.1% |
8.0% |
(1.2%) points |
(0.1%) points |
|
|
·Occupancy rates declined by 0.9% points to 82.4% in Q1’2019 from 83.3% in FY’2018 attributed to the surplus of 5.2 mn SQFT office space as at 2018 |
||||||||
|
·Rental rates dropped by 1.7% to Kshs 100/SQFT/Month from Kshs 102/SQFT/Month in FY’2018 as developers reduce rents in order to remain competitive and attract tenants |
||||||||
Source: Cytonn Research 2019
In terms of Nairobi submarket analysis, Gigiri, Westlands and Parklands were the best performers in Q1’2019 recording rental yields of 9.6%, 9.1%, and 9.1%, respectively, as a result of their superior locations hosting multinational companies and offering quality Grade A offices, enabling them to charge a premium on rentals.
Areas affected by traffic snarl ups, low quality office space and are not necessarily primary business nodes such as Mombasa Road and Thika Road had the lowest returns with average rental yields of 5.8% and 6.2%, respectively.
Nairobi CBD’s performance improved as rental yields rose by 0.6% points, to 8.2% in Q1’2019 from 7.6% in FY’2018 driven by 1.4% and 5.3% points increase in rental rates and occupancy rates respectively attributed to the node’s attractiveness to Small and Medium Enterprises (SMEs) as a result of its affordable rental rates and large customer base present in the Central Business District.
|
(All values in Kshs unless stated otherwise) |
|||||||||||
|
Nairobi Commercial Office Submarket Performance - Q1'2019 |
|||||||||||
|
Location |
Price Kshs/ SQFT Q1'2019 |
Rent Kshs/SQFT Q1'2019 |
Occupancy Q1'2019(%) |
Rental Yield (%) Q1'2019 |
Price Kshs/ SQFT FY 2018 |
Rent Kshs/SQFT FY 2018 |
Occupancy FY 2018(%) |
Rental Yield (%) FY 2018 |
Q1'2019 ∆ in Rent |
Q1'2019 ∆ in Occupancy (% points) |
Q1'2019 ∆ in Rental Yields (% points) |
|
Gigiri |
13,833 |
126.3 |
80.8% |
9.6% |
13,833 |
141.0 |
88.3% |
10.5% |
(10.5%) |
(7.6%) |
(0.9%) |
|
Westlands |
12,334 |
110.0 |
83.3% |
9.1% |
12,050 |
109.7 |
82.1% |
9.0% |
0.3% |
1.2% |
0.1% |
|
Parklands |
12,369 |
103.1 |
90.6% |
9.1% |
12,494 |
102.1 |
86.0% |
8.4% |
1.0% |
4.6% |
0.8% |
|
Karen |
13,666 |
113.7 |
90.5% |
9.0% |
13,666 |
118.3 |
88.6% |
9.2% |
(3.9%) |
1.9% |
(0.2%) |
|
Nairobi CBD |
12,425 |
90.0 |
93.6% |
8.2% |
12,425 |
88.8 |
88.3% |
7.6% |
1.4% |
5.3% |
0.6% |
|
UpperHill |
12,593 |
100.9 |
83.5% |
7.9% |
12,560 |
99.8 |
84.0% |
8.2% |
1.1% |
(0.5%) |
(0.3%) |
|
Kilimani |
12,734 |
92.3 |
80.9% |
7.2% |
13,525 |
98.9 |
88.3% |
8.0% |
(6.7%) |
(7.4%) |
(0.8%) |
|
Thika Road |
12,517 |
86.7 |
74.6% |
6.2% |
12,517 |
86.3 |
81.5% |
6.7% |
0.4% |
(6.8%) |
(0.5%) |
|
Msa Road |
11,400 |
79.7 |
64.1% |
5.8% |
11,400 |
78.8 |
65.6% |
5.8% |
1.2% |
(1.5%) |
0.0% |
|
Average |
12,574 |
100.3 |
82.4% |
8.0% |
12,573 |
102.2 |
83.8% |
8.1% |
(1.7%) |
(1.4%) |
(0.1%) |
|
*Gigiri area covers Gigiri and Limuru Road |
|||||||||||
|
·Nairobi Metropolitan area recorded a 0.1% point q/q decrease in rental yields to 8.0% in Q1'2019 from 8.1% in 2018, attributable to reduced rental rates driven by a 1.4% decrease in office occupancy rates |
|||||||||||
|
. Gigiri, Westlands and Parklands were the best performing offices sub markets recording average rental yields of 9.6%, 9.1%, and 9.1%, respectively and occupancy rates of 80.8%, 83.3% and 90.6%, respectively. The high returns are as a result of high-quality office spaces in these areas and their prime locations enabling developers to charge prime rents ·Performance in Gigiri declined by 0.9% points to 9.6% in Q1’2019 from 10.5% in FY’2018 as a result of expanded coverage of the node to include Limuru Road which included new buildings charging less rent and having low occupancy rates ·Thika Road and Mombasa Road were the worst performing markets due to poor quality offices and also affected by high traffic snarl ups that have made them generally unattractive to firms |
|||||||||||
Source: Cytonn Research 2019
The main highlights in the commercial office sector during Q1’2019 include; (i) the opening of Park Medical Centre in 3rd Parklands Avenue in Parklands, and (ii) FMCG technology solutions company, MAC Mobile, and Mauritius Commercial Bank (MCB) Group announced their plans for opening offices in Nairobi in 2019.
We retain a negative outlook on the performance of the commercial office sector attributable to an oversupply of 5.2mn SQFT of office space thereby reducing occupancy rates translating to a decline in rental yields. Investments opportunities in the sector are in differentiated concepts such as serviced offices that attract yields of 13.4% such as Westlands, as well as areas with low supply of office space such as Gigiri
- Retail
The retail sector’s performance softened recording 0.5% points decline in rental yield to 8.5% in Q1’ 2019 from 9.0% in FY’ 2018. This is attributed to an increase in supply which saw average occupancies drop by 3.0% points from 79.8% in FY’2018 to 76.8% in Q1’ 2019 and average rents declined by 3.9% to Kshs 174.3/ SQFT/month from Kshs 178.2/ SQFT/month in 2018 as property managers/owners reduced rental charges to attract tenants.
The performance of the retail sector in Nairobi over time is as shown below;
|
(All values in Kshs unless stated otherwise) |
|||||||
|
Summary of Retail Sector Performance - Q1’2019 |
|||||||
|
Item |
Q1' 2018 |
H1' 2018 |
Q3' 2018 |
FY' 2018 |
Q1' 2019 |
∆ Y/Y |
∆ Q1’2019 |
|
Average Asking Rents (Kshs/SQFT) |
188.0 |
190.4 |
178.2 |
178.2 |
174.3 |
(7.3%) |
(2.2%) |
|
Average Occupancy (%) |
80.1% |
82.7% |
83.7% |
79.8% |
76.8% |
(3.3%) points |
(3.0%) points |
|
Average Rental Yields |
9.4% |
9.7% |
9.4% |
9.0% |
8.5% |
(0.9%) points |
(0.5%) points |
|
·The retail sector’s performance softened, recording an average rental yield of 8.5%, a 0.5%-point decline from FY’ 2018. Occupancy rates as well declined by 3.0% points, while the rental charges decreased by 2.2% over the quarter. ·The decline in performance is attributable to surplus mall space supply in Nairobi, currently at 2.0mn SQFT, with the opening of malls such as Waterfront, The Well and Coholo |
|||||||
Source: Cytonn Research 2019
In terms of submarket analysis in Nairobi, Westlands and Kilimani were the best performing retail nodes with average rental yields of 11.5% and 10.7%, respectively, as the areas are affluent neighborhoods hosting middle – high-end income earners with high consumer purchasing power and thus tenants are willing to pay higher rents for retail space in the area. Mombasa Road and Satellite Towns were the worst performing nodes recording rental yields of 6.8% and 6.3%, respectively. The poor performance is attributable to low rental charges as a result of traffic congestion along Mombasa road and competition from informal retail space in Satellite Towns.
Karen, Mombasa Road, and Thika Road nodes recorded the largest declines in rental yield q/q, of 1.7%, 1.1%, and 1.0% points, respectively. The decline in performance is attributable to a 15.2%, 6.4%, and 4.2% points decline in occupancy rates for Karen, Mombasa Road, and Thika Road, respectively due to increasing retail space with the opening of malls such as Waterfront and The Well in Karen and Coholo in Mlolongo.
|
(All values in Kshs unless stated otherwise) |
||||||||||
|
Summary of Nairobi’s Retail Market Performance – Q1’2019 |
||||||||||
|
Location |
Rent Ksh/SQFT Q1’ 2019 |
Occupancy Q1’ 2019 |
Rental Yield Q1’ 2019 |
Rent Ksh/SQFT 2018 |
Occupancy 2018 |
Rental Yield 2018 |
Q1'2019 ∆ in Rent |
Q1'2019 ∆ in Occupancy (% points) |
Q1'2019 ∆ in Rental Yields (% points) |
|
|
Westlands |
218 |
85.0% |
11.5% |
219 |
82.2% |
12.2% |
0.4% |
2.8% |
(0.7%) |
|
|
Kilimani |
173 |
90.8% |
10.4% |
167 |
97.0% |
10.7% |
(3.4%) |
(6.2%) |
-0.3% |
|
|
Ngong Road |
173 |
90.0% |
9.8% |
175 |
88.8% |
9.7% |
1.6% |
1.2% |
0.1% |
|
|
Karen |
225 |
73.6% |
9.3% |
225 |
88.8% |
11.0% |
0.1% |
(15.2%) |
(1.7%) |
|
|
Eastlands |
154 |
72.7% |
7.7% |
153 |
64.8% |
6.8% |
0.4% |
7.9% |
0.9% |
|
|
Kiambu Road |
169 |
69.8% |
7.5% |
183 |
69.5% |
8.1% |
8.3% |
0.3% |
(0.6%) |
|
|
Thika road |
168 |
70.8% |
7.3% |
177 |
75.0% |
8.3% |
5.3% |
(4.2%) |
(1.0%) |
|
|
Mombasa Road |
153 |
66.0% |
6.8% |
159 |
72.4% |
7.9% |
3.6% |
(6.4%) |
(1.1%) |
|
|
Satellite Towns |
135 |
72.2% |
6.3% |
142 |
73.7% |
6.7% |
4.9% |
(1.5%) |
(0.4%) |
|
|
Average |
174 |
76.8% |
8.5% |
178 |
79.8% |
9.0% |
2.1% |
(3.0%) |
(0.5)% |
|
|
· Performance softened, with yields declining by 0.5% points q/q as a result of an oversupply of retail space, currently at 2.0mn SQFT leading to a 2.4% points q/q decline in occupancy levels and a 2.1 % q/q decline in rental charges in Q1’ 2019, ·Westlands and Kilimani were the best performing submarkets, with a yield of 11.5% and 10.7% respectively, driven by relatively higher rental rates as they are affluent neighbourhoods hosting middle – high end income earners with high consumer purchasing power and thus investors are willing to pay higher rents for retail space in the area ·Karen recorded the highest change in rental yield, a reduction of 1.7% points, attributed to a 15.2% point decrease in average occupancy from 88.8% in FY’ 2018 to as a result of an increase in retail space supply in the area with the opening of Waterfront and The Well malls |
||||||||||
Source: Cytonn Research 2019
The main highlights in the retail sector in Q1 2019 include;
- South Africa retailer, Shoprite, opened a second shop in Kenya at the Garden City Mall, along the Thika Superhighway, Nairobi, taking up a space of 40,000 SQFT, previously occupied by Nakumatt Holdings,
- Quickmart Supermarket opened its first 24-hour outlet at Lavington’s Valley Arcade, bringing its total branches in the country to 10,
- Swiss-owned shoemaker, Bata Shoe Company, opened its latest outlet at The Hub Mall, in Karen, and,
- Fast food Chain, Grill Shack, opened its first restaurant in Africa at the Westgate Mall in Westlands.
We retain a neutral outlook for the retail sector, with the continued entry of international retailers and expansion of local retailers expected to cushion the retail real estate sector’s performance through increased occupancy rates. The opportunity is in county headquarters in some markets such as Mombasa and Mt. Kenya regions that have retail space demand of 0.3mn and 0.2mn SQFT, attractive yields at 8.3% and 9.9% and occupancy rates at 96.3% and 84.5%, respectively.
- Hospitality Sector
In the hospitality sector, Kenya National Bureau of Statistics (KNBS) released their December 2018 issue of Leading Economic Indicators 2018, highlighting a 13.0% growth in the number of tourist arrivals at the Jomo Kenyatta International Airport (JKIA) and the Moi International Airport Mombasa from 0.86 mn during the period between January and November 2017 to 0.97mn during the same period in 2018. In our view, this was driven by the improved security and political stability, which have continued to boost tourists’ confidence in the country thus making it a preferred travel destination for both business and holiday travelers. As per Cytonn Market Outlook 2019, we expect the number of arrivals to increase to 1.5 mn during the same period in 2019, supported by factors mentioned above in addition to the improving air transport operations. We, however, note that the sector experienced a setback earlier in the year following the Riverside-based Dusit Hotel terrorist attack, that saw the United Kingdom and United States (US) state department caution its nationals to be vigilant in Nairobi, resulting in fewer arrivals during that period. However, with improved security measures in the country, we expect continued demand for hospitality services, with serviced apartments expected to record relatively high occupancies of above 80.0% in 2019, according to our Cytonn 2019 Markets Outlook, and hotels at approximately 55% according to JLL’s Nairobi City Report 2019.
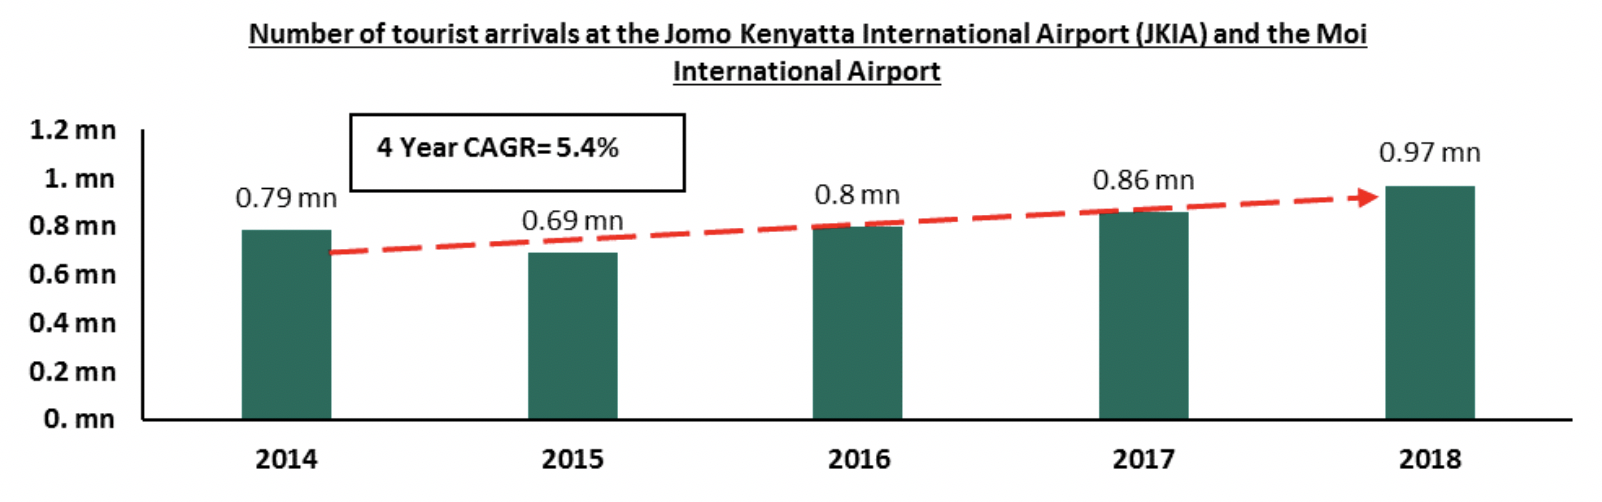
Source: Kenya National Bureau of Statistics
Other highlights during the quarter;
- Local airlines, Kenya Airways and Silverstone Air, announced plans to introduce daily direct flights from Nairobi to Seychelles, and from Nairobi to Lodwar, respectively. In our view, the improving air transport operations, political stability and continued marketing of Kenya as an experience destination, will result in increased tourist arrivals. For more information, please see our Cytonn Weekly #03/2019,
- Hospitality chain, Superior Hotels Limited, opened its third hotel in Naivasha town in January 2019, in an expansion move that has seen its portfolio grow to 6 hotels among them, Sweet Lake Resort and Masada Hotel in Naivasha, Pearl Palace and Hadassa in Nairobi and West Wood Hotel in Westlands Nairobi. The resort, which is located along Naivasha Moi South Road, brings to the market 96 rooms organized in cottages, 16 conference rooms, a business center and an amphitheater with a capacity of 1,200 people. In our view, the hotel will be a destination for meetings, incentives, conferencing and exhibitions tourism, as Naivasha town is preferred by corporates and government institutions for out-of-office meetings,
- Concord Hotels, a local hotel group, is set to open Shelly Beach Hotel in Mombasa after a US 10.0 mn makeover. The hotel chain also owns Concord and Cloud Hotel in Nairobi and Bahari Dhow in Diani and bought Shelly Beach in 2000. The phase 1 of the refurbishment will include restaurants, swimming pools, bar and 36 rooms and is set for completion by the end of 2019. In our view, the refurbishment will result in the improvement of hospitality services and thus the give the hotel competitive advantage in the wake of competition from other international brands such as the Hilton Hotel and Radisson Hotel Group,
- Tourism Cabinet Secretary Hon. Najib Balala announced plans to rehabilitate Kisumu’s Sunset Hotel into a conference center. The center, set to be complete by 2021, will have a 10,000 pax-capacity with an estimated cost of Kshs 300.0 mn. In our view, the move will buck the growth of both local and international conferencing with demand being driven by national and county government officials, corporates, political parties and international delegates looking to hold meetings in the county. According to KNBS Economic Survey 2018, local conferences and delegates in Kenya increased by 2.4% and 17.1%, respectively, in 2017, partly because of numerous political strategy meetings held, creating demand for conference centers especially away from Nairobi CBD. For more information, please see our Cytonn Weekly #08/2019.
We expect the hospitality sector to record improved performance in 2019, supported by; i) the improving air transport operations, ii) continued marketing of Kenya as an experience destination, iii) improved security, and iv) political stability, which have continued to boost tourists’ confidence in the country and thus making it a preferred travel destination for both business and holiday travelers.
- Land
During Q1’2019, the land sector recorded an overall annualized capital appreciation of 0.5%, with site and service schemes in areas such as Thika and Ruai recording the highest annualized capital appreciation at 2.2%, attributable to the growing demand for site and service schemes as they are relatively affordable at an asking price of approximately Kshs 14.4 mn per acre compared to urban areas with relatively high asking prices of up to Kshs 488.3 mn per acre and also due to the provision of infrastructure by developers.
The table below shows the performance of the sector during the quarter:
|
|
|||
|
(All values in Kshs unless stated otherwise) |
|||
|
Summary of Nairobi Metropolitan Area Performance Across the Nodes |
|||
|
NODES |
FY'2018 |
Q1'2019 |
Annualized Capital Appreciation |
|
Site and Service Schemes |
14,319,805 |
14,392,364 |
2.2% |
|
Satellite Towns |
22,663,698 |
22,862,719 |
2.1% |
|
Low Rise Residential Areas |
86,339,124 |
86,722,858 |
1.8% |
|
High Rise Residential Areas |
134,984,148 |
135,400,750 |
(0.1%) |
|
Commercial Zones |
492,634,539 |
488,260,628 |
(3.5%) |
|
Average |
|
|
0.5% |
Source: Cytonn Research 2019
Serviced land in satellite towns recorded a 2.2% annualized capital appreciation, 1.7% points higher than the market average of 0.5%, and 0.1% points higher than unserviced land in the same location. The appreciation is attributed to increased demand due to relatively affordable land at approximately Kshs 14.4 mn asking price per acre and provision of infrastructure by the developers,
Unserviced land in satellite towns recorded a relatively high annualized capital appreciation at 2.1% compared to the market average of 0.5%. This is attributed to; i) high demand due to affordability in comparison to Nairobi’s suburbs, and ii) improving infrastructure such as roads and sewerage systems. The best performing sub-markets were Athi River and Limuru, recording a capital appreciation of 6.3% and 6.2%, respectively, with the average price per acre coming in at Kshs 3.8 mn and Kshs 17.4 mn, respectively,
Low-rise residential areas such as Karen and Runda recorded an average capital appreciation of 1.8%. Karen was the best performing submarket with a capital appreciation of 5.0%, and an average asking price of Kshs 56.5 mn. We attribute the relatively high appreciation of land in low rise residential areas compared to high-rise areas which recorded a 0.1% decline, to the continued demand for housing, as they are relatively sparsely populated, are deemed favorable for families mainly as they enhance privacy, and are relatively affordable at an average asking land price of Kshs 86.7 mn, compared to high-rise areas at Kshs 135.4 mn per acre on average,
On overall, asking land prices in high-rise residential areas recorded a 0.1% correction, attributed to the relatively high land prices at approximately Kshs 135.4 mn per acre, thus developers are not able to achieve a favorable return on investment from developments in those submarkets, and therefore decreased demand for development land,
Commercial zones such as Kilimani and Upperhill recorded a 3.5% correction in asking prices, with Kilimani recording 0.8% points decline and thus an average land price of Kshs 386.6 mn per acre. We attribute the decline in asking land prices to the decreased demand for development land in the submarkets given the relatively high asking land prices of Kshs 488.3 mn per acre on average thus developers are not able to achieve favorable returns from the investments.
The opportunity in the sector lies in markets such as Karen and Kileleshwa which recorded a relatively high annualized capital appreciation of 5.0% and 3.0%, respectively, and satellite town such as Athi River and Limuru for Unserviced land and Thika and Ruai for site and service schemes which were the best performing with an average annualized capital appreciation of 6.3%, 6.2%, 6.9% and 6.6%, respectively.
Other highlights during the quarter:
The Ministry of Lands in 2018 announced plans to digitize the processes in the ministry, in order to speed up the same, thus enhancing time saving, cost reduction and transparency in the registration of land and thus encourage property development. In line with the same;
In March 2019, the Government of Kenya announced plans to incorporate blockchain technology into the land’s digitization process in a bid to end human interference in the Lands Ministry. Blockchain technology refers to a decentralized public ledger that records transactions across many different computers across the internet with no central point. This makes it hard for any one individual to interfere with the data. This will help to track all land transactions in the country, leading to an efficient, transparent and fair system in a country where issues of land fraud have been rampant,
The Ministry of Lands announced that the Lands Information Management System (LIMS) is expected to go live on 1st April 2019. The system is expected to shorten the lands registration process by 61-days, to 12-days, from 73-days required by the manual system and this is likely to enhance time saving, cost reduction and transparency in the registration of land and thus encourage property development. For more details on this see Cytonn Weekly 11/2019 .
We expect the land sector to record improved performance going forward, fueled by; (i) the continued demand for development land especially in satellite towns where it is more affordable and available in bulk, (ii) improving infrastructure such as the road network and sewer connections, and iii) the digitalization of the Ministry of Lands which will enhance development of property and thus increased demand for the same.
- Infrastructure
In Q1’ 2019, we noted the following activities in the infrastructure sector;
- The Kenya National Highways Authority (KeNHA) announced the start of the construction of the Western Bypass starting from Gitaru linking to Southern Bypass and terminating at Ruaka, in Kiambu County. This road will include 17.4 km of service lanes, seven interchanges at the major junctions of Wangige, Kihara, Ndenderu, Ruminyi, Kabete, Banana and Ruaka, five underpasses and three-foot bridges. The project is financed by the Exim Bank of China and is being undertaken by the China Road and Bridge Corporation, at a cost of Kshs 17 bn,
- China Road and Bridge Corporation (CRBC), a Chinese engineering and construction firm, is set to secure a Kshs 2.5 bn contract to refurbish the Nairobi commuter railway network. For more information, please see Cytonn Weekly #11_2019.
The planned improvement and construction of new roads and railway system will lead to better accessibility and reduce traffic congestion that is usually rampant during peak hours. Consequently, we expect this to result in increased demand for property in satellite towns with increased provision of infrastructure.
- Listed Real Estate
Stanlib Fahari I-REIT released their FY’2018 earnings, registering a 13.1% growth in earnings to Kshs 1.07 per unit from Kshs 0.95 per unit in FY’2017, attributable to a 10.9% growth in rental income to Kshs 309.8 mn from Kshs 279.4 mn in FY’2017 as a result of the rental income contribution from the Grade A office - 67 Gitanga Place that was acquired in May 2018, and a 40.2% increase in fair value gains on revaluation of investment property bolstered by the construction of a modern 3-screen Cinema at one its properties, the Greenspan Mall. Notable, net profit in 2018 grew by 13.1% to Kshs 193.5 mn, from Kshs 171.1 mn in FY’2017. The REIT manager recommended a Kshs 135.7 mn dividend to its unitholders at Kshs 0.75 per unit, realizing an 8.1% yield on its market price as at 29th March 2019, translating to a 70.1% pay-out ratio. The REIT recorded 1.6% points increase in dividend yield to 8.1% in 2018 from 6.5 % in 2017. The I-REIT’s performance in terms of dividend yield at 8.1% is in line with the commercial real estate market average of 8.3%, with 8.5% rental yield for retail space and 8.0% yield for office space. However, the high yield is attributable to its declining stock price closing at Kshs 9.2 per unit as at 29th March 2019 in comparison to Kshs 11.6 as at 29th March 2018, representing a 20.3% loss of value. The graph below highlights the performance of REIT compared to commercial real estate brick and mortar;
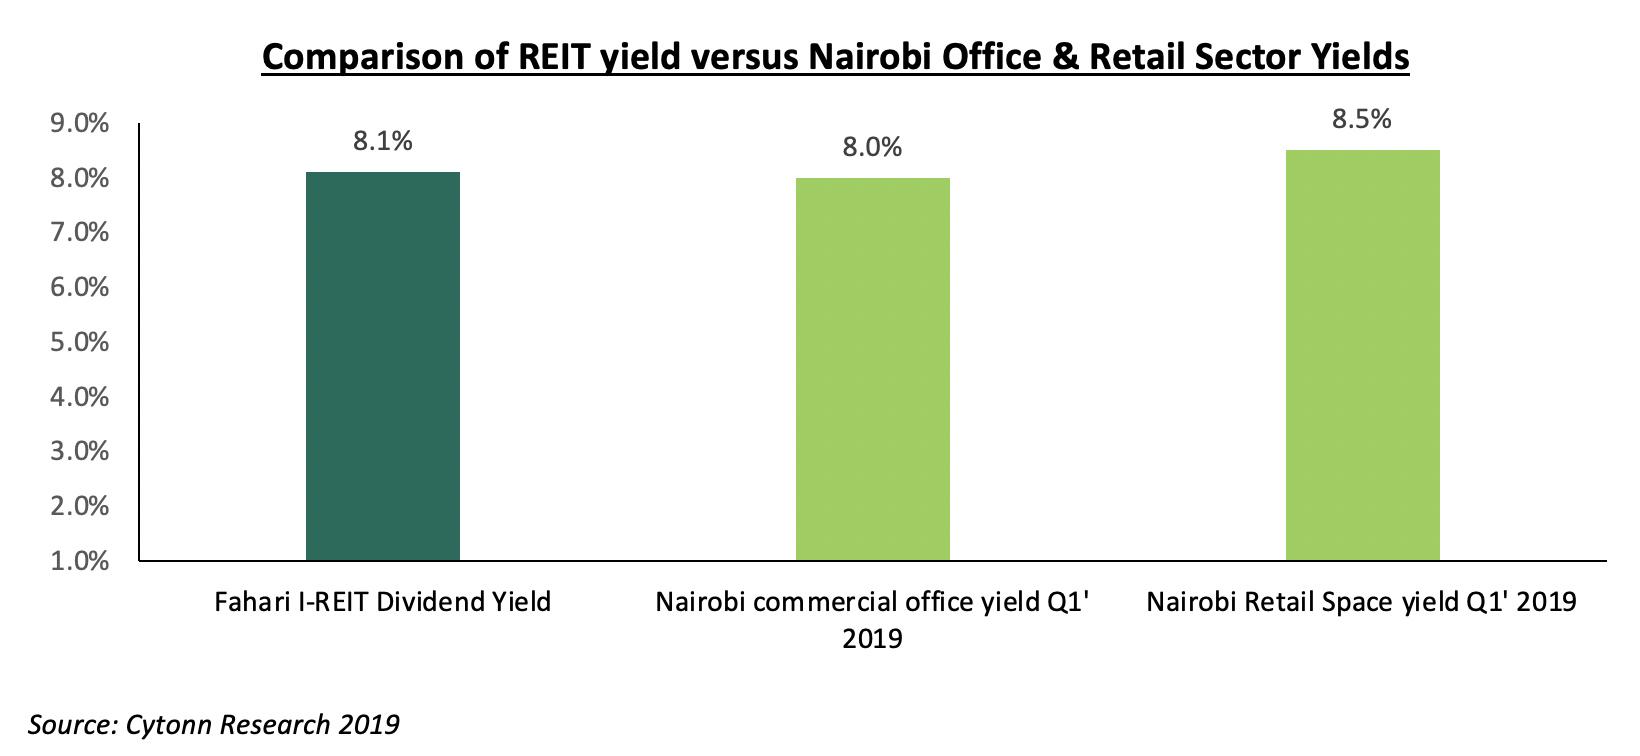
For a more comprehensive analysis on the REIT FY’2018 performance, see our Stanlib Fahari I-REIT Earnings Note - 2019.
During Q1’2019, the Stanlib’s Fahari I-REIT share price declined by 14.8% closing at Kshs 9.2 per share, from Kshs 10.8 per share at the beginning of the year. The REIT traded at an average unit price of Kshs 9.8 in Q1’2019, 51.0% lower than its listing price of Kshs 20.0 in November 2015. In addition, Fahari I-REIT is trading at 55.1% discount to its net asset value of Kshs 20.6 as per FY’2018 reporting and we attribute this to the negative market sentiments around REITs performance.
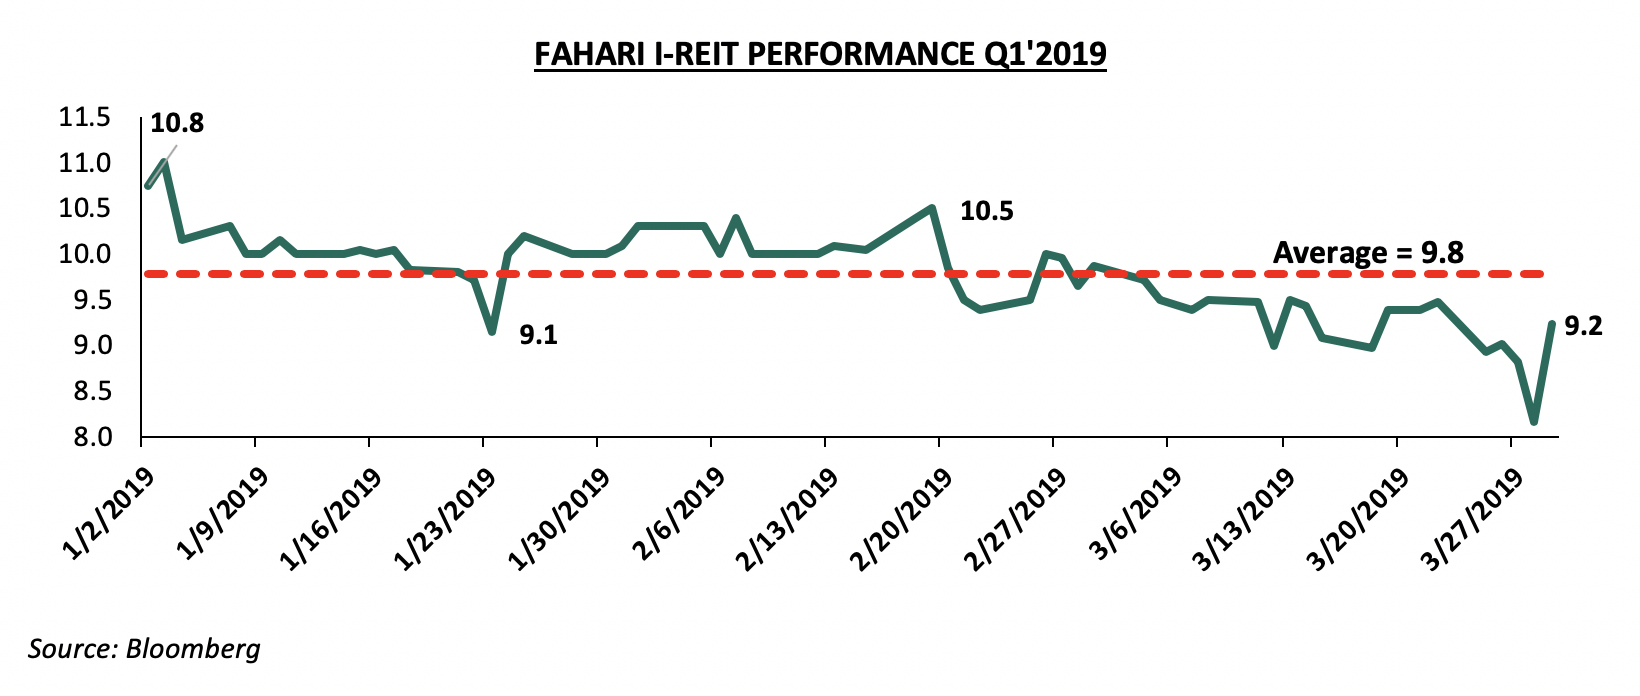
Our outlook for Stanlib’s listed real estate is negative as the performance is constrained by the continued lack of investor appetite for the instrument.
We retain a neutral outlook for the real estate sector mainly constrained by increased supply in the market and limited access to financing for both developers and off takers. The real estate sector however has pockets of value in themes such as housing for lower-middle to low-income earners in the residential sector, differentiated concepts such as serviced offices that attract yields of 13.4% such as Westlands, as well as areas with low supply of office space such as Gigiri and county headquarters driven by positive demographics, devolution and sustained infrastructural development.
Disclaimer: The views expressed in this publication are those of the writers where particulars are not warranted. This publication, which is in compliance with Section 2 of the Capital Markets Authority Act Cap 485A, is meant for general information only and is not a warranty, representation, advice or solicitation of any nature. Readers are advised in all circumstances to seek the advice of a registered investment advisor.

- Talk to us
- Kenya
- P.O Box 20695 - 00200, Nairobi, Kenya
- Cell +254709101200
- Tel +254709101200
- WhatsApp +254741676635
- United States
- +254709101200
- DOWNLOAD OUR APP
-


- Kenya
- 8th Floor, Pinetree Plaza, Kaburu Drive, Ngong Road, Nairobi, Kenya
- USA
- Suite 1150, 1775 Eye Street NW, USA, Washington DC 20006, USA
- Investments
- High Yield
- Private Equity
- Real Estate
- Real Estate
- RiverRun Estates
- Cytonn Towers
- The Ridge
- Taraji Heights
- The Alma