Nyeri Real Estate Investment Opportunity, & Cytonn Weekly #03/2018
By Cytonn Research Team, Jan 21, 2018
Executive Summary
Fixed Income
Treasury bills were undersubscribed during the week, with the overall subscription rate coming in at 79.9%, compared to 124.4% recorded the previous week. The yield on the 91-day paper remained unchanged at 8.0% while yields on the 182 and 364-day papers declined to 10.6% and 11.1%, from 10.7%, and 11.2%, respectively, the previous week. The Monetary Policy Committee (MPC) is set to meet on Monday, 22nd January 2018, to review the prevailing macroeconomic conditions and give direction on the Central Bank Rate (CBR); we expect the MPC to maintain the CBR at 10.0% as per our MPC Note;
Equities
During the week, the equities market was on an upward trend, with NSE 25, NASI and NSE 20 gaining 2.6%, 2.3% and 0.8%, respectively, taking their YTD performance to 5.2%, 5.1% and 0.7% for NASI, NSE 25 and NSE 20, respectively. The Capital Markets Authority (CMA) gave Nairobi Stock Exchange (NSE) the approval to launch short selling and supporting securities lending facility, that allows for securities lending, borrowing and short-selling, that will be functional as from the second quarter of 2018;
Private Equity
Atlas Mara Limited, a financial services holding company, formed to undertake the acquisition of target banks in Africa, has increased its strategic stake in Union Bank Nigeria through a Naira 27.0 bn (USD 75.0 mn) investment in UBN’s right issue. Atlas Mara’s acquisition was carried out at a 0.3x Price-to-Tangible-Book valuation, which is about 84.2% discount to the average P/TBv multiple of 1.9x for select listed Banks in Nigeria, hence a relatively cheaper transaction valuation;
Real Estate
Increased development activities expected in residential real estate sector following announcement by the government of Public-Private Partnerships (PPP’s), which are expected to deliver 1 mn housing units in the next five years;
Focus of the Week
Following our branch opening in Nyeri, this week we look at our real estate findings in the commercial, residential, hospitality, and site and service schemes markets in Nyeri Town. We start by a general overview of the area, and then cover the key drivers and challenges facing the real estate market in Nyeri, followed by an analysis of the performance of the various themes and finally a conclusion on our outlook on the market.
- Our Research Analyst, Nancy Murule discussed acquiring and owning property in Kenya. Watch Nancy on Ebru TV here
- Our Investments Analyst, Reuben Mabishi discussed Kenya’s economic growth in 2018 and Cytonn’s Investment in NIC Group. Watch Reuben on CNBC here
- On Wednesday, 17th January 2018, Cytonn Foundation, the corporate social investment arm of Cytonn Investments Management Plc that focuses on giving back to the society through skill development, held a private Wealth Management Training (WMT) at the Dedan Kimathi University of Technology (DEKUT) located in Nyeri County, as part of the Foundation’s financial literacy pillar. During the training, the University staff were taken through a financial planning session with a focus on 4 key pillars; Budgeting, Debt Management, Savings, and Investments in the various asset classes. See the Event Note here. If interested in our Private Wealth Management Training for your employees or investment group please get in touch with us through clientservices@cytonn.comor book through this link Wealth Management Training. To view the Wealth Management Training topics, click here
- On Friday, 19th January 2018, we also held a private Wealth Management Training (WMT) at Machakos University. See the Event Note here
- We continue to showcase our real estate developments through weekly site visits. Watch progress videos and pictures of The Alma, Amara Ridge, The Ridge, and Taraji Heights. The site visits target both investors looking to invest in real estate directly and those interested in high yield investment products to familiarize themselves with how we support our high yields. Key to note is that our cost of capital is priced off the loan markets, where all-in pricing ranges from 16.0% to 20.0% and our yield on real estate developments ranges from 23.0% to 25.0%, hence our top-line gross spread is about 6.0%. If interested in attending the site visits, kindly register here
- For recent news about the company, see our news section here
- We have 10 investment-ready projects, offering attractive development and buyer targeted returns of around 23.0% to 25.0% p.a. See further details here: Summary of Investment-Ready Projects
- To invest in any of our current or upcoming real estate projects, please visit Cytonn Real Estate
- Cytonn Towers, where we are only selling residential units in the first phase of residential apartments, is currently about 20.0% sold. See Cytonn Towers
- The Alma, which is 55.0% sold. See The Alma
- Amara Ridge has currently 100.0% uptake. See Amara Ridge
- Situ Village is currently 22.0% sold. See Situ Village
- The Ridge (Phase 1) is currently 31.0% sold. See The Ridge
- Taraji Heights is currently 14.0% sold. See Taraji Heights
- RiverRun Estates (Phase 1) is currently 11.0% sold. See RiverRun Estates
- With over 10 investment ready projects worth over Kshs 82.0 billon of project value, we shall be very selective on new real estate projects going forward, only focusing on Joint Ventures and real estate opportunities with deep value. We are increasingly focused on private equity deals. Should you have any deals in banking, insurance, education, hospitality and technology sectors, kindly email a teaser to PE@cytonn.com.
- We continue to beef up the team with ongoing hires for a Senior IT Engineer, and Lecturers - Cytonn Technical College, among others. Visit our website Careers at Cytonn to apply.
During the week, T-bills were undersubscribed with the overall subscription rate coming in at 79.9%, compared to 124.4% recorded the previous week. The undersubscription can be attributed to tighter liquidity in the market, as can be seen by the increase in the average interbank rate to 6.1% from 5.3% recorded the previous week. The subscription rates for the 91, 182 and 364-day papers came in at 42.4%, 99.4%, and 75.4% compared to 125.8%, 141.8%, and 106.6%, respectively, the previous week. The yield on the 91-day paper remained unchanged at 8.0% while yields on the 182 and 364-day papers declined to 10.6% and 11.1%, from 10.7%, and 11.2%, respectively, the previous week. The overall acceptance rate remained relatively unchanged at 84.9% compared to 85.0% the previous week, with the government accepting a total of Kshs 16.3 bn of the Kshs 19.2 bn worth of bids received, against the Kshs 24.0 bn on offer. The government is still behind its domestic borrowing target for the current fiscal year, having borrowed Kshs 110.6 bn, against a target of Kshs 228.8 bn (assuming a pro-rated borrowing target throughout the financial year of Kshs 410.2 bn budgeted for the full financial year as per the Cabinet-approved 2017 Budget Review and Outlook Paper (BROP)). The usage of the Central Bank overdraft facility remains high as it stands at Kshs 41.5 bn compared to a nil overdraft at the beginning of this fiscal year.
The average interbank rate rose to 6.1% from 5.3% recorded the previous week, while the average volumes traded in the interbank market decreased by 29.7% to Kshs 11.5 bn from Kshs 16.3 bn the previous week.
The Kenyan Government has issued a 15-year amortized Infrastructure Bond (IFB 1/2018/15), with an effective tenor of 13.0 years, and a coupon of 12.5%, in a bid to raise Kshs 40.0 bn to fund infrastructural projects in the current fiscal year. The weighted average yield accepted on the most recent issued Infrastructural Bond (IFB/1/2017/7), was at a discount of 0.4% to the market yield of 12.6% as the government continued to reject expensive bids. The newly issued bond has a weighted tenor of 13.0 years after adjusting for partial redemptions; a similar taxable bond with the same tenor is currently trading at a yield of 13.1% in the secondary market, and hence we would bid at a yield of between 13.0% and 13.5%.
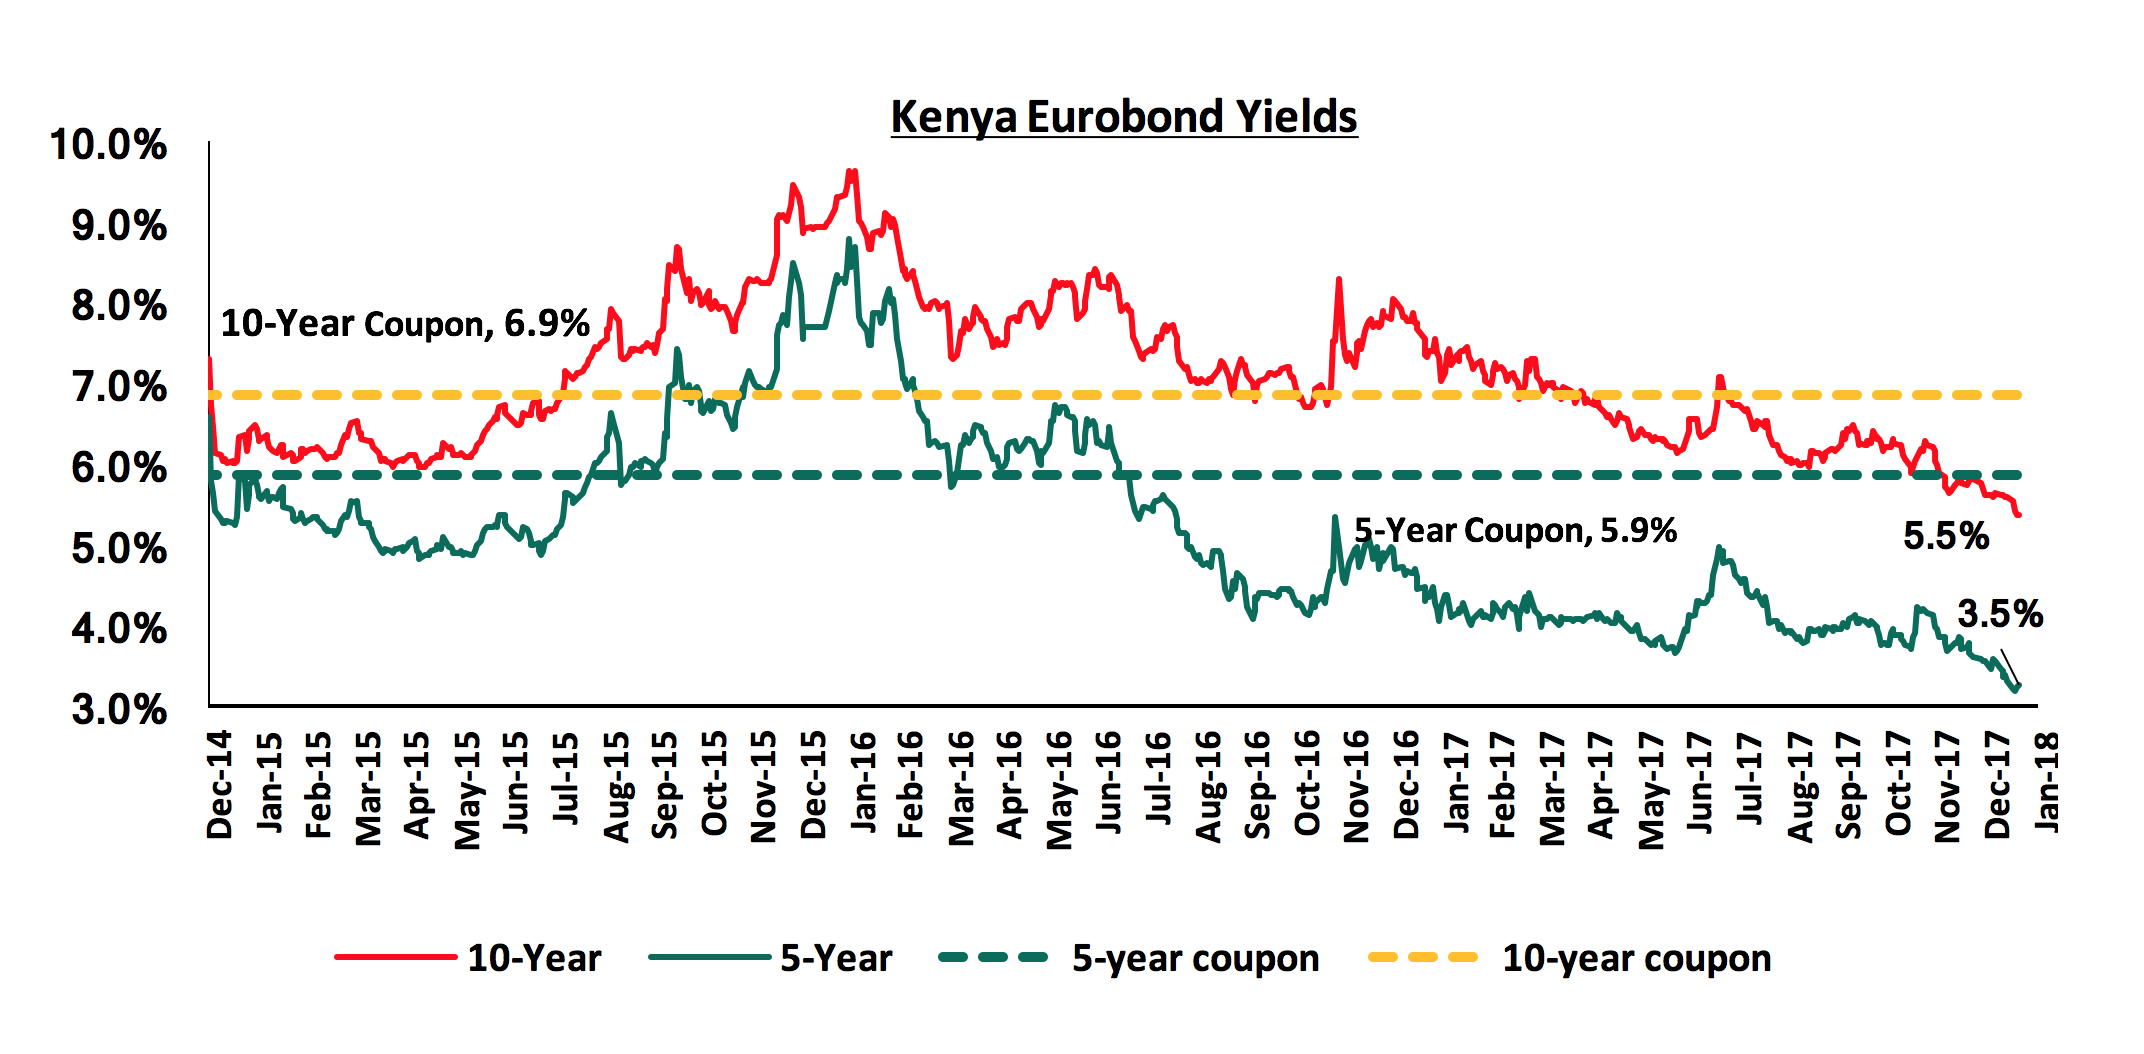
According to Bloomberg, yields on the 5-year and 10-year Eurobonds remained relatively unchanged during the week, to close at 3.5% and 5.5%, respectively. Since the mid-January 2016 peak, yields on the Kenya Eurobonds have declined by 5.3% points and 4.1% points for the 5-year and 10-year Eurobonds, respectively, due to the relatively stable macroeconomic conditions in the country. The declining Eurobond yields and stable rating by Standard & Poor (S&P) are indications that Kenya’s macro-economic environment remains stable and hence an attractive investment destination. However, concerns from Moody’s and the International Monetary Fund (IMF) around Kenya’s rising debt to GDP levels may see Kenya receive a downgraded sovereign credit rating if high debt levels persist.
The Kenya Shilling appreciated by 0.2% against the US Dollar during the week to a 6 weeks high of Kshs 102.9 from Kshs 103.1 the previous week, due to continued global weakening of the US Dollar. In our view, the shilling should remain relatively stable against the dollar in the short term, supported by:
- the calm political environment following the conclusion of the presidential elections,
- the weakening of the USD in the global markets as indicated by the US Dollar Index, which shed 9.9% in 2017, and 1.8% YTD hitting a 3-year low, and
- CBK’s intervention activities, as they have sufficient forex reserves, currently at USD 7.0 bn (equivalent to 4.7 months of import cover). Of note is that Reserves have been on a slight declining trend.
The Monetary Policy Committee (MPC) is set to meet on Monday, 22nd January 2018 to review the prevailing macroeconomic conditions and give direction on the Central Bank Rate (CBR). We expect the MPC to maintain rates at the current levels due to a relatively stable macro-economic environment, as evidenced by (i) inflation, which eased to 4.5% in December from 5.7% in October, due to decline in food prices, and (ii) the currency, that has been relatively stable, appreciating by 0.5% since the last meeting (ii) the need to support the economic growth after a slowdown witnessed last year. For our comprehensive analysis on the same, see our MPC Note.
According to the African Economic Outlook for 2018 by the African Development Bank (AfDB), the Eastern African Region shall remain the fastest growing sub-region in Africa, estimated to grow at a rate of 5.6% in 2017, 5.9% in 2018, and 6.1% in 2019. This growth will be driven by (i) continued growth in private consumption, (ii) public investment in infrastructure, (iii) a rebound in the agricultural sector, after a harsh year with unfavourable weather conditions in 2017, and (iv) accelerated construction and real estate activity. The report highlighted that the Sub-Saharan Africa region will rebound to a growth of 3.5% in 2018 and 3.9% in 2019 from the estimated growth of 2.8% in 2017, noting that most African economies are now more resilient and better placed to cope with harsh external conditions. However, AfDB noted that the heavy investment in infrastructure in the region, which is largely financed by external debt, requires careful monitoring to ensure that the economies are not strained, leading to adverse effects on economic growth. AfDB projects that Kenya’s economy will expand by 5.6% in 2018 and 6.2% in 2019 after depressed growth in 2017, having averaged 4.7% for the first three quarters of 2017 due to political uncertainty, slowdown in private sector credit growth, and subdued agricultural sector growth. However, the institution has warned Kenya on the rising levels of debt, asserting that high debt levels could strain the economy and have adverse effects on growth. This comes after the World Bank released its growth projections for Kenya for 2018 early in the year, projecting a growth of 5.5%. We shall be releasing our macroeconomic outlook report for Kenya highlighting our expectations for the year on 4th February, 2018.
Rates in the fixed income market have remained stable, and we expect this to continue in the short-term as the government rejects expensive bids despite being behind their borrowing target. However, a budget deficit that is likely to result from depressed revenue collection creates uncertainty in the interest rate environment as any additional borrowing in the domestic market to plug the deficit could lead to an upward pressure on interest rates. Consequently, our view is that investors should be biased towards short- term fixed income instruments to reduce duration risk.
During the week, the equities market was on an upward trend, with NSE 25, NASI and NSE 20 gaining 2.6%, 2.3% and 0.8%, respectively, taking their YTD performance to 5.2%, 5.1% and 0.7% for NASI, NSE 25 and NSE 20, respectively. For the last twelve months, NASI, NSE 25 and NSE 20 have gained 45.1%, 39.1% and 27.8%, respectively. This week’s performance was driven by gains in large cap stocks such as Barclays Bank of Kenya, Equity Group and Safaricom Ltd, which gained 10.8%, 6.0% and 4.4%, respectively. Since the February 2015 peak, the market has gained 1.5% for NASI and lost 32.0% for NSE 20.
Equities turnover increased by 149.7% to USD 78.9 mn from USD 31.6 mn the previous week. Foreign investors turned net buyers with a net inflow of USD 1.9 mn compared to a net outflow of USD 1.8 mn recorded the previous week. We expect the market to remain supported by improved investor sentiment this year, as investors take advantage of the attractive stock valuations in some of the stocks.
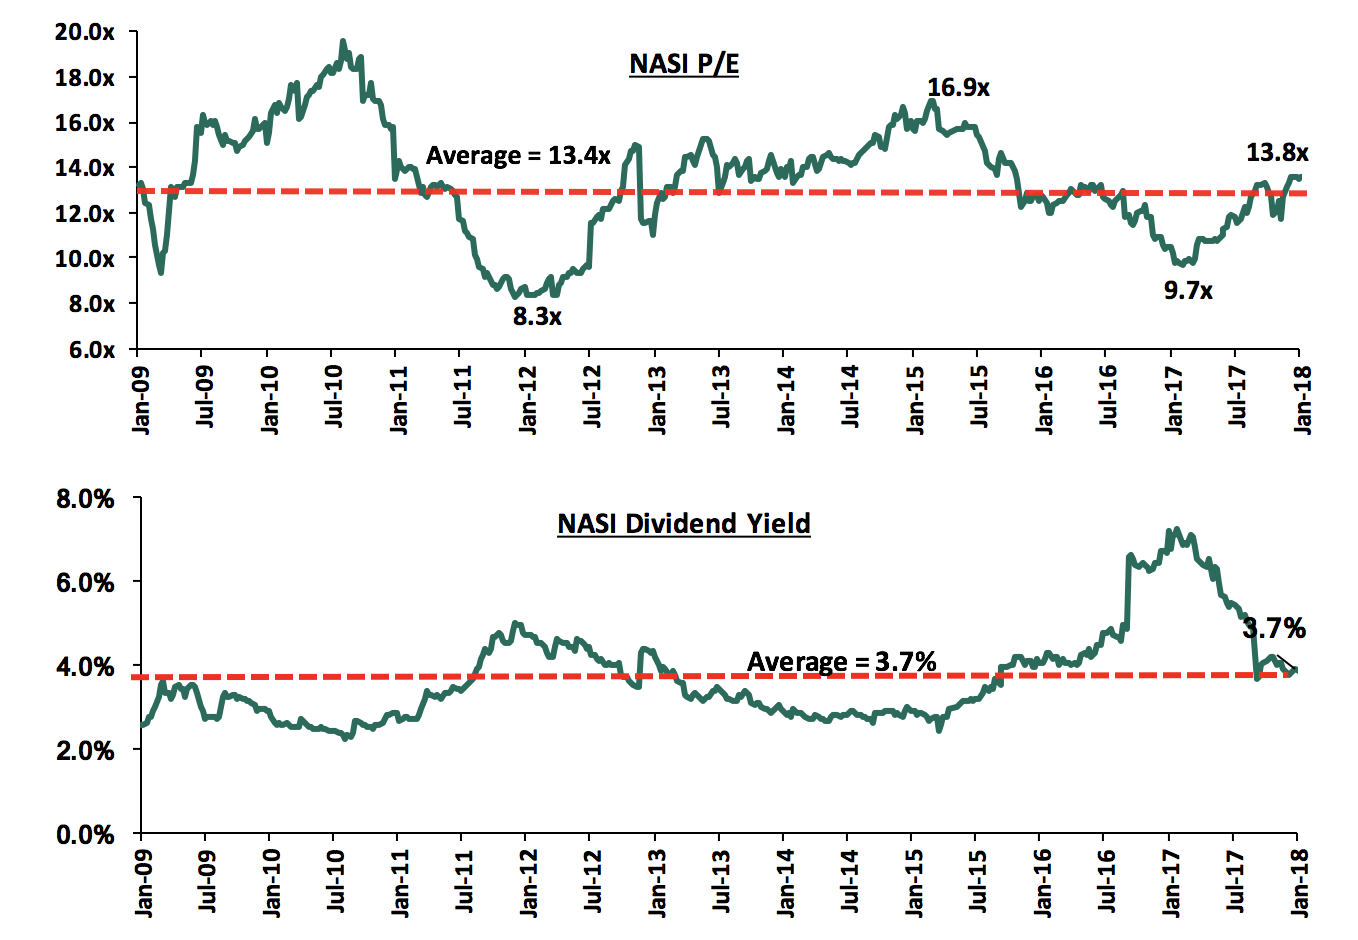
The market is currently trading at a price to earnings ratio (P/E) of 13.8x, which is 2.9% above the historical average of 13.4x, and a dividend yield of 3.7%, same as the historical average of 3.7%. The current P/E valuation of 13.8x is 42.3% above the most recent trough valuation of 9.7x experienced in the first week of February 2017, and 66.3% above the previous trough valuation of 8.3x experienced in December 2011. In our view, there are still pockets of value in the market, with the current P/E valuation being 22.5% below the most recent peak of 16.9x in February 2015. The charts below indicate the historical P/E and dividend yields of the market.
During the week, the Cabinet Secretary for the National Treasury, Henry Rotich gazetted the Capital Markets (Securities Lending, Borrowing and Short-Selling) Regulations, 2017. This comes after Capital Markets Authority (CMA) gave Nairobi Stock Exchange (NSE) the approval to launch a short selling and supporting securities lending facility, which will be functional as from the second quarter of 2018. Short selling is defined as the sale of borrowed shares. In short selling, the ownership of the stock is transferred to the borrower/short-seller for a specified period and they need to transfer it back to the owner. However, because the short seller does not own the stock, he must pay the lender any dividend or rights resulting from the loan stocks. Short sales are motivated by the conviction that a security's price will decline, enabling it to be bought back at a lower price thus making a profit, and are normally prompted by speculation, or by the desire to hedge the downside risk of a long position in a security. These new regulations stipulate that securities lending and borrowing transaction shall be carried out by (i) a regulated person; or (ii) any other person specified for that purpose by the Authority, this will ensure that the level of activity is tracked, and the regulators will be able to monitor trends driving the stock market thus avoiding panic and unnecessary selling pressure. The Capital Markets (Securities Lending, Borrowing and Short-Selling) Regulations, 2017 is in line with CMA’s Master Plan 2014-2023, which is aimed at deepening, diversifying and strengthening the securities industry. The Master plan is anchored on three key pillars, namely:
- Developmental and economic transformation,
- Infrastructure of the markets, and
- The legal and regulatory environment.
This facility will increase the volume of securities potentially available for trading thus help boost liquidity in the Kenyan capital market and also attract investors. As highlighted in our Cytonn Weekly #28/2017, the Capital Markets Authority (CMA) has done a fantastic job in spearheading the introduction of new products such as Global Depositary Receipts and Global Depositary Notes thus providing faster and more convenient link to the market hence enabling market participants to exercise freedom of choice, which will in turn increase turnover. The current challenge in the market is low volume of trades on the new products and this could be attributed to lack of proper investor education, and our suggestion is more investment towards educating the public before rolling out new products.
Equity Bank effected a money transfer commission on its mobile App, Eazzyapp, a product which used to be free for internal cash transfers. The move is aimed at increasing revenue from the non-funded income sources to a target of 40.0% - 45.0% contribution of Non-Funded Income (NFI) to the total operating income. The lender has also introduced a 5.0% upfront processing fee on its Equitel loans, aimed at supporting its income stream. With banks registering compressed net interest margins following the capping of interest rates, much of the attention has shifted to diversifying income through non-funded income, as this section of the bank’s revenue is not affected by the interest rate caps. Equity’s Non-funded income (NFI) grew by 10.4% in Q3’2017 same as the average for Kenya’s Listed Banks, taking its contribution to total income to 34.0%, from 27.8% registered in Q3’2016. In terms of pricing structures, as highlighted in our Cytonn Weekly #02/2018, most commercial banks have taken advantage of the gap allowing them to charge extra fees on the loans issued to increase the cost of credit well above the statutory ceiling of 14.0%. The total average cost of loans is at 18.0%, which is 4.0% above the 14.0% priced by the interest rate cap.
In order to ensure that the ranking of companies in the Cytonn Corporate Governance Report (Cytonn CGR) is up to date, we continually update the rankings whenever there are changes on any of the 24 metrics that we track and how they impact on the ranking. During the week, Stanbic Holdings Plc appointed Dorcas F. Kombo, CPA, as an Independent Non-Executive Director to the Board. Following this change, the gender diversity improved to 30.8% from 25.0%, resulting to an improvement in the gender score to 1.0 from 0.5. Stanbic Holding’s comprehensive score therefore increased to 58.3% from 56.3% and thus the rank improved to Position 39 from Position 41.
Below is our Equities Universe of Coverage:
|
all prices in Kshs unless stated otherwise |
|||||||||||||
|
No. |
Company |
Price as at 12/01/18 |
Price as at 19/01/18 |
w/w Change |
YTD Change |
Target Price* |
Dividend Yield |
Upside/ (Downside)** |
|||||
|
1. |
NIC*** |
35.3 |
37.0 |
5.0% |
9.6% |
61.4 |
3.5% |
69.5% |
|||||
|
2. |
DTBK |
196.0 |
200.0 |
2.0% |
4.2% |
281.7 |
1.4% |
42.2% |
|||||
|
3. |
KCB Group |
44.3 |
45.3 |
2.3% |
5.8% |
59.7 |
6.8% |
38.7% |
|||||
|
4. |
I&M Holdings |
119.0 |
116.0 |
(2.5%) |
(8.7%) |
150.4 |
2.5% |
32.2% |
|||||
|
5. |
Barclays |
9.8 |
10.8 |
10.8% |
12.5% |
12.8 |
10.2% |
28.7% |
|||||
|
6. |
Kenya Re |
19.8 |
19.6 |
(1.0%) |
8.0% |
24.4 |
3.8% |
28.7% |
|||||
|
7. |
Liberty Holdings |
13.5 |
13.2 |
(2.6%) |
7.8% |
16.4 |
0.0% |
24.7% |
|||||
|
8. |
Britam |
13.0 |
13.2 |
1.2% |
(1.5%) |
15.2 |
1.8% |
17.4% |
|||||
|
9. |
Sanlam Kenya |
27.8 |
27.0 |
(2.7%) |
(2.7%) |
31.4 |
1.1% |
17.2% |
|||||
|
10. |
Co-op Bank |
16.5 |
16.8 |
1.5% |
4.7% |
18.6 |
5.6% |
16.6% |
|||||
|
11. |
Jubilee Insurance |
499.0 |
505.0 |
1.2% |
1.2% |
575.4 |
1.7% |
15.7% |
|||||
|
12. |
CIC Group |
5.6 |
5.6 |
0.9% |
0.0% |
6.2 |
1.8% |
12.5% |
|||||
|
13. |
HF Group*** |
10.2 |
11.0 |
7.9% |
5.3% |
11.7 |
0.9% |
7.9% |
|||||
|
14. |
Stanbic Holdings |
82.5 |
81.0 |
(1.8%) |
0.0% |
79.0 |
5.1% |
2.6% |
|||||
|
15. |
Stanchart |
207.0 |
205.0 |
(1.0%) |
(1.4%) |
201.1 |
4.3% |
2.4% |
|||||
|
16. |
Equity Group |
41.5 |
44.0 |
6.0% |
10.7% |
42.3 |
4.3% |
0.5% |
|||||
|
18. |
NBK |
9.3 |
9.0 |
(3.2%) |
(4.3%) |
5.6 |
0.0% |
(37.8%)
|
|||||
|
*Target Price as per Cytonn Analyst estimates |
|
|
|
|
|
||||||||
|
**Upside / (Downside) is adjusted for Dividend Yield |
|||||||||||||
|
***Banks in which Cytonn and/or its affiliates holds a stake |
|||||||||||||
|
For full disclosure, Cytonn and/or its affiliates holds a significant stake in NIC Bank, ranking as the 9th largest shareholder |
|||||||||||||
We remain neutral on equities for investors with short-term investment horizon, but are positive for investors with a long-term investment horizon. Despite the lower earnings growth prospects for 2017, the market has rallied and brought the market P/E closer to its historical average. Pockets of value exist, with a number of undervalued counters in some sectors like Financial Services, which provide an attractive entry point for long-term investors.
Atlas Mara Limited, a financial services holding company formed to undertake the acquisition of target banks in Africa, has increased its strategic stake in Union Bank Nigeria (UBN) through a Naira 26.3 bn (USD 75.0 mn) investment in UBN’s rights issue. UBN completed a Naira 49.7 bn (USD 138.2 mn) rights offering on the Nigerian Stock Exchange at a price of Naira 4.1 per share and registered a 120.0% subscription rate. Atlas Mara’s investment of USD 75.0 mn translates to around 6.4 bn shares. Atlas Mara previously owned 44.5% of UBN’s issued share capital at the time, translating to 7.6 bn shares. With the acquisition, Atlas will have 10.3 bn shares in total, of the 29.1 bn shares issued translating to a 48.0% ownership in UBN, having fully subscribed to the rights related to its pre-existing 44.5% shareholding, and acquired shares representing a 3.5% shareholding through application for additional shares during the rights issue. As at H1’2017, Union Bank had a book value of N 276.7 bn, as such, the transaction was carried out at a price-to-book value (P/Bv) of 0.3x, which is a 84.2% discount to the average P/TBv multiple of 1.9x for select listed Banks in Nigeria, hence a relatively cheaper transaction valuation.
The table below indicates the current trading multiples of select Nigerian Banking Stocks:
|
Banks |
Market Cap (USD mns) |
No. of Shares(bns) |
Current Price |
P/TBv |
P/E |
Historical P/TBv |
|
Access Bank |
1,028.2 |
28.9 |
12.6 |
0.8x |
4.0x |
0.5x |
|
FBN Holdings |
1,407.5 |
35.9 |
13.9 |
0.8x |
15.7x |
0.5x |
|
Union Bank Plc |
664.1 |
29.1 |
8.1 |
0.9x |
7.0x |
0.5x |
|
Ecobank Transnational |
1,336.5 |
18.3 |
19.7 |
0.9x |
4.6x |
0.8x |
|
UBA Bank |
1,319.2 |
36.3 |
12.9 |
1.0x |
3.9x |
0.6x |
|
Zenith Bank |
2,922.7 |
31.4 |
33.0 |
1.4x |
4.3x |
1.0x |
|
Stanbic IBTC Holdings |
1,297.6 |
10.0 |
46.0 |
2.9x |
10.1x |
1.8x |
|
Guaranty Trust Bank |
4,542.1 |
29.4 |
54.7 |
3.1x |
8.2x |
1.8x |
|
Average |
1,979.1 |
27.2 |
27.5 |
1.9x |
7.2x |
1.2x |
|
High |
4,542.1 |
36.3 |
54.7 |
3.1x |
15.7x |
1.8x |
|
Low |
1,028.2 |
10.0 |
12.6 |
0.5x |
3.9x |
0.5x |
UBN is Atlas’s third investment into the financial services sector in SSA after Banque Populaire du Rwanda (BPR), which is the second largest bank in Rwanda, and BancABC a subsidiary of ABC Holdings Limited headquartered in Botswana. UBN will use 80.0% of the proceeds as working capital, 12.0% will be invested in technology and digitization, and 8.0% in advertisement and customer outreach. We expect that investors will continue to show interest in the listed and non-listed financial service space, motivated by attractive valuations with most listed banks in SSA trading below the sectors average P/TBv of 1.8x for countries in our universe of coverage, coupled with increased capital requirements across the sector.
Private equity investments in Africa remains robust as evidenced by the growing number of successful exits. The increasing investor interest is attributed to (i) rapid urbanization, a resilient and adapting middle class and increased consumerism, (ii) the attractive valuations in Sub Saharan Africa’s private markets compared to its public markets, (iii) the attractive valuations in Sub Saharan Africa’s markets compared to global markets, and (iv) better economic projections in Sub Sahara Africa compared to global markets. We remain bullish on PE as an asset class in Sub-Sahara Africa. Going forward, the increasing investor interest and stable macro-economic environment will continue to boost deal flow into African markets.
During the week, the government announced several additional initiatives aimed at enabling access to ownership of housing in the country and thus reducing existing deficit by increasing development activities. These include:
- The shortlisting of 35 private construction firms by the Ministry of Transport Infrastructure Housing and Urban Development for a Public Private Partnerships (PPP’s) arrangement, which will involve the construction of 1.0 mn affordable housing units in Mavoko, Kitengela and Athi River through a PPP arrangement in which the government will provide the land and trunk infrastructure including road, water, and power with the contractors developing the houses. The pilot program will be launched in February 2018 in Mavoko. The project is expected to have a total cost of Kshs 2.6 trn, and
- State Department of Housing and Urban Development, announced plans to construct 620 houses in Embu, Machakos and Kiambu counties. The houses will be developed under the Civil Servants Housing Scheme Fund, which was launched in 2004 to provide loan schemes for the purchase or development of property by state officers. The initiative has benefited 3,072 civil servants. The development will comprise one, two and three bedroom apartments with Embu set to benefit with the most housing units from the initiative at 220 while Machakos and Kiambu will get 200 units each. The move is an indicator that devolution is slowly picking pace as state departments become increasingly upbeat in addressing county deficits.
These are just the latest among a number of initiatives that the government has been undertaking in a bid to reduce the housing deficit and enable access to housing in recent years with the others being;
|
Public Sectors Initiatives on Affordable Housing in Recent Years |
|||
|
State Department/ Ministry |
Initiative |
Target Market |
Progress |
|
State Department of Housing and Urban Development |
8,000 units in Mavoko |
Low and Middle-Income residents |
Broke ground in 2017 |
|
Nairobi County Government |
14,000 units in Nairobi ( Old and New Ngara, Uhuru and Joseph Kangethe Estates) |
Low and Middle-Income residents |
Broke ground in 2017 |
|
Ministry of Transport Infrastructure and Urban Development |
75 units in Murang’a |
Civil Servants |
Broke ground in 2017 |
|
County Government of Kirinyaga |
Kshs 10 billion real estate around Thiba Dam |
Low and Middle-Income residents |
Expected to break ground late 2018 after completion of the Thiba Dam |
In our view, the initiatives are a step in the right direction since if successfully implemented will reduce the housing deficit that currently stands at approximately 2.0 mn units, growing at approximately 200,000 units per annum. The provision of the land and infrastructure by the government will also increase the affordability of the houses and thus access to property ownership as these costs contribute significantly to the development costs and thus the eventual costs of the houses. However, we are sceptical about the working of PPP’s in Kenya due to; (i) regulation hindrances such as lack of a mechanism to transfer public land to an SPV to facilitate participation by private developers and private capital, (ii) lack of clarity in terms of revenue sharing and the long-term nature of the projects that usually exceed 10 years whilst private developers typically have funding for 3-5 years, and (iii) inadequacy in off taker financing as the mortgage levels declined by 1.5% with the number of mortgages at only 24,085 as at 2016 from 24,485 in 2015. For example, one of the highly anticipated PPPs in real estate was the Kenyatta University PPP that was announced in 2015 and is yet to kick off 3 years later.
In retail, foreign retailers continue making inroads in the Kenyan retail sector capitalizing on the financial woes of some of the major local retail chains. This week, Carrefour opened its fourth store locally at the Junction mall taking up space vacated by Nakumatt. The retailer will initially take up 1,300 SQM of space expanding to 4,700 SQM once refurbishment of the space is complete. Last week, Choppies from Botswana took up space in Nanyuki Mall, where Nakumatt had been evicted due to rental arrears. Other than supermarkets, other international retailers that have been expanding locally include; Mr Price and Manix Clothes Stores. Local retailers have also been on an expansion offensive with Naivas and Tusky’s opening 7 and 4 new stores last year, respectively, thus maintaining the dominance by local retailers in the retail sector as shown in the table below:
|
Retailers Market Share in Kenya by Number of Stores |
||
|
Retailer |
No of Stores |
% Share |
|
Tuskys |
64 |
37.4% |
|
Naivas |
41 |
24.0% |
|
Nakumatt |
34 |
19.9% |
|
Uchumi |
16 |
9.4% |
|
Choppies |
11 |
6.4% |
|
Carrefour |
4 |
2.3% |
|
The Game |
1 |
0.6% |
|
Total |
171 |
100.0% |
|
||
Source: Cytonn Research
The expansion activities by retailers indicate a healthy retail sector, which is supported by; (i) positive demographics evidenced by high population growth rate of 2.6% against global average of 1.2% that has led to sustained demand, (ii) high urbanization rates of 4.4% higher than global rates of 2.1% that has resulted in the need for more retail stores, (iii) high economic growth rates with a GDP growth rate averaging above 5.0% between 2011 and 2016 thus boosting disposable incomes and increasing purchasing power, (iv) rapid growth of infrastructure making investors venture into accessible areas, (v) Kenya’s growing position as a regional and continental hub hence witnessing an increase in multinationals operating in the county, and (vi) e-commerce as seen through the digitization of cash systems and a rise in mobile money and internet subscriptions. We thus have a positive outlook for the retail sector in Kenya. Retailers, especially local chains however, will have to institute better financial and supply chain management processes, and strong corporate governance framework in order to avoid pitfalls encountered by Nakumatt and Uchumi.
Other highlights in the sector include:
- Java Group, the leading restaurant chain in Kenya, is set to invest between Kshs 0.5 - 1.0 bn in its expansion drive in Kenya as part of plans to increase its foothold in the country. The restaurant chain that recently opened its Eldoret and Kericho branches has a cumulative, 64 outlets plans to open new branches in major towns in the country as well as emerging towns. The firm seeks to open at least 2 outlets every month, with the maiden branches in the year expected to be located in Machakos and Meru counties, and
- Deacons is selling its Mr Price Kenya franchise to Mr Price Group South Africa. Once approved, the deal will see Mr Price Group gain 11 stores.
The retail sector is set to experience growth as seen through (i) increase in foreign investment evidenced by the high number of entrants including South African Retailers, The Game, Woolworths and Mr. Price Group, French-based retailer Carrefour and Botswana retailer Choppies as well as (ii) growth in e-commerce as seen through the growth of online shops for instance Rupu, Kilimall and Jumia that recorded increase of 366.0% in mobile sales between 2015/16 as well as the popularity of the mobile wallet and the digitization of cash systems.
In the hospitality sector, Kenya continues to attract positive global sentiments. This week, Trip Advisor a travel as well as restaurant Website Company, ranked Nairobi the 3rd best place to visit in 2018 only behind Ishigaki Island in Japan and Kapaa in Hawaii. Top sites in Nairobi according to the ranking include; Giraffe center, Karen Blixen Museum and the Black Rhinos at the National Park of Nairobi. The ranking was based on service, quality and customer satisfaction from its users based on an increase in positive rankings by the visitors in the specific cities. The visitors sited the unique combination of Nairobi’s holiday spots, wildlife, nightlife and serene weather conditions as the main reason for the positive rankings. This is the latest award being won by the Kenyan tourism sector with others being; (i) The Travel Corporation (TTC) listed Kenya as one of the top 10 transformative travel experiences in the globe, and (ii) The World Travel Awards 2017 where Maasai Mara and Diani beach clinched the top national park and leading beach destination respectively, in Africa. This international recognition is likely to boost the tourism sector locally with the endorsement by Trip Advisor being particularly significant given that it is the largest travel site in the world with 460.0 mn users and more than 500 mn reviews and an international appeal. We thus expect the number of tourist arrivals to continue trending upwards having grown by 13.9% to 1.0 mn in 2016 visitors from 0.8 mn visitors in 2015.
Our outlook for the hospitality sector is positive and we expect the sector’s performance to be boosted by; (i) political stability following the conclusion of the general elections, (ii) Improved security and government support for the sector and (iii) persistent marketing that should help us generate buy-in from international markets, for instance, USA and Africa, and (iv) the growing domestic tourism and Meetings, Incentives, Conventions, and Events (MICE).
In overall, we expect the real the estate sector to pick up in 2018 as seen through: (i) the increased international investor interest in the sector, (ii) positive sentiments from the global community and (iii) direct government attention with the sector being part of the 4 main sectors of focus in the current government’s transformational journey.
Over the last few years, we have been investing in the Nairobi metropolitan area. We however continuously do research in the other regions to see in what places we can undertake investments and developments on behalf of our investors. Our Real Estate Research & Deal Origination (RDO) team spends time in the target market, collecting and analyzing data to make the best investment recommendation both for our own proprietary use and to inform the investors of the trends in the markets. As such, and in line with our regional expansion strategy, we have been carrying out research on various markets across the Kenyan Counties. Currently we have covered 13 Counties, among them being Laikipia, Meru, Mombasa, Kisumu and Uasin Gishu. We have chosen Nyeri County to serve as the Mt. Kenya Regional Office due to its centrality in the region. We also target to open offices in other Counties such as Kisumu, Mombasa, Nakuru and Uasin Gishu as they remain attractive from a macroeconomic perspective, are in need of modern real estate developments, and can support good returns for investors.
This week we look at our real estate findings in the commercial, residential, holiday homes, and site and service schemes markets in Nyeri Town. We start by a general overview of the area, and then cover the key drivers and challenges for the real estate market in Nyeri, followed by an analysis of the performance of the various themes, before finally concluding with our outlook on the market.
Overview
Nyeri Town is situated in the Central Highlands of Kenya, about 150 km north of Kenya's capital city Nairobi, lying between the eastern base of the Aberdare (Nyandarua) Range, which forms part of the eastern end of the Great Rift Valley, and the western slopes of Mount Kenya. It is the largest town in Nyeri County and the headquarter of Nyeri County, and former central administrative headquarters of Central Province. This therefore makes the area a strategic location to serve all the counties located in Mt. Kenya region such as Kirinyaga, Meru, Laikipia, Nyandarua, Muranga, Embu and Tharaka Nithi.
Nyeri has witnessed growth in infrastructure and amenities over the last five years attributed to:
- devolution due to flow of money from central government to county governments most of which is invested locally,
- tourism in the area which continues to grow,
- infrastructure development,
- relatively higher incomes, with it being the second richest county in terms of GDP per capita in the country at USD 1,503, after Kiambu at USD 1,785. Rounding up the top 5 richest Counties are Kajiado at USD 1,466, Nakuru at USD 1,413 and Laikipia at USD 1,226 on 3rd, 4th and 5th positions respectively
- its strategic central location in the Mount Kenya Region.
The water supply and sewerage are from Nyeri water and sewerage Company limited (NYEWASCO). The area is served by a number of main roads including: Nyeri – Nyahururu road, Nyeri-Karatina road and the Nyeri – Nanyuki road
The main factors driving the Real Estate Market in Nyeri are;
- Kenya Regional Headquarters – Nyeri is centrally located bordering over five counties in the Mt. Kenya Region, such as Nyandarua, Laikipia, Meru, Embu and Murang’a. This has led to attracting Mt. Kenya Regional offices for both local and international companies such as the Safaricom Mt. Kenya regional hub, National Construction Authority (NCA) Mt. Kenya Regional Office, and Coca Cola Mt. Kenya Bottlers Ltd, hence creating demand for office space, retail and in the housing sector,
- Devolution – Devolution has opened up Nyeri town, attracting government institutions, private investors and entrepreneurs to the county headquarters. This has therefore created demand for office space, retail space and residential to host all the investors and government officials,
- Growth of middle-income earners –Growth of the middle-income earners has translated to increased disposable income hence creating demand in the housing sector and retail facilities, which translates to towns such as Nyeri,
- Tourism – Nyeri County is on a major tourist circuit to Mt. Kenya and the northern region, hosting key tourist attractions such as the Lord and Lady Baden Powell graves, Mount Kenya and the Aberdares National Park. These therefore promotes the hospitality sector, hence creating demand for hotels, holiday homes and conference facilities, and,
- Growth of SMEs – The increase in the number of SMEs due to ease in business registration that takes a maximum of 2-weeks. Mt. Kenya Region hosts many of these companies, and requires office space and housing for the employees, hence drive the demand for real estate.
However, despite all the factors supporting the real estate sector in Nyeri, there are still a number of factors, which if not properly addressed present challenges to real estate development in the county:
- Availability of Land - Availability of land for development in Nyeri County has been low owing to the dense population at 208/km² in comparison to Kenya’s population density at 85/km², hence resulting in relatively high land prices. The county has also been operating largely like a closed circuit with minimal land sales to non-locals. This is mainly due to ownership of ancestral land; hence, people have sentimental attachment. This operation has therefore led to slow investment growth,
- Access to Funds – Just like other counties in Kenya, Nyeri is facing challenges on lack of proper funding for developments due to limited access to finance, characterized by few sources of funds to both developers and homeowners, hence low housing supply and commercial properties that are capital intensive. The Banking Amendment Act 2015 and more prudent lending by banks has also resulted in a decline in credit supply in the market which will hinder Real Estate developments,
- Unstructured planning regulations – Unstructured planning regulations, which currently does not clearly outline areas zoned for commercial, residential and special needs. This may lead to urban sprawl in urban centers and reduced land use maximization. The county is however working on setting up zoning regulations to formulate land use standards, zoning schemes and ordinances for all urban settlements in the county.
- Inadequate Infrastructure - Inadequate infrastructure such as access roads, with most being earthen roads, water services and drainage systems are poor, hence slowing the growth of real estate due to reluctant investors.
Nyeri Market Performance:
We undertook our research in August 2017, our market research focused on;
- Plinth Area - Research on the size of the units found in the market allows us to gauge the current offering, and put into consideration the home buyer’s preferences for sizes of houses,
- Prices - Research on prices will be used in comparison of our products against the market prices,
- Rental Rates - Research on rental income allows us to inform potential investors on the current rental rates in other developments and also inform the investors on the prospective rental yield they can gain from investing in Nyeri,
- Annual Uptake - This allows the investor to appreciate the rate at which available homes are sold over a specific period. This helps him/her gauge on whether it is profitable to invest in a given area.
The key themes covered are:
- Residential
Generally, the residential sector is picking up, with most of the estates having existed for less than 5-years. This has been driven by the government decentralization, urbanization and growth of middle class in the region. The residential houses are distributed in the outskirts of the Central Business District (CBD), such as Ring Road, Kamakwa and Kingongo areas. The key estates in the area are Garden Estate, Mountain View Estate, Ring Road Estate, which comprise mainly of owner-built and occupied standalone houses.
National Housing corporation (NHC) is the only institutional developer in Nyeri, having constructed residential bungalows available for sale to the public. Other real estate companies, operating in Nyeri real estate sector are Mhasibu Housing Company Limited, Gakuyo Real Estate and Madiba Properties Limited, among others that are selling land with a gated community concept.
We analyzed the performance of NHC bungalows performance, to gauge the market and the research findings are as follows;
|
All values in Kshs unless otherwise stated |
||||||||||||
|
Nyeri NHC Bungalow Units Performance Summary |
||||||||||||
|
Room Typology |
Unit Plinth Area (SQM) |
Initial Price (2014) |
Initial price per SQM |
Current Price (2017) |
current price per SQM |
Monthly Rent |
Monthly rent per SQM |
Sales achieved |
Annual Sales achieved |
Price App. |
Rental Yield |
Total Return |
|
1 bed |
42 |
2,800,000 |
66,667 |
3,200,000 |
76,190 |
10,000 |
238 |
100% |
33% |
4.6% |
3.8% |
8.3% |
|
2 beds |
54 |
3,500,000 |
64,815 |
4,000,000 |
74,074 |
20,000 |
370 |
71% |
24% |
4.6% |
4.3% |
8.8% |
|
3 beds |
69 |
4,000,000 |
57,971 |
4,400,000 |
63,768 |
28,000 |
406 |
67% |
22% |
3.2% |
5.1% |
8.3% |
|
Average |
63,151 |
71,344 |
338 |
79% |
26% |
4.1% |
4.4% |
8.5% |
||||
|
· The NHC development, have registered a total return of 8.5%, due to low appreciation rate, given the market has not accepted the build and sale exit model |
||||||||||||
|
· The 1-bedroom units have recorded the highest uptake at 33% annual uptake as compared to other typologies averaging at 23% annual uptake. This can be attributed to the fact that 1-bedroom are cheaper, and investors are targeting renters market, comprising of young working adults |
||||||||||||
Source: Cytonn Research August 2017
The residential apartments in and around Nyeri town are available for rent and the market is yet to witness a build for sale model. The analysis assumes an exit price of Kshs 71,344 per SQM, similar to the standalone units.
The performance on the sector is as follows;
|
All values in Kshs unless otherwise stated |
||||||
|
Nyeri 1- Bedroom Units Performance Summary |
||||||
|
Project |
Location |
Unit Plinth Area (SQM) |
Monthly Rent |
Monthly rent per sqm |
Occupancy % |
Rental Yield |
|
Hill View Place |
Kamakwa |
10,000 |
238 |
100% |
4.0% |
|
|
Pamki House |
CBD |
10,000 |
238 |
100% |
4.0% |
|
|
Kingongo Apartments |
Kingongo |
7,500 |
179 |
100% |
3.0% |
|
|
San Homes |
Ringroad |
52 |
10,000 |
238 |
60% |
2.4% |
|
Urban Premier Properties |
Kamakwa |
32 |
6,000 |
143 |
90% |
2.2% |
|
Average |
42 |
8,700 |
207 |
90% |
3.1% |
|
|
· 1-bedroom apartments have on average a rental yield of 3.1% at an occupancy rate of 90%. The low rental yields in comparison to Nairobi average rental yield of 6.0% is due to low rental charges, that the market is willing to pay |
||||||
Source: Cytonn Research August 2017
|
All values in Kshs unless otherwise stated |
||||||
|
Nyeri 2- Bedroom Units Performance Summary |
||||||
|
Project |
Location |
Unit Plinth Area (SQM) |
Monthly Rent |
Monthly rent per sqm |
Occupancy % |
Rental Yield |
|
El Dorado Apartments |
Kingongo |
35,000 |
515 |
100% |
8.7% |
|
|
Skyfon Apartment |
CBD |
46 |
12,000 |
261 |
83% |
3.7% |
|
Grand View Apartments |
Kamakwa |
66 |
15,000 |
227 |
94% |
3.6% |
|
Kim Joy Apartments |
Kingongo |
76 |
15,000 |
197 |
100% |
3.3% |
|
Jesma Apartments |
Kingongo |
70 |
15,000 |
214 |
89% |
3.2% |
|
Emma Apartments |
Ringroad |
71 |
13,500 |
190 |
90% |
2.9% |
|
PCEA Apartments |
Kingongo |
80 |
12,000 |
150 |
92% |
2.3% |
|
San Homes |
Ringroad |
67 |
13,500 |
201 |
60% |
2.0% |
|
Average |
68 |
13,714 |
206 |
87% |
3.0% |
|
|
*The average excludes EL Dorado apartments since it’s an outlier, providing better amenities such as parking bays and quality finishing |
||||||
|
· 2-bedroom apartments have on average a rental yield of 3.0% at occupancy rates of 87% driven by young families. The low rental yields are attributable to low rental charges as most people prefer living in their ancestral land or own built houses in the urban centres |
||||||
|
· The average monthly rental charges for 2-bedroom apartments is Kshs. 13,714. The rental charges are mainly informed by the quality of the building, amenities and distance from C.B. D |
||||||
Source: Cytonn Research August 2017
|
All values in Kshs unless otherwise stated |
||||||
|
Nyeri 3- Bedroom Units Performance Summary |
||||||
|
Project |
Location |
Unit Plinth Area (SQM) |
Monthly Rent |
Monthly rent per SQM |
Occupancy % |
Rental Yield |
|
Summers Apartments |
Ringroad |
120 |
40,000 |
333 |
100% |
5.6% |
|
Skyfon Apartment |
CBD |
58 |
17,000 |
293 |
100% |
4.9% |
|
Average |
89 |
28,500 |
313 |
100% |
5.3% |
|
|
· Nyeri Town has very few 3-bedroom apartments, given that families prefer living in their ancestral land facilitated by good infrastructure and amenities in rural areas |
||||||
|
· 3-bedroom apartments have an average rental yield of 5.3%, at 100% occupancy higher than 1 and 2-bedroom apartments since they are located in upper middle-income neighbourhood hence attracting higher rental charges |
||||||
Source: Cytonn Research August 2017
Summary
|
All values in Kshs unless otherwise stated |
||||
|
Nyeri Residential Apartments Summary |
||||
|
Project |
Unit Plinth Area |
Monthly rent per sqm |
Occupancy % |
Rental Yield |
|
1 Bedroom |
42 |
207 |
90% |
3.1% |
|
2 Bedroom |
68 |
206 |
87% |
3.0% |
|
3 Bedroom |
89 |
313 |
100% |
5.3% |
|
Average |
242 |
92% |
3.8% |
|
|
· The Nyeri town residential sector has an average rental yield of 3.8%, at 92% occupancy and Kshs. 242 monthly rent per SQM. The high occupancy rates are driven by increased urban population from young working adults and county officers |
||||
|
· 3-bedroom apartments recorded the highest average rental yield of 5.3%. This is attributable to higher rental charges that the tenants are willing to pay for the better amenities provided such as parking bays, perimeter wall and quality finishes |
||||
Source: Cytonn Research August 2017
- Commercial Properties
The summary of the sector’s performance is as below:
|
All prices in Kshs. Unless stated otherwise |
|||||
|
Commercial Properties Performance in Nyeri August 2017 |
|||||
|
Project |
Location |
Rent per Sqft (Retail) |
Rent per Sqft |
Occupancy |
Rental Yield |
|
KonaHauthi |
Along Townhall rd |
100 |
100% |
24.0% |
|
|
Sohan Plaza |
On Kimathi and Nyayo street Junction |
80 |
80 |
95% |
18.2% |
|
Rware Building |
Gakere road |
80 |
80% |
15.4% |
|
|
Umoja House |
Kimathi Street |
57 |
90% |
12.3% |
|
|
Nyeri Cooperative Union Limited Building |
Along Townhall rd |
50 |
90% |
10.8% |
|
|
Central Plaza |
Kimathi street |
28 |
90% |
6.0% |
|
|
Katsuri building |
Kimathi Street |
100 |
19% |
4.6% |
|
|
Peak centre |
senior Chief Wambugu rd |
125 |
90% |
||
|
Prestige plaza |
Kimathi Street |
103 |
90% |
||
|
Average |
103 |
71 |
83% |
13.0% |
|
|
· Commercial office in Nyeri have an average yield rate of 13% at a rent per Sqft of Ksh. 71 and exit cost of approximately Ksh. 5,000 per sqft informed by buildings on sale and an average occupancy of 83% |
|||||
|
· Nyeri lacks grade A or B offices, with most of the offices being in bad state of repair. Renovated and upcoming buildings are attracting higher occupancy since people are willing to pay for the facilities, hence presents an opportunity for investing in Commercial property |
|||||
Source: Cytonn Research August 2017
- Site and Service Schemes Research
The summary of the sector’s performance is as below:
|
All values in Kshs. Unless otherwise stated |
||||||
|
Nyeri 1/4-acre plots Performance Summary |
||||||
|
Name of the Development |
Location |
Size of Plots (Acres) |
Selling Price (Ksh) - 2017 |
Sales Achieved |
Annual Uptake |
Annual Capital App. |
|
Twin Mount Estate – Nyeri |
5Kms from Nyeri Town |
1/4 acre |
2.0Mn |
87% |
17% |
32.0% |
|
Madiba Gardens Nyeri |
near Kimathi university |
1/4 acre |
2.8Mn |
12% |
8% |
12.0% |
|
Kingongo Plots |
4.4 Km Nyeri-Nyahururu rd. |
1/4 acre |
3.8Mn |
59% |
59% |
7.0% |
|
Average |
2.9Mn |
53% |
28% |
17.0% |
||
|
· 1/4-acre plots have an average price of 2.9Mn, recording an annual capital appreciation of 17.0% mainly driven by infrastructural development |
||||||
Source: Cytonn Research August 2017
|
All values in Kshs. Unless otherwise stated |
|||||||
|
Nyeri 1/8-acre plots Performance Summary |
|||||||
|
Name of the Development |
Location |
Size of Plots (Acres) |
Selling Price (Ksh) - 2017 |
Sales Achieved |
Annual Uptake |
Annual Capital App. |
|
|
Sifa Gardens |
20km Nyeri - Nanyuki rd |
1/8 acre |
0.6Mn |
94% |
94% |
38.0% |
|
|
Rorenu |
1/8 acre |
3.0Mn |
100% |
67% |
13.0% |
||
|
Lusoi Gardens |
29 km Nyeri – Narumoru rd |
1/8 acre |
0.3Mn |
29% |
29% |
12.0% |
|
|
Grace Gardens Nyeri |
Mweiga (Nyeri - Nyahururu rd) |
1/8 acre |
0.8Mn |
80% |
80% |
7.0% |
|
|
Gatitu |
8.6 km Nyeri - Karatina rd |
1/8 acre |
1.4Mn |
93% |
47% |
||
|
Average |
1.2Mn |
79% |
63% |
17.5% |
|||
|
· 1/8-acre plots have an average price of 1.2Mn, recording an annual capital appreciation of 17.5% mainly driven by amenities in proximity and infrastructural development |
|||||||
|
· Cost of land, in Nyeri is dependent on level of servicing and the location, with land within or in close proximity to the CBD recording higher prices |
|||||||
Source: Cytonn Research August 2017
- Holiday Homes Research
The summary of the sector’s performance is as below;
|
All values in Kshs unless stated otherwise |
||||||||||
|
Holiday Homes Performance Summary |
||||||||||
|
Name of Development |
Size of Unit (SQM) |
Land size |
No. of BR |
2017 Price (Ksh) |
2017 Price per SQM (Ksh) |
Monthly Rent (Ksh) |
Monthly Rent per SQM (Ksh) |
Uptake |
Annual Uptake |
Yield (%) |
|
OLosinya Villa Peacock Batuk |
200 |
0.1 |
4 |
16.5 m |
82,500 |
140,000 |
700 |
25% |
25% |
10.2% |
|
Mount Kenya Wildlife Estates |
326 |
0.5 |
5 |
33.0 m |
101,348 |
210,000 |
644 |
98% |
25% |
7.6% |
|
Nanyuki Homes |
250 |
0.5 |
4 |
20.0 m |
80,000 |
120,000 |
480 |
7.2% |
||
|
Swiss International Resort Mt Kenya |
200 |
0.5 |
3 |
27.5 m |
137,500 |
160,000 |
800 |
19% |
6% |
7.0% |
|
Swiss International Resort Mt Kenya |
240 |
0.5 |
4 |
35.0 m |
145,833 |
172,800 |
720 |
19% |
6% |
|
|
Swiss International Resort Mt Kenya |
262 |
0.5 |
4 |
37.5 m |
143,130 |
172,800 |
660 |
19% |
6% |
5.5% |
|
Maiyan+ SQ |
585 |
0.3 |
6 |
54.0 m |
102,273 |
191,600 |
328 |
100% |
33% |
3.8% |
|
Average |
0.4 |
113,226 |
619 |
60% |
22% |
6.8% |
||||
|
•Holiday Homes in Nyeri county and its environs have an average rental yield of 6.8% lower than areas such as Naivasha with rental yield of 8.0%, however the hospitality sector in Nyeri will record higher returns driven by the target demand from leisure tourism, business tourists and conferencing |
||||||||||
Source: Cytonn Research August 2017
Nyeri Market Summary Analysis
|
Nyeri Market Performance Summary |
||||
|
Theme |
Annual Uptake |
Occupancy Rates |
Rental Yield |
Capital Appreciation |
|
Residential |
26% |
89% |
3.9% |
4.4% |
|
Commercial Properties |
- |
83% |
13.0% |
- |
|
Site & Service |
46% |
17.3% |
||
|
Holiday Homes |
22% |
6.8% |
- |
|
|
Average |
31% |
86% |
7.9% |
10.7% |
|
· Nyeri market has an average rental yield of 7.9% and a capital appreciation of 10.7%, hence a total return of 18.6%. The Commercial properties have the highest yields at 13.0% due to high demand & occupancy rates at 83% |
||||
|
· The Residential sector has the highest occupancy rates with 89% indicating high demand for rental houses. However, the sector, lacks sufficient institutional developers with only NHC selling bungalows |
||||
|
· Of key to note is that Nyeri market is predominantly rental in the office, retail and residential sectors |
||||
Comparative Analysis
In comparison with other Counties in Kenya, Nyeri has higher rental yields for commercial properties than Mombasa, Kisumu, Nairobi and Nakuru with yields of 13.0%, 10.0% and 9.6% and 10.9%, respectively. Mombasa and Nairobi however have the highest yields at 6.0% and 5.6%, respectively, for residential sector. Nyeri and Nakuru however have low residential rental yields at 4.1% and 4.3%, respectively, in comparison to Nairobi, Mombasa and Kisumu, as the market comprises of families that prefer living in their ancestral land or own built houses in the urban centers.
Below is a summary of the analysis;
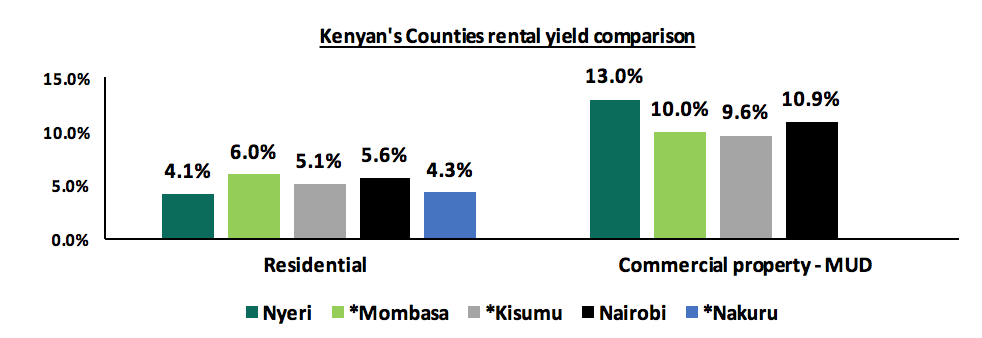
Source: Cytonn Research, * - 2016 data
Market Performance and Outlook:
|
Nyeri Market Performance and Outlook |
|||
|
Theme |
Performance (2017) |
Recommendation |
Outlook |
|
Residential |
The residential sector has total returns of 8.3% on average with rental yield of 3.9% and price appreciation of 4.4%. Residential houses sector is picking up, with most of the estates, having less than 5 years existence and recording high occupancy rates of 89% |
Focus on Standalone houses in the Upper mid end segment of the market for sale For apartments, focus on the low and mid-end segments of the market by providing apartments for rent since the market is yet to accommodate build for sale model |
|
|
Commercial Properties |
The commercial properties sector has yields of 13.0% and average occupancy of 83%. |
Nyeri lacks grade A or B offices, with most of the offices being in bad state of repair and lack lifts and still records high returns and occupancy rates, hence presents an opportunity. The markets lack formal shopping malls with key retailers being Naivas and Mathai supermarket hence a key investment opportunity into the sector |
|
|
Site and service schemes |
Site and service schemes recorded an average annual capital appreciation of 17.3% at an annual uptake of 45% |
With increased demand for residential units, and the markets embracing the tradition of building their own homes, site and service schemes present an investment opportunity in Nyeri |
|
|
Holiday Homes |
Holiday Homes in Nyeri county and its environs have an average rental yield of 6.8% assuming 100% occupancy rates |
With increased leisure tourism, business tourists and conferencing, Holiday homes presents an investment opportunity in Nyeri |
|
We have a positive outlook for the Nyeri real estate market driven by the emerging housing demand, devolution, positive demographics and improved infrastructural development. Our preferred investment areas are commercial properties - MUD, site and service schemes and in the holiday homes sector.
Disclaimer: The views expressed in this publication are those of the writers where particulars are not warranted. This publication, which is in compliance with Section 2 of the Capital Markets Authority Act Cap 485A, is meant for general information only, and is not a warranty, representation, advice or solicitation of any nature. Readers are advised in all circumstances to seek the advice of a registered investment advisor.

- Talk to us
- Kenya
- P.O Box 20695 - 00200, Nairobi, Kenya
- Cell +254709101200
- Tel +254709101200
- WhatsApp +254741676635
- United States
- +254709101200
- DOWNLOAD OUR APP
-


- Kenya
- 8th Floor, Pinetree Plaza, Kaburu Drive, Ngong Road, Nairobi, Kenya
- USA
- Suite 1150, 1775 Eye Street NW, USA, Washington DC 20006, USA
- Investments
- High Yield
- Private Equity
- Real Estate
- Real Estate
- RiverRun Estates
- Cytonn Towers
- The Ridge
- Taraji Heights
- The Alma