Understanding the Derivatives Market and Cytonn Weekly #27/2019
By Cytonn Investments, Jul 7, 2019
Executive Summary
Fixed Income
T-bills remained oversubscribed during the week, however, the overall subscription rate decreased to 133.3%, from 249.2% recorded the previous week. The continued oversubscription is attributable to favorable liquidity in the market supported by government payments. According to Kenya National Bureau of Statistics (KNBS) Q1’2019 Gross Domestic Product (GDP) report, the country’s economic activity experienced relatively slower growth, expanding by 5.6%, compared to the 6.5% growth recorded in Q1’2018, however in line with the 5-year average growth rate of 5.6%. Kenya’s current account deficit improved by 32.7% during Q1’2019, coming in at Kshs 78.8 bn, from Kshs 117.1 bn in Q1’2018, equivalent to 3.2% of GDP, from 5.2% recorded in Q1’2018. According to Stanbic Bank’s Monthly Purchasing Manager’s Index (PMI), released earlier during the week, the business environment in the country improved significantly during the month of June. The seasonally adjusted PMI came in at 54.3 in June, an improvement from 51.3 in May, and a 10-month high;
Equities
During the week, the equities market was on an upward trend with NASI, NSE 20 and NSE 25 gaining by 0.1%, 1.2%, and 0.9%, respectively, taking their YTD performance to gains/ (losses) of 7.4%, (5.3%) and 1.9%, for NASI, NSE 20 and NSE 25, respectively. Barclays Bank of Kenya (BBK) announced the sale of three of its branches, valued at Kshs 65.0 mn;
Private Equity
During the week, TLG Capital, a frontier markets investment company based in England, announced a USD 10.0 mn investment in Tanzania based PlatCorp Holdings Limited, the holding company of Platinum Credit - a Kenyan micro-finance company, through its Credit Opportunities Fund (COF). Platcorp Holdings Limited focuses on investments in its microfinance and non-banking subsidiaries. The investment will enable Platcorp to increase investments in small and medium enterprises across the East African Region. In Fundraising, Lulalend, a South African digital lender, raised USD 6.5 mn in its Series A funding, which was co-led by the International Finance Corporation (IFC) and Quona Capital, with the funding set to assist the company build its staff capacity and strengthen its balance sheet;
Real Estate
During the week, Kenya National Bureau of Statistics (KNBS) released the Quarterly Gross Domestic Product Report Q1'2019, indicating a 1.1% points decline in the real estate growth to 4.2% in Q1’2019, from 5.3% in Q1’2018, attributed to a decline in activities in the sector during the quarter. Fast food chain Big Square opened their 13th branch at Shell Service Station in Mountain View, with some of the other branches being in the Nairobi CBD, Lavington, and along Lang’ata Road;
Focus of the Week
During the week, The Nairobi Securities Exchange launched its derivatives trading market dubbed (NEXT), which will allow the trading of single stock futures as well as index futures. In the first week of trading, which started on Thursday, 4th July 2019, we saw trades of 3-month single stock futures of Safaricom, EABL and Equity Group, with the total contract value traded coming in at Kshs 130,554. In this week’s focus note, we seek to answer the following questions: (i) What are derivatives, (ii) what are the reasons for trading derivatives, (iii) Our views on how derivatives will be beneficial to investors, and (iv) the benefits to Kenya’s capital markets.
- Cytonn Real Estate, our development affiliate, will be handing over The Alma Phase 1 at a ceremony scheduled for 20th July 2019, the development has achieved 100% sales prior to handover;
- Cytonn Money Market Fund closed the week at an average yield of 11.0% p.a. To subscribe, just dial *809#;
- Beatrice Mwangi, Research Analyst, was on Metropol TV to discuss REITs, the government’s Big 4 Agenda and Kenyans investing in real estate. Watch Beatrice here;
- Phase 1 of The Alma is now 100% sold with early buyers having achieved up to 55% capital appreciation. We are now running a promotion in Phase 2: Buy a unit in Phase 2 with a 15-year payment plan and 0% deposit. For inquiries, please email us on clientservices@cytonn.com. The site is open between 8 am - 5 pm, 7-days a week for site visits;
- In line with increasing the product offering to our clients, Cytonn Asset Managers officially launched its pensions business and in addition to managing segregated funds, it has received licenses from the Retirement Benefits Authority (RBA) to offer other products including; (i) a Personal Retirement Benefits Scheme with a monthly payment platform, (ii) an Umbrella Retirement Benefits Scheme, and (iii) an Income Drawdown Fund. For more information on the pension products, email us at pensionsales@cytonn.com;
- For an exclusive tour of Cytonn’s real estate developments, visit: Sharp Investor’s Tour and for more information, email us at sales@cytonn.com;
- Following the completion and handover of Amara Ridge in Karen, we have now launched our next Karen project, dubbed Applewood, a Kshs 2.5 bn residential development located in Miotoni, Karen. This signature development shall comprise luxury homes, each sitting on 1/2 acre. We invite you to the exhibition of Applewood which is ongoing at the Amara Ridge Clubhouse (Location pin: https://goo.gl/maps/B3GVnu8pHyn) or at the Applewood Sales Centre on Miotoni Road (Location pin: https://goo.gl/maps/ZfABuGjFo1z) from 9:00 am to 5:00 pm daily. Call 0709 101 000 or email resales@cytonn.com to reserve a villa! See Video here;
- We continue to hold weekly workshops and site visits on how to build wealth through real estate investments. The weekly workshops and site visits target both investors looking to invest in real estate directly and those interested in high yield investment products to familiarize themselves with how we support our high yields. Watch progress videos and pictures of The Alma, Amara Ridge, and The Ridge;
- We continue to see very strong interest in our weekly Private Wealth Management Training (largely covering financial planning and structured products). The training is at no cost and is open only to pre-screened participants. We also continue to see institutions and investment groups interested in the training for their Teams. Cytonn Foundation, under its financial literacy pillar, runs the Wealth Management Training. If interested in our Private Wealth Management Training for your employees or investment group, please get in touch with us through wmt@cytonn.com. To view the Wealth Management Training topics, click here;
- For recent news about the company, see our news section here;
- We have 10 investment-ready projects, offering attractive development and buyer targeted returns. See further details here: Summary of Investment-Ready Projects.
Money Markets, T-Bills & T-Bonds Primary Auction:
T-bills remained oversubscribed during the week, however, the overall subscription rate decreased to 133.3%, from 249.2% recorded the previous week. The continued oversubscription is attributable to favorable liquidity in the market supported by government payments. The yields on the 91-day paper remained unchanged at 6.7%, while that of the 182-day and 364-day papers declined by 0.1% points and 0.2% points to 7.4% and 8.6%, respectively, from 7.5% and 8.8% recorded the previous week. The acceptance rate increased to 94.2%, from 52.0% recorded the previous week, with the government accepting a total of Kshs 30.1 bn of the Kshs 32.0 bn worth of bids received, higher than the weekly quantum of Kshs 24.0 bn. Investors’ participation remained skewed towards the longer-dated paper, with the continued demand being attributable to the scarcity of newer short-term bonds in the primary market. The 182-day registered improved subscription to 48.2%, from 35.2% the previous week. The subscription rates for the 91-day and 364-day papers decreased to 53.8% and 250.2% from 103.6% and 521.6% recorded the previous week, respectively.
During the week, the Kenyan Government issued its first T-Bond for the 2019/2020 fiscal year with a tenor of 15-years, issue number FXD 3/2019/15. The bond has a market-determined coupon rate and the value date set on 29th July 2019. The period of sale is from 2nd July to 23rd July 2019. We shall provide the bidding recommendation for this bond issue in our next report.
In the money markets, 3-month bank placements ended the week at 8.8% (based on what we have been offered by various banks), 91-day T-bill at 6.7%, an average of Top 10 Money Market Funds at 8.7%, with the Cytonn Money Market Fund closing the week at 11.0%.
Liquidity:
During the week, the average interbank rate declined to 2.0%, from 2.6% recorded the previous week, pointing to improved liquidity conditions in the money market supported by government payments, which offset tax remittances during the week. This saw commercial banks’ excess reserves coming in at Kshs 16.4 bn in relation to the 5.25% cash reserves requirement (CRR). The average volumes traded in the interbank market gained by 81.1% to Kshs 9.7 bn, from Kshs 5.4 bn the previous week.
Kenya Eurobonds:
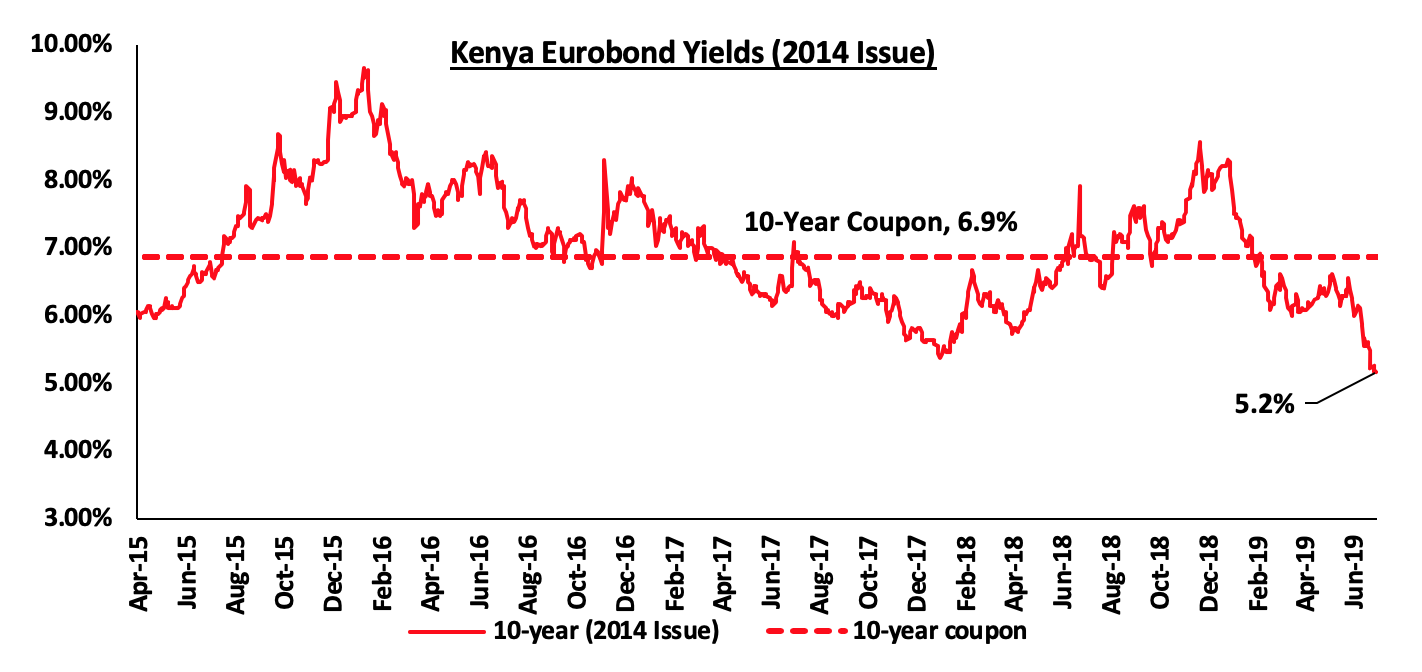
The yield on the 10-year Eurobond issued in 2014 declined by 0.3% points to 5.2%, from 5.5% recorded the previous week. The decline in yields has been attributed to increased demand for emerging market fixed-income securities following the pause by the US Fed in raising the benchmark interest rate.
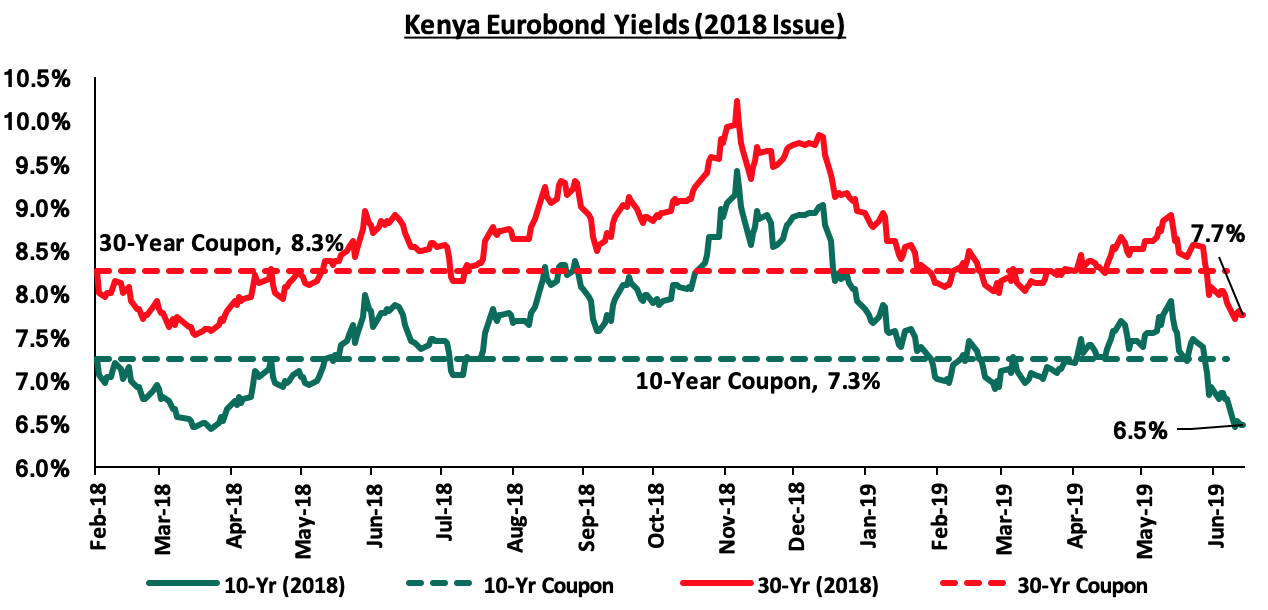
For the February 2018 Eurobond issue, yields on the 10-year and 30-year Eurobond both declined by 0.3% points and 0.2% points to 6.5% and 7.7%, respectively, from 6.8% and 7.9% recorded the previous week.
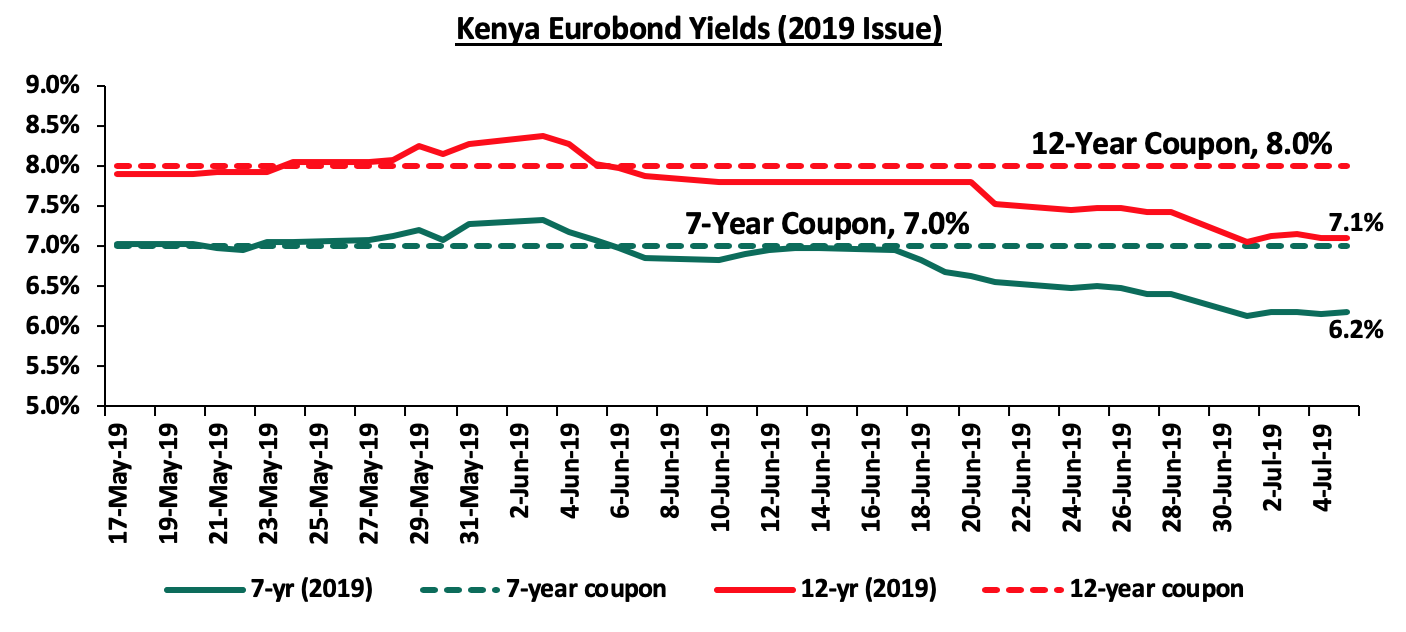
For the newly issued dual-tranche Eurobond with 7-years and 12-years tenor, priced at 7.0% for the 7-year tenor and 8.0% for the 12-year tenor, respectively, the yields on the 7-year and 12-year bond declined by 0.2% points and 0.3% points to 6.2% and 7.1%, respectively, from 6.4% and 7.4% recorded the previous week.
The Kenya Shilling:
During the week, the Kenya Shilling depreciated by 0.3% against the US Dollar to close at Kshs 102.6, from Kshs 102.3 the previous week, this was due to excess local currency liquidity in the money markets. The Kenya Shilling has appreciated by 0.5% year to date in addition to the 1.3% appreciation in 2018, and in our view, the shilling should remain relatively stable to the dollar in the short term, supported by:
- The narrowing of the current account deficit with data on balance of payments indicating continued narrowing to 3.2% of GDP in the 12-months to April 2019, from 8.9% recorded in April 2018. The decline has been attributed to the resilient performance of exports particularly horticulture and coffee, strong diaspora remittances, and higher receipts from tourism and transport services. Growth of imports also slowed mainly due to lower imports of food,
- Improving diaspora remittances, which have increased 3.8% in May 2019 to USD 1.2 bn, from USD 1.1 bn recorded in a similar period of review in 2018. The rise is due to:
- Increased uptake of financial products by the diaspora due to financial services firms, particularly banks, targeting the diaspora, and,
- New partnerships between international money remittance providers and local commercial banks making the process more convenient,
- CBK’s supportive activities in the money market, such as repurchase agreements and selling of dollars, and,
- High levels of forex reserves, currently at USD 9.0 bn (equivalent to 5.7-months of import cover), above the statutory requirement of maintaining at least 4-months of import cover, and the EAC region’s convergence criteria of 4.5-months of import cover.
Highlights of the Week
GDP Growth Q1’2019
According to Kenya National Bureau of Statistics (KNBS) Q1’2019 Gross Domestic Product (GDP) report, the country’s economic activity experienced relatively slower growth, expanding by 5.6%, compared to the 6.5% growth recorded in Q1’2018, but in line with the 5-year average growth rate of 5.6%. The table below shows differences in y/y growth of major sectors of the economy, as we seek to look at sectoral performance in Q1’2019:
|
Sector |
Contribution Q1'2018 |
Contribution Q1'2019 |
Q1'2018 Growth |
Q1'2019 Growth |
Weighted Growth Rate Q1' 2018 |
Weighted Growth Rate Q1'2019 |
Variance of Growth (% Points) |
|
Agriculture and Forestry |
26.1% |
26.3% |
7.5% |
5.3% |
2.0% |
1.4% |
(2.2%) |
|
Taxes on Products |
10.3% |
10.2% |
5.7% |
5.3% |
0.6% |
0.5% |
(0.4%) |
|
Manufacturing |
9.9% |
9.7% |
3.8% |
3.2% |
0.4% |
0.3% |
(0.6%) |
|
Real Estate |
8.2% |
8.1% |
5.3% |
4.2% |
0.4% |
0.3% |
(1.1%) |
|
Wholesale and Retail Trade |
6.8% |
6.7% |
5.9% |
5.3% |
0.4% |
0.4% |
(0.6%) |
|
Education |
6.8% |
6.7% |
4.9% |
5.4% |
0.3% |
0.4% |
0.4% |
|
Transport and Storage |
6.1% |
6.2% |
8.5% |
6.7% |
0.5% |
0.4% |
(1.8%) |
|
Financial & Insurance |
5.9% |
5.9% |
5.2% |
5.0% |
0.3% |
0.3% |
(0.2%) |
|
Construction |
5.0% |
5.0% |
6.6% |
5.6% |
0.3% |
0.3% |
(1.0%) |
|
Information and Communication |
4.0% |
4.2% |
12.5% |
10.5% |
0.5% |
0.4% |
(2.1%) |
|
Public Administration |
3.6% |
3.6% |
6.2% |
6.5% |
0.2% |
0.2% |
0.3% |
|
Electricity and Water Supply |
2.5% |
2.5% |
6.5% |
6.1% |
0.2% |
0.2% |
(0.5%) |
|
Professional Administration |
2.1% |
2.0% |
4.0% |
4.8% |
0.1% |
0.1% |
0.8% |
|
Health |
1.5% |
1.5% |
4.6% |
4.0% |
0.1% |
0.1% |
(0.6%) |
|
Accommodation & Food Services |
1.4% |
1.5% |
13.1% |
10.1% |
0.2% |
0.1% |
(3.0%) |
|
Other Services |
1.2% |
1.2% |
4.2% |
3.2% |
0.1% |
0.0% |
(1.1%) |
|
Mining and Quarrying |
1.1% |
1.1% |
2.4% |
2.2% |
0.0% |
0.0% |
(0.2%) |
|
Financial Services Indirectly Measured |
(2.4%) |
(2.3%) |
0.2% |
(3.5%) |
(0.0%) |
0.1% |
(3.7%) |
|
GDP at Market Prices |
100.0% |
100.0% |
6.5% |
5.6% |
6.5% |
5.6% |
(1.0%) |
The key take-outs from the report are:
- Slowdown in Agricultural Activities - Growth in the agricultural sector declined to 5.3% in Q1’2019, from 7.5% in Q1’2018. The slower growth in agriculture was attributed to a delay in the long rains in most parts of the country, which led to reduced agricultural production in the country,
- Slowdown in the Manufacturing Sector - The manufacturing sector recorded declines in both growth and contribution to GDP in Q1’2019. The sector recorded a growth of 3.2% in Q1’2019, compared to a growth of 3.8% in Q1’2018. The slowdown in growth was largely attributed to the decline in agro-processing activities that were subdued as a result of the delay in long rains in most parts of the country, which led to reduced agricultural production in the country, and,
- Slowdown in Real Estate Sector - The real estate sector’s performance declined to record a growth of 4.2% in Q1’2019, from a growth of 5.3% in Q1’2018. The decline in performance is a result of constrained access to financing, despite private sector credit growth rising slightly to 3.4% in February 2019 from 2.0% in February 2018, but still below the 5-year average of 11.8%.
We expect the 2019 GDP growth to slow down to a range of 5.7% - 5.9% from 6.3% in 2018, due to the delayed long rains with most parts of the country expected to experience depressed rainfall that is set to lead to a decline in agricultural production. Consequently, this will have an adverse effect on the manufacturing sector, as the major growth driver in the sector is agro-processing. For a more comprehensive analysis see the Q1’2019 Quarterly GDP Review and Outlook Note.
Balance of Payments & Current Account Q1’2019
Kenya’s current account deficit improved by 32.7% during Q1’2019, coming in at Kshs 78.8 bn, from Kshs 117.1 bn in Q1’2018, equivalent to 3.2% of GDP, from 5.2% recorded in Q1’2018. This was mainly driven by:
- The 89.6% increase in the services trade balance to Kshs 60.7 bn, from Kshs 32.0 bn,
- A 3.8% decline in the merchandise trade deficit to Kshs 239.0 bn, from Kshs 248.3 bn in Q1’2018, and,
- The 14.6% rise in the secondary income (transfers) balance, to Kshs 128.5 bn, from Kshs 112.2 bn in Q1’2018.
The table below shows the breakdown of the various current account components, comparing Q1’2018 and Q1’2019:
all figures in Kshs bns unless stated otherwise
|
Q1’2019 Current Account Balance |
|||
|
Item |
Q1'2018 |
Q1'2019 |
% Change |
|
Merchandise Trade Balance |
(248.3) |
(239.0) |
(3.8%) |
|
Services Trade Balance |
32.0 |
60.7 |
89.6% |
|
Primary Income Balance |
(13.0) |
(29.1) |
124.3% |
|
Secondary Income (Transfers) Balance |
112.2 |
128.5 |
14.6% |
|
Current Account Balance |
(117.1) |
(78.8) |
(32.7%) |
|
GDP at Current Prices (Q1’2019 Quarterly GDP Report by KNBS) |
2,239.0 |
2,489.3 |
11.2% |
|
Current Account Balance as a % of GDP |
(5.2%) |
(3.2%) |
(2.1%) |
Key take-outs from the table include:
- The secondary income/transfers surplus increased by 14.6% to Kshs 128.5 bn, from Kshs 112.2 bn in Q1’2018, driven by various factors such as diaspora remittances, which recorded a 2.9% increase to Kshs 67.9 bn, from Kshs 65.9 bn recorded in Q1’2018,
- The merchandise trade deficit contracted by 3.8% to Kshs 239.0 bn, from Kshs 248.3 bn in Q1’2018, driven by a 3.4% decline in merchandise imports to Kshs 397.1 bn, from Kshs 411.3 bn in Q1’2018. This improvement was however impeded by a 2.9% decline in merchandise exports to Kshs 158.2 bn from Kshs 162.9 bn recorded in a similar period in 2018. The decline in the merchandise imports was mainly on account of declines in the value of maize, iron and steel imports by 82.4% and 15.8% to Kshs 1.1 bn and Kshs 22.4 bn, respectively,
- In terms of exports by region, Africa remained the largest merchandise export destination with 34.1% of the total exports valued at Kshs 53.4 bn, a 1.1% decline from Q1’2018 total exports of Kshs 54.0 bn. The European region accounted for 25.6% of total exports, valued at Kshs 40.1 bn, a 6.6% increase from the Kshs 37.6 bn recorded in Q1’2018. Similarly, exports to the United States of America rose by 31.9% to Kshs 12.2 bn, from Kshs 9.3 bn in Q1’2018,
- In terms of imports by region, the European Union accounted for 15.7% of total imports in Q1’2019, valued at Kshs 66.0 bn, a 27.4% increase from the Kshs 51.8 bn recorded in Q1’2018. Asia was the largest merchandise import source, accounting for 61.2%, with the value of imports decreasing by 3.9% to Kshs 421.2 bn, from Kshs 438.5 bn recorded in Q1’2018. The decline was attributed to a decrease in imports from Malaysia (25.1%), India (22.9%), China (12.4%) and Japan (11.1%). Commodities that recorded marked reductions in import values from China included railway wagons and light emitting diodes, and,
- As a result of the decline in the merchandise trade deficit, the increase in the services trade balance, and the increase in the secondary income balance, the current account deficit improved faster than the growth in GDP at current prices, resulting in the current account deficit improving to 3.2% of GDP, down from 5.2% recorded in Q1’2018.
For a more comprehensive analysis see the Q1’2019 Quarterly Balance of Payments Note
Purchasing Manager’s Index
According to Stanbic Bank’s Monthly Purchasing Manager’s Index (PMI), released earlier during the week, the business environment in the country improved significantly during the month of June. The seasonally adjusted PMI came in at 54.3 in June, an improvement from 51.3 in May, and a 10-month high. A PMI reading of above 50 indicates improvements in the business environment, while a reading below 50 indicates a worsening outlook. Firms showed sharp increases in new orders during the month from both domestic and external markets. Some attributed the growth to easing of cash-flow issues, leading to sales growing at the fastest rate in the year so far. Output levels expanded during the month to a five-month high that consequentially leads to an increase in staff numbers. The increased growth through the month led companies to raise input purchases. This placed extra pressure on suppliers resulting in shortened delivery times. Purchasing costs rose significantly as a result of inflationary effects such as higher taxes, increased input demand, and fuel hikes. Overall, input costs continued to rise steeply forcing some companies to raise output charges in an effort to maintain profit levels. In line with our expectations, the PMI index reflects the upbeat sentiment from businesses as the government continues to settle its arrears, resulting in improved cash-flows. We expect the trend to continue considering the Kenyan President’s directive to ensure consignments are cleared faster at the port going forward, accompanied with the proposal in the 2019/2020 Budget that all government suppliers should be paid within 60-days.
Rates in the fixed income market have remained relatively stable as the government rejects expensive bids. A budget deficit is likely to result from depressed revenue collection with the revenue target for FY’2019/2020 at Kshs 2.1 tn, creating uncertainty in the interest rate environment as additional borrowing from the domestic market goes to plug the deficit. Despite this, we do not expect upward pressure on interest rates due to increased demand for government securities, driven by improved liquidity in the market owing to the relatively high debt maturities. Our view is that investors should be biased towards medium-term fixed income instruments to reduce duration risk associated with long-term debt, coupled with the relatively flat yield curve on the long-end due to saturation of long-term bonds.
Market Performance
During the week, the equities markets was on an upward trend with NASI, NSE 20 and NSE 25 gaining by 0.1%, 1.2%, and 0.9%, respectively, taking their YTD performance to gains / (losses) of 7.4%, (5.3%) and 1.9%, for NASI, NSE 20 and NSE 25, respectively. The performance in NASI was driven by gains in KCB Group, Equity Group, Co-op Bank, and BAT, which gained by 4.6%, 2.7%, 2.1%, and 1.0%, respectively.
Equities turnover declined by 22.6% during the week to USD 20.9 mn, from USD 26.9 mn the previous week, taking the YTD turnover to USD 791.2 mn. Foreign investors remained net sellers for the week, with the net selling position increasing by 185.4% to USD 4.9 mn, from USD 2.5 mn the previous week.
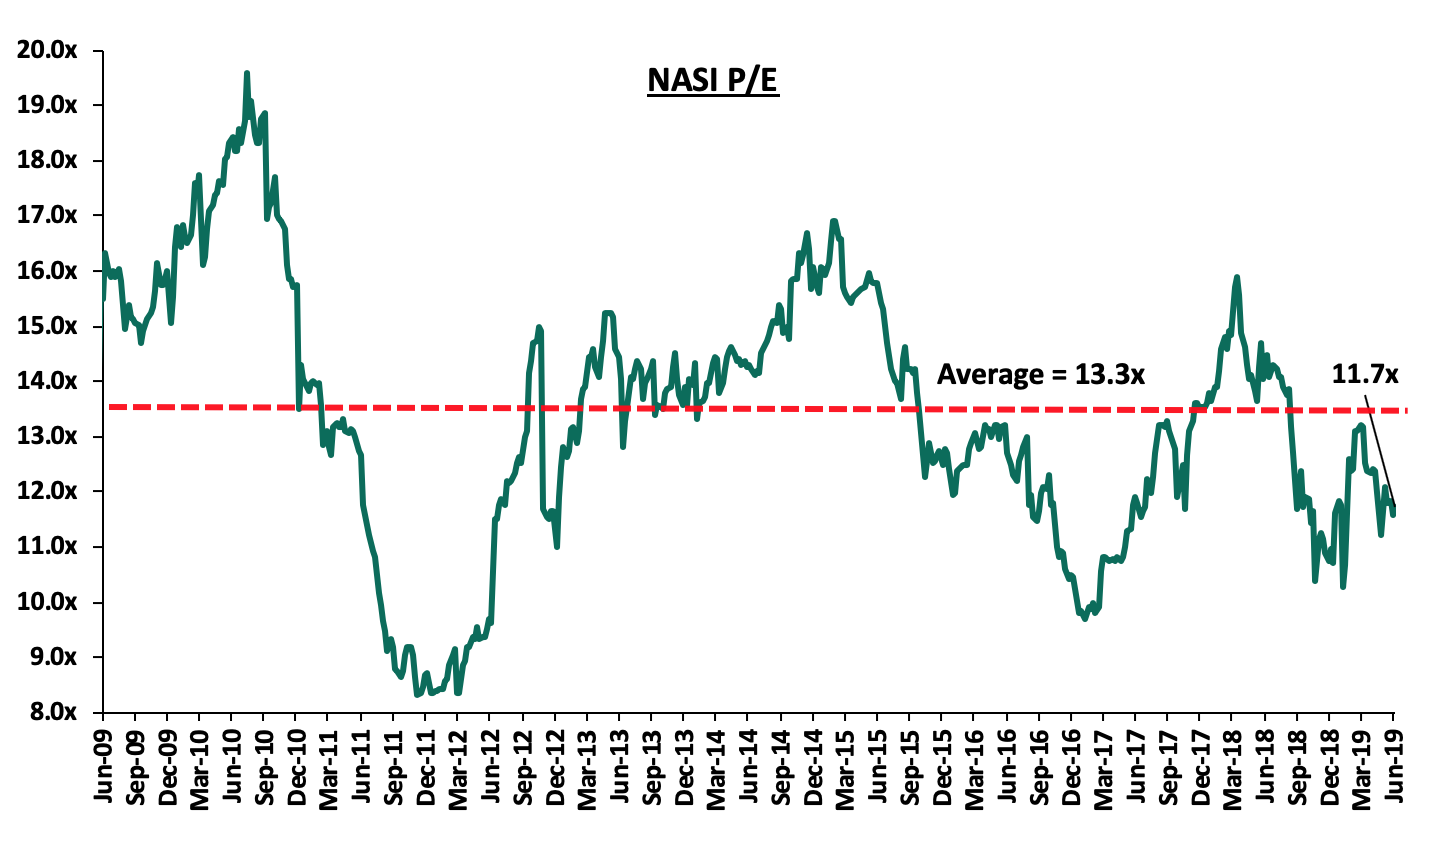
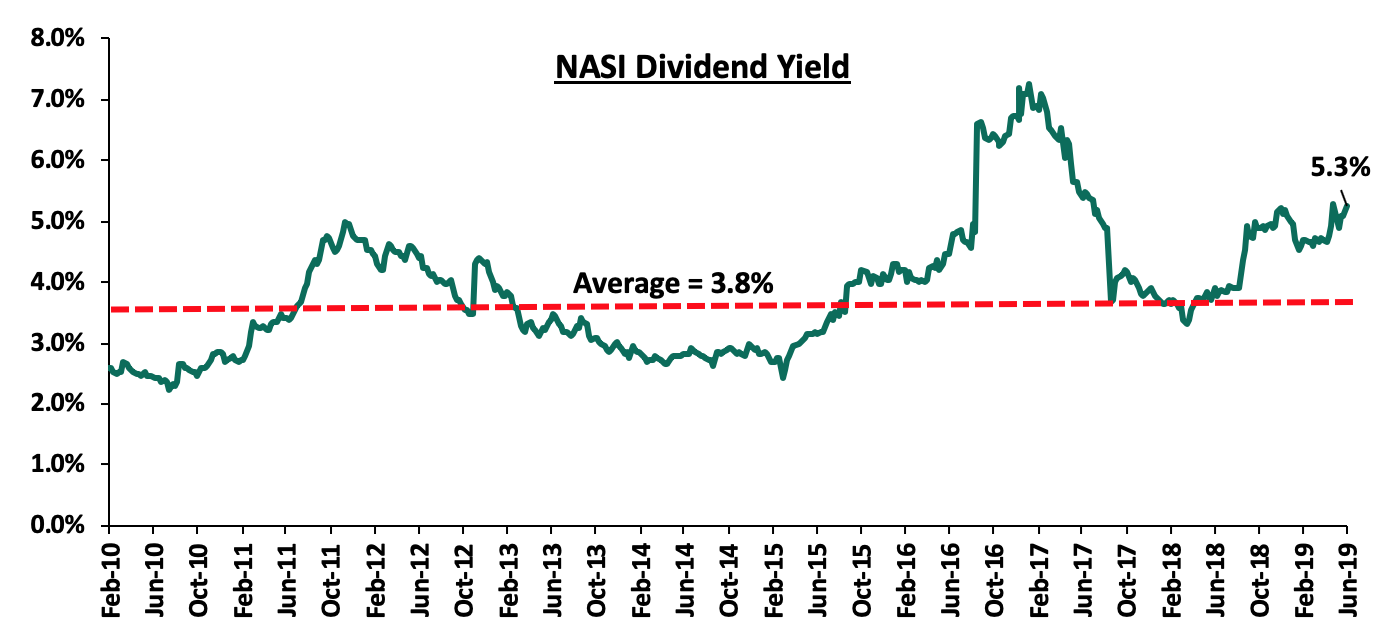
The market is currently trading at a price to earnings ratio (P/E) of 11.7x, 3.2% below the historical average of 13.3x, and a dividend yield of 5.3%, 1.5% points above the historical average of 3.8%. With the market trading at valuations below the historical average, we believe there is value in the market. The current P/E valuation of 11.6x is 19.4% above the most recent trough valuation of 9.7x experienced in the first week of February 2017, and 39.4% above the previous trough valuation of 8.3x experienced in December 2011. The charts below indicate the historical P/E and dividend yields of the market.
Weekly Highlights
During the week, Barclays Bank of Kenya announced that three of its branches namely, Bamburi, Maragua and Supplies, were up for sale, valued at Kshs 65.0 mn. This is in line with the lender’s strategy of deepening digital channels to accommodate the changing pattern of customer preferences towards alternate channels. Previously, in FY’2017, the lender closed 13 branches as part of its consolidation strategy and drive to achieve operational efficiencies. The branch rationalization measures resulted in the bank closing the financial year FY’2018 with 85 branches from the 121 it owned in FY’2016. The lender has been implementing structural cost programs to cut costs through innovation and staff restructuring besides branch rationalization. In FY’2017, staff restructuring saw 323 staff exit the bank as part of the rationalization process that saw the closure of 13 branches. Furthermore, in FY’2018, the bank conducted a voluntary staff exit scheme that saw 78 full-time staff leave. In FY’2018, the bank reported enhanced digital channel capabilities with transactions processed outside the branch rising to 70.0% in FY’2018, from 65.0% in FY’2017. As a result of these measures, the bank reported a decline in its Cost to Income Ratio (CIR) by 4.0% points to 51.0% in FY’2018, from 55.0% in FY’2017, adjusted for one-off restructuring investments and separation costs incurred. The wave of branch rationalizations and staff restructuring in the wake of digitization has spread over the local banking industry, and as a result, the sector reported an improvement in operating efficiency as the CIR declined to 57.3% in FY’2018, from 61.1% in FY’2017, amid cost rationalization measures such as branch closures, staff layoffs in voluntary retirement plans and digitization strategies aimed at reducing operational costs. We continue to expect increased adoption of technology to aid in improving efficiency and diversifying revenue. Therefore, revenue growth coupled with cost containment will continue to boost the sustainable growth of the banking sector.
Universe of Coverage
Below is a summary of our SSA universe of coverage:
|
Banks |
Price as at 28/06/2019 |
Price as at 05/07/2019 |
w/w change |
YTD Change |
Target Price |
Dividend Yield |
Upside/Downside |
P/TBv Multiple |
Recommendation |
|
Diamond Trust Bank |
117.8 |
116.0 |
(1.5%) |
(25.9%) |
228.4 |
2.2% |
96.1% |
0.6x |
Buy |
|
CRDB |
110.0 |
110.0 |
0.0% |
(26.7%) |
207.7 |
0.0% |
88.8% |
0.4x |
Buy |
|
UBA Bank |
6.2 |
6.1 |
(2.4%) |
(21.4%) |
10.7 |
13.7% |
86.3% |
0.4x |
Buy |
|
Zenith Bank |
19.8 |
19.3 |
(2.5%) |
(16.3%) |
33.3 |
13.6% |
81.9% |
0.9x |
Buy |
|
KCB Group*** |
38.3 |
40.0 |
4.6% |
6.8% |
60.4 |
9.2% |
67.1% |
1.0x |
Buy |
|
GCB Bank |
4.9 |
4.9 |
0.2% |
7.4% |
7.7 |
7.7% |
64.3% |
1.2x |
Buy |
|
I&M Holdings |
55.0 |
59.5 |
8.2% |
40.0% |
81.5 |
6.4% |
54.5% |
1.0x |
Buy |
|
Access Bank |
6.5 |
6.6 |
1.5% |
(2.9%) |
9.5 |
6.2% |
52.3% |
0.4x |
Buy |
|
Co-operative Bank |
12.0 |
12.3 |
2.1% |
(14.3%) |
17.1 |
8.3% |
50.4% |
1.0x |
Buy |
|
Equity Group |
39.0 |
40.0 |
2.7% |
14.8% |
53.7 |
5.1% |
42.9% |
1.7x |
Buy |
|
NIC Group |
30.6 |
30.3 |
(1.1%) |
8.8% |
42.5 |
3.3% |
42.2% |
0.6x |
Buy |
|
CAL Bank |
1.0 |
1.0 |
0.0% |
2.0% |
1.4 |
0.0% |
40.0% |
0.8x |
Buy |
|
Barclays Bank |
10.5 |
10.3 |
(1.9%) |
(6.4%) |
12.8 |
10.5% |
33.0% |
1.3x |
Buy |
|
Stanbic Bank Uganda |
29.0 |
29.0 |
0.0% |
(6.5%) |
36.3 |
4.0% |
29.1% |
2.1x |
Buy |
|
SBM Holdings |
5.6 |
5.5 |
(1.1%) |
(7.4%) |
6.6 |
5.4% |
22.9% |
0.8x |
Buy |
|
Stanbic Holdings |
99.0 |
100.0 |
1.0% |
10.2% |
113.6 |
5.9% |
20.6% |
1.1x |
Buy |
|
Guaranty Trust Bank |
32.9 |
29.4 |
(10.8%) |
(14.8%) |
37.1 |
7.3% |
20.1% |
2.1x |
Buy |
|
Ecobank |
9.0 |
7.6 |
(16.1%) |
0.7% |
10.7 |
0.0% |
19.2% |
2.0x |
Accumulate |
|
Union Bank Plc |
7.0 |
6.9 |
(1.4%) |
23.2% |
8.2 |
0.0% |
16.4% |
0.7x |
Accumulate |
|
Standard Chartered |
194.5 |
194.0 |
(0.3%) |
(0.3%) |
200.6 |
6.4% |
9.6% |
1.4x |
Hold |
|
Bank of Kigali |
290.0 |
274.0 |
(5.5%) |
(8.7%) |
299.9 |
4.8% |
8.2% |
1.6x |
Hold |
|
FBN Holdings |
6.6 |
6.3 |
(4.6%) |
(21.4%) |
6.6 |
3.8% |
5.0% |
0.4x |
Hold |
|
Bank of Baroda |
128.7 |
127.8 |
(0.7%) |
(8.7%) |
130.6 |
1.9% |
3.4% |
1.1x |
Lighten |
|
Standard Chartered |
19.0 |
19.3 |
1.2% |
(8.3%) |
19.5 |
0.0% |
2.3% |
2.4x |
Lighten |
|
National Bank |
4.1 |
4.1 |
(1.0%) |
(22.9%) |
3.9 |
0.0% |
(4.8%) |
0.2x |
Sell |
|
Stanbic IBTC Holdings |
40.3 |
40.3 |
0.0% |
(16.1%) |
37.0 |
1.5% |
(6.6%) |
2.1x |
Sell |
|
Ecobank Transnational |
11.0 |
9.9 |
(10.0%) |
(41.8%) |
9.3 |
0.0% |
(15.6%) |
0.4x |
Sell |
|
HF Group |
4.0 |
4.0 |
0.0% |
(27.6%) |
2.9 |
0.0% |
(27.7%) |
0.2x |
Sell |
|
*Target Price as per Cytonn Analyst estimates **Upside / (Downside) is adjusted for Dividend Yield ***Banks in which Cytonn and/or its affiliates are invested in ****Stock prices indicated in respective country currencies |
|||||||||
We are “Positive” on equities for investors as the sustained price declines have seen the market P/E decline to below its historical average. We expect increased market activity, and possibly increased inflows from foreign investors, as they take advantage of the attractive valuations to support the positive performance.
Earlier in the week, TLG Capital, a frontier markets investment company based in England, announced a USD 10.0 mn investment in Tanzania based Platcorp Holdings Limited, the holding company of Platinum Credit - a Kenyan micro-finance company, through its Credit Opportunities Fund (COF). Platcorp Holdings Limited focuses on investments in its microfinance and non-banking subsidiaries. Platcorp initially focused on providing microfinance services to civil servants across the East Africa Region but has diversified to providing services to individuals outside the governments’ payroll with various products, asset-financing and traditional products such as group loans and SME lending. The debt-financing will enable Platcorp to increase its investment footprint in small and medium-sized companies across the East Africa Region.
Other notable institutional investors in PlatCorp Holdings limited include:
|
Year |
Company |
Country |
Amount |
Status |
|
2019 |
Swedfund |
Sweden |
USD 10.0 mn |
Active |
|
2018 |
Suzerian Investment Holding |
U.S |
Undisclosed |
Active |
|
2013 |
Cassia Capital |
Kenya |
Undisclosed |
Exited |
|
2012 |
Centum Investments |
Kenya |
USD 8.0 mn |
Exited |
This investment will add on to TLG Capital’s portfolio of investments in Sub-Saharan Africa, which is in line with the firm’s investment strategy to target the sectors underpinned by the rise of the African consumer, namely financial services, consumer goods, real estate, and healthcare. Some of the notable investments the company has made through its COF fund in the financial services and real estate sectors including:
|
Year |
Company |
Country |
Amount |
Sector |
|
2018 |
Union Bank |
Nigeria |
USD 10.0 mn |
Financial Services |
|
2018 |
Atlas-Mara |
Pan-Africa |
USD 10.0 mn |
Financial Services |
|
2015 |
MyBucks |
Pan-Africa |
USD 40.5 mn |
Micro-finance |
|
2009 |
Roselyn Heights |
Kenya |
Undisclosed |
Real Estate |
Source: TLG Capital website
TLG Capital has made several exits from the Sub-Saharan market, with some of the notable exits include:
|
Year |
Company |
Country |
Amount |
Sector |
|
2016 |
GetBucks |
Pan-Africa |
USD 25.0 mn |
Microfinance |
|
2015 |
NMB Bank Limited |
Zimbabwe |
USD 10.0 mn |
Financial Services |
|
2014 |
Iroko Securities |
Pan-Africa |
Undisclosed |
Financial Services |
|
2014 |
Tres Vista Financial Services |
Pan-Africa |
Undisclosed |
Financial Services |
Source: TLG Capital website
In Fundraising, Lulalend, a South African digital lender, raised USD 6.5 mn in its Series A round funding, which was co-led by the International Finance Corporation (IFC) and Quona Capital. The startup, based in Cape Town, provides short-term loans to small and medium-sized businesses (SMEs) that are often unable to obtain working capital. The funds raised will be used to build its staff capacity and strengthen its balance sheet, in order to provide financing to more SMEs in South Africa by expanding its loan book to USD 100.0 mn.
Lulalend, established in 2014, had an earlier seed stage round of funding in October 2016 which raised an undisclosed amount of funds. The seed stage round of funding was led by Accion Venture Lab, the investment vehicle for financial inclusion leader Accion, based in the U.S with participation from Newid Capital, an impact investing firm focused on early-stage Financial Services companies in emerging markets, and Hallman Holding International Investment GmbH, an Austrian real estate and investment company.
In our view, the continued investments in FinTech by international organizations point to the growing need for financial services among the unbanked in Sub-Saharan Africa. We expect investments in the FinTech sector to continue as technology companies offer better cost efficiency and the customer experience in providing financial services.
Private equity investments in Africa remains robust as evidenced by the increasing investor interest, which is attributed to; (i) rapid urbanization, a resilient and adapting middle class and increased consumerism, (ii) the attractive valuations in Sub Saharan Africa’s private markets compared to its public markets, (iii) the attractive valuations in Sub Saharan Africa’s markets compared to global markets, and (iv) better economic projections in Sub Sahara Africa compared to global markets. We remain bullish on PE as an asset class in Sub-Sahara Africa. Going forward, the increasing investor interest and a stable macroeconomic environment will continue to boost deal flow into African markets.
- Industrial Reports
During the week, Kenya National Bureau of Statistics released the Quarterly Gross Domestic Product Report Q1'2019, indicating a decline in performance, with the economy expanding by 5.6%, 0.9% points lower than the 6.5% growth recorded in Q1’2018. The key take-outs for the real estate sector were as follows;
- The construction sector’s contribution to GDP remained constant at 5.2% in Q1’2019, similar to Q1’2018, while recording a 1.0% point decline in growth rate from 6.6% in Q1’2018 to 5.6% in Q1’2019, attributable to a decline in real estate activities, in addition to government slowdown on infrastructural developments. Despite the decline, the sector growth was supported by the continued construction of the second phase of the Standard Gauge Railway (SGR) and other public infrastructural developments, especially road construction,
- The slowdown in construction activities was evidenced through a 3.1% decline in cement consumption and a 1.0% decline in credit advanced to the construction sector during the quarter under review, and,
- The real estate sector contribution to GDP decreased marginally by 0.1% points, from 8.4% in Q1’2018 to 8.3% in Q1’2019, while the growth rate of the sector declined by 1.1% points to 4.2% in Q1’2019, from 5.3% in Q1’2018, attributed to a decline in activities in the sector during the quarter.
The graph below shows the growth of the construction and real estate sectors over the years:
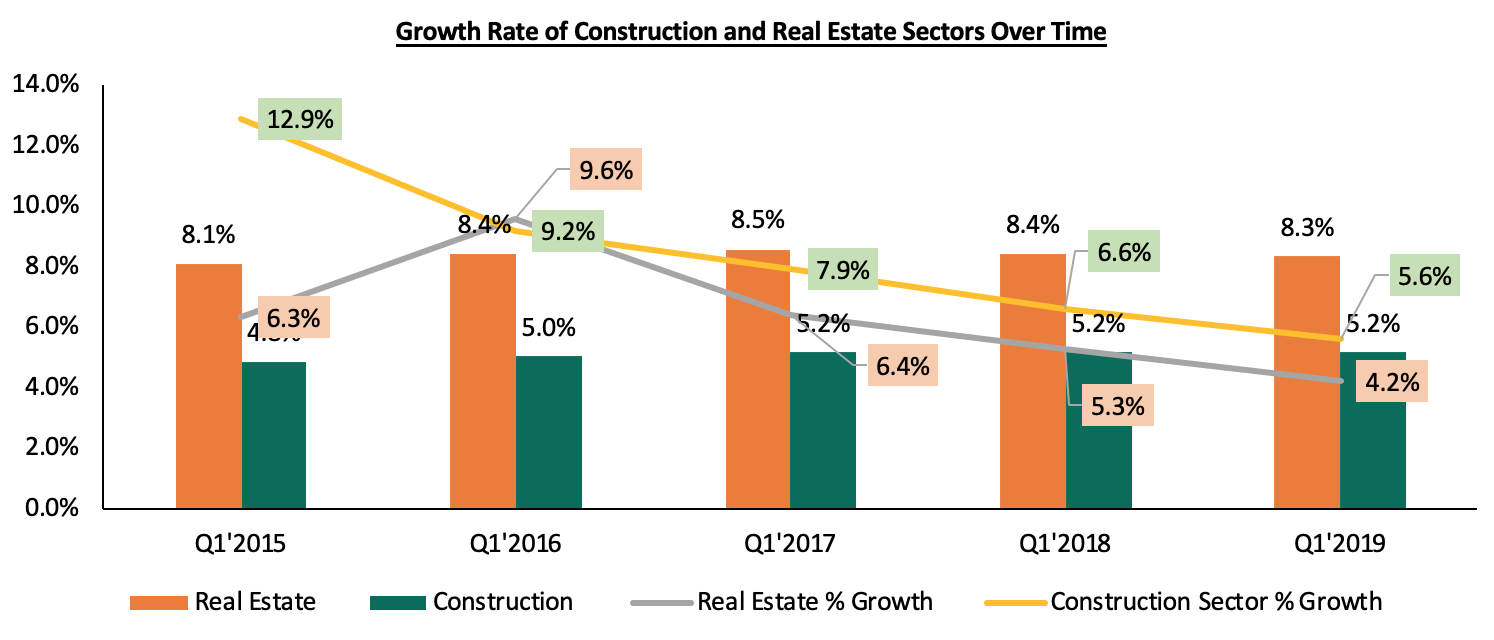
Source: Kenya National Bureau of Statistics (KNBS)
- In hospitality, the contribution of the accommodation and food service activities to GDP recorded a 0.1% points increase to 1.6%, from 1.5% in Q1’2018, despite the sector recording reduced growth by 3.0% points to 10.1% in the Q1’2019, from 13.1% in Q1’2018. We attribute the decline in growth of the sector to an estimated 0.5% decline in tourist arrivals through Jomo Kenyatta International Airport and Moi International Airport from 0.236 mn arrivals in Q1’2018 to 0.235 mn during a similar period in 2019. However, the sector continues to expand supported by; (i) the recognition of Nairobi as a regional hub, (ii) the improving air travel in the country, and (iii) political stability.
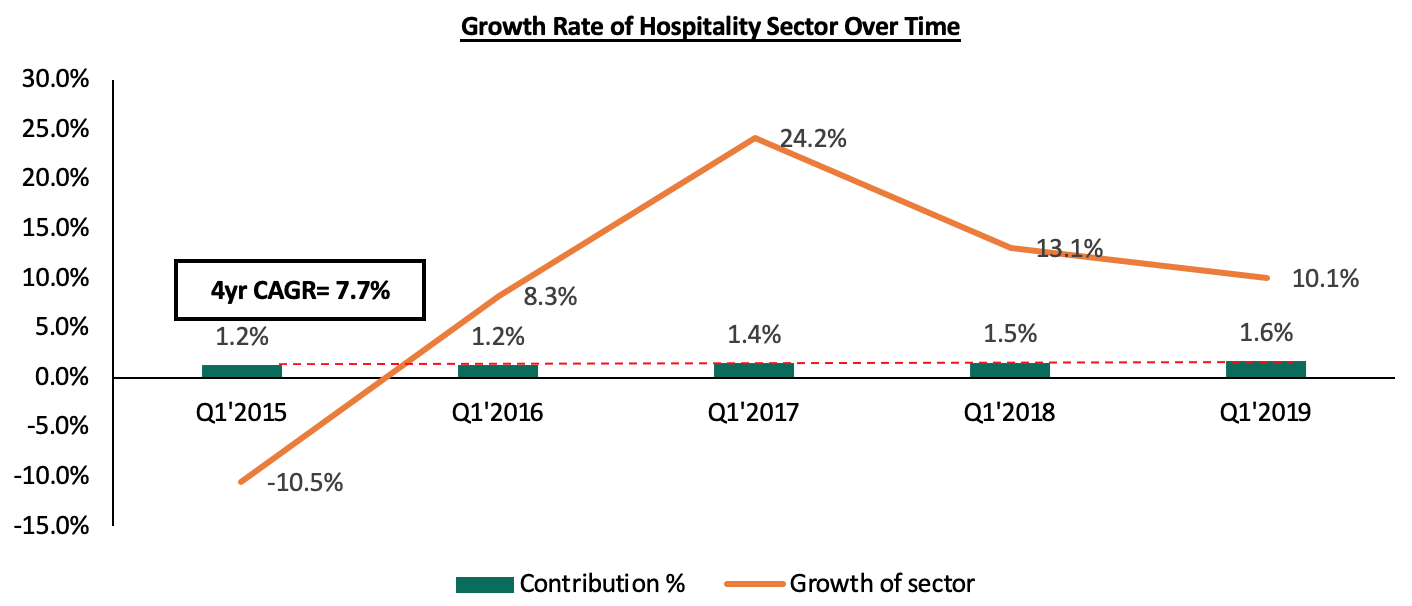
Source: Kenya National Bureau of Statistics
The above statistics are in line with our Cytonn Q1’2019 Market Review, which highlighted a slowdown in the real estate sector during the quarter, with sectors such as office and retail registering a decline in rental yields by 0.1% points and 0.5% points, to 8.0% and 8.5% from 8.1% and 9.0%, respectively in FY’2018, while the residential sector recorded 0.5% annualized price appreciation, 3.7% points lower than 4.2% in FY’2018. The performance was constrained by; (i) limited access to financing by developers and end users, with private sector credit growth coming in at 4.9% in April 2019, compared to a 5-year (2014-2019) average of 12.4%, and (ii) increased supply in selected sectors such as the commercial office and retail sectors with a surplus of 5.3 mn SQFT and 2.0 mn SQFT, respectively, as at 2018.
We, however, expect the trend to reverse driven by; (i) continued National Government support for the affordable housing initiative, (ii) the continued infrastructural improvement, which is opening up new areas for development, and (iii) the improving macroeconomic environment.
- Residential Sector
Indian firm, Shapoorji Real Estate (SPRE) and UK equity investor-developer Actis, is set to begin development of a 624-units, middle-class, residential development on a 4.5-acre parcel of land at the Garden City Mall, along Thika Road. The construction of the first phase of the project, dubbed Mida Vida Homes, is set to commence in Q3’2019. The phase will consist of 208 units, of 1, 2- and 3-bedroom units, priced at Kshs 6 mn, Kshs 9 mn and Kshs 14 mn, respectively. However, key to note, the unit sizes are yet to be disclosed. For more details on the joint venture structure of the project, see Cytonn Weekly#10/2019.
Thika Road hosts a large, young and working population and we thus expect the project to contribute in meeting the large housing deficit mainly among the middle and low-income earners in Kenya. In terms of performance, the area, which is covered under Thome submarket, recorded total returns of 6.7% in 2018, compared to the market average of 8.8%, according to Cytonn Research. We attribute the relatively poor performance to the low rental prices charged in the area at approximately Kshs 297 per SQM, compared to the market average of Kshs 423 per SQM.
The table below shows the performance of the lower- mid-end suburbs in Nairobi:
|
Nairobi Metropolitan Area Apartments Performance - Lower Mid End Suburbs |
||||||
|
Submarket |
Average Price Per SQM |
Average Rent Per SQM |
Average Annual Sales(%) |
Average Rental Yield(%) |
Average Price Appreciation(%) |
Average Total Returns(%) |
|
Upper Kabete |
86,344 |
429 |
27.4% |
6.3% |
5.6% |
11.9% |
|
South B & C |
107,819 |
510 |
26.5% |
5.7% |
4.4% |
10.1% |
|
Donholm & Komarock |
75,072 |
374 |
20.3% |
6.0% |
3.9% |
9.9% |
|
Ngong Road |
99,630 |
453 |
25.6% |
5.9% |
4.0% |
9.9% |
|
Imara Daima |
74,232 |
381 |
26.2% |
6.3% |
3.0% |
9.4% |
|
Kahawa West |
82,166 |
416 |
22.9% |
6.2% |
1.8% |
8.1% |
|
Dagoretti |
98,038 |
482 |
22.5% |
6.2% |
1.7% |
7.8% |
|
Thome |
124,554 |
297 |
22.3% |
2.8% |
3.9% |
6.7% |
|
Langata |
107,374 |
462 |
23.2% |
5.3% |
0.3% |
5.6% |
|
Average |
95,025 |
423 |
24.1% |
5.6% |
3.2% |
8.8% |
|
||||||
Source: Cytonn Research 2018
- Retail Sector
Kenya’s retail sector has been vibrant over the past few years, attracting interest from renowned international retailers as well as the robust expansion of local retailers. In line with this, during the week, fast food chain Big Square, opened their 13th branch at Shell Service Station in Mountain View, with some of the other branches being in the Nairobi CBD, Lavington and along Lang’ata Road. The South African owned eatery joins other food chains such as KFC and Java Coffee that have continued to expand their footprint in the Kenyan market. This continued expansion by retailers is supported by;
- Increased disposable income because of an expanding middle class thus creating demand for high-end restaurants and casual dining areas. According to KNBS Economic Survey 2019, private consumption expenditure recorded a growth of 5.9% in 2018, 0.4% points higher than the previous 4 year average growth of 5.5%,
- A positive demographic dividend, with a population growth rate of approximately 2.6% p.a. and a rapid urbanization rate of 4.3%, in comparison to the global 1.2% and 2.1%, respectively, hence an increase in demand for restaurants, and,
- Stable economic growth, with Kenya’s GDP growth coming in at 5.6% in Q1’2019, thus, creating an enabling environment for the retailers to make desirable profits.
In our view, the Mountain View area, which is located along Waiyaki Way, presents a viable opportunity for the business as it hosts high to middle-income earners with high purchasing power, which will sustain demand from the restaurant’s target market. The continued expansion of Big Square and other restaurants such as Java and KFC in Nairobi will result in increased uptake of retail real estate developments thus improving the overall performance of the sector. For investors in retail real estate, with an average rent of Kshs 209 per SQFT, retail space in Westlands Submarket, under which Mountain View area is covered, records a high yield of 12.0%, 3.8% points higher than the market average of 8.2%, with an average occupancy rate of 89.0% compared to the market average of 75.6%. This, therefore, portrays Westlands as a viable investment destination for both retailers and retail real estate developers. The table below shows a summary of the Nairobi retail market performance in H1’2019:
|
Summary of Nairobi’s Retail Market Performance H1’ 2019 |
|||||||||
|
Location |
Rent Kshs/SQFT H1’ 2019 |
Occupancy H1’ 2019 |
Rental Yield H1’ 2019 |
Rent Kshs/SQFT FY’ 2018 |
Occupancy FY’ 2018 |
Rental Yield FY’ 2018 |
H1’ 2019 ∆ in Rental Rates |
H1’ 2019 ∆ in Occupancy (% points) |
H1’ 2019 ∆ in Rental Yield (% points) |
|
Westlands |
209 |
89.0% |
12.0% |
219 |
82.2% |
12.2% |
(4.7%) |
6.8% |
(0.2%) |
|
Kilimani |
173 |
91.4% |
10.5% |
167 |
97.0% |
10.7% |
3.6% |
(5.6%) |
(0.2%) |
|
Ngong Road |
171 |
87.5% |
9.3% |
175 |
88.8% |
9.7% |
(2.3%) |
(1.3%) |
(0.4%) |
|
Karen |
219 |
71.8% |
8.8% |
225 |
88.8% |
11.0% |
(2.5%) |
(17.0%) |
(2.2%) |
|
Eastlands |
145 |
74.2% |
7.5% |
153 |
64.8% |
6.8% |
(5.6%) |
9.4% |
0.7% |
|
Kiambu Road |
169 |
65.3% |
7.3% |
183 |
69.5% |
8.1% |
(7.6%) |
(4.2%) |
(0.8%) |
|
Thika road |
168 |
66.5% |
6.8% |
177 |
75.0% |
8.3% |
(5.4%) |
(8.5%) |
(1.5%) |
|
Mombasa road |
144 |
65.5% |
6.3% |
162 |
72.4% |
7.9% |
(10.7%) |
(6.9%) |
(1.6%) |
|
Satellite Towns |
129 |
69.2% |
5.7% |
142 |
73.7% |
6.7% |
(9.2%) |
(4.5%) |
(1.0%) |
|
Average |
170 |
75.6% |
8.2% |
178 |
79.1% |
9.0% |
(4.9%) |
(3.5%) |
(0.8%) |
|
|||||||||
Source: Cytonn Research
We maintain a neutral outlook for the real estate sector supported by; (i) the continued entry and expansion of local and international retailers, (ii) the improving infrastructure, (iii) positive demographics and (iv) a stable economic environment. The investment opportunity in the sector lies in areas such as Westlands for the retail sector, with relatively high rental yields of 12.0%, differentiated concepts for the commercial office sector, that is serviced offices which have continued to record relatively high rental yields of 13.4% on average, and the serviced apartments for the hospitality sector with average rental yields of 7.4%. For the residential sector, the investment opportunity lies in the lower mid-end sectors, which continue to exhibit fast growing demand from the majority of Kenyans seeking to buy affordable homes amidst a tough financial environment.
The Nairobi derivatives market began trading on Thursday 4th July 2019, with the purchase of three single stock futures contracts. This follows the successful completion of a six-month Derivatives Exchange Pilot Test between July and December 2018. This venture will make the Nairobi Securities Exchange (NSE) the second exchange in Sub-Saharan Africa to introduce derivatives trading after the Johannesburg Stock Exchange (JSE) in South Africa.
In this week’s note, we shall discuss financial derivatives, highlighting the following:
- Background of Financial Derivatives,
- Nairobi Securities Exchange Derivatives Market (NEXT),
- African Case Study: South Africa’s Derivatives Market, and,
- Our Views, Expectations, and Conclusion.
Section I: Background of Financial Derivatives
A derivative is a financial contract whose value is derived/reliant on the value of an underlying asset, hence why it is called a “derivative” contract. The underlying asset may be a commodity, bond, equity, interest rate, market index, currency or real estate. There are five main types of financial derivatives, which are structured as contracts between parties:
- Forward Contract: This is a financial contract that can be customized to a specific commodity, a specific quantity of the commodity and agreed-upon delivery date at a future point in time. As such, this is where the buyer can purchase an asset, and the seller can sell the asset, at a set price at a future point in time. These contracts are private agreements between two parties and thus they do not trade on an exchange.
- Options Contract: This type of derivative gives the holder of the option contract the right but not the obligation to buy/sell the underlying asset at a specified price (strike price), at a set time in the future. Options that give the right to buy the underlying assets are known as call options, while those that give the right but not the obligation to sell the underlying asset are known as put options.
- Futures Contract: This is a financial contract between two parties where both parties agree to buy/sell a particular asset at a predetermined price at a specific date. These contracts can be traded on a centralized exchange or an Over-the-Counter (OTC) market as standardized contracts. Futures contracts have a single clearinghouse (an intermediary between a buyer and a seller), and require a margin to be posted at the beginning of the contract, and will be settled for the duration of the contract. The difference between futures and a forward contract is that futures contracts tend to be standardized, meaning the contract values are in defined units, and hence why they commonly trade in an exchange. On the other hand, forward contracts tend to be privately negotiated between two parties and are usually not standardized, and hence commonly exchanged in the OTC market.
- Swaps Contract: This is a financial contract where two parties agree to exchange the cash flows from two different financial instruments. For instance, two parties may agree to exchange cash flows where one party makes payment in one currency while the other makes a payment in another currency. Such an arrangement is a currency swap. The main forms of swap contracts are currency swaps and interest rate swaps, where under interest rate swaps, parties exchange cash flows based on a benchmark rate such as the London Interbank Offered Rate (LIBOR).
- Warrants: These securities entitle the holder the right to purchase a company’s stock at a specific price at a specific date. These financial derivatives are issued directly by the company that is involved in the contract and not another investor. These are used as a form of capital raising for a company.
Just as financial assets are tradeable on an exchange, derivative contracts can be traded between parties through a derivatives market. Derivative markets can be categorized into two, (i) Over-the-Counter (OTC) market and (ii) Exchange Traded Derivatives (ETD) market. In the OTC market, parties trade directly with each other without intermediaries, meaning that trading occurs with relatively less regulation. The derivative contracts on the OTC market tend to have tailor-made specifications, and there are no cash flows until the maturity of the derivatives contract. In the ETD market, parties trade through the derivatives exchange, under a more regulated environment. The products on this market tend to have standardized specifications with daily revaluations of open positions via marking to market, contract settlement assistance through clearinghouses, and investors are required to put up an initial margin requirement in order to access and trade these products.
Upon the expiration of the contracts, the derivatives contracts can be settled in various ways depending on their nature. The various ways of the settlement include:
- Daily Cash Settlement - All futures positions are marked-to-market based on the daily settlement price of the futures contract at the end of each trading day. The profits/losses are computed as the difference between the price traded or the previous day’s settlement price (depending on when the position was initiated), and the current day’s settlement price. The investors who have suffered a loss are required to pay the mark-to-market loss amount to the clearinghouse, which is passed on to the investors who have made a profit.
- Final Cash Settlement - On the expiry date of the derivatives, there is a final settlement price, which is based on the closing price of the relevant underlying index/security in the stock exchange. The clearinghouse will mark all positions to the final settlement price and the resulting profit/loss will be settled in cash to investors. All open positions in the futures contract cease to exist after the contract expires.
- Physical Delivery – In this form of settlement, traders have to take delivery of the underlying asset on the settlement day against the derivatives positions. For example, on expiry of an agricultural derivative future, the seller of the contract shall have an obligation to deliver the underlying agricultural product at the expiry price, while the buyer of the contract shall be obligated to buy the agricultural product at the expiry price.
The following are the main uses of financial derivatives:
- Risk Management – Due to the uncertainty of stock and commodity prices, derivatives are mainly used to protect against fluctuations in prices by locking in a buy or sell at a pre-determined price;
- Enhance Liquidity – Derivatives provide an investment alternative for investors who are more risk averse to the fluctuation in the market thereby increasing the liquidity in the market; and,
- Speculation – Derivatives enable individuals who may expect changes in the stock and commodity prices to speculate, where they would buy an asset at a low price expecting the prices to rise or they would sell at a higher price with the expectation that prices may drop at a future date and they can buy what they sold at a cheaper price; and,
- Price Discovery - Derivatives allow for price discovery where individuals with better information and judgment on the movement of prices are able to take positions in the market.
Section II: Nairobi Securities Exchange Derivatives Market (NEXT)
Having given an overview of derivatives, we now proceed to look at the NEXT. The derivatives market in Kenya will operate in compliance with the Capital Markets (Derivatives Market) Regulation Act of 2015, which outlines the licensing requirements and duties of the derivatives exchange, the duties of the clearinghouse and how other market players will operate.
The derivatives market structure in Kenya will include the following players:
- The NSE Clear – This will serve as the clearinghouse in the market responsible for ensuring settlement finality and centralized clearing of all contracts through novation;
- Clearing Members – The Co-operative Bank of Kenya and Stanbic Bank have been appointed as clearing members to assist NSE Clear in the settlement process;
- Specialized Derivatives Exchange – The NEXT market is where the derivatives will be traded with standardized specifications as defined by the exchange;
- Trading Members – These are brokers and investments banks in the market;
- Clients – These are the investors (individuals and institutions); speculators, hedgers, and arbitrageurs.
The Nairobi Securities Exchange derivatives market (NEXT), which was launched on 4th July 2019, will facilitate the trading of the futures contract on the Kenyan Market and will be regulated by the Capital Markets Authority (CMA).
NEXT was established as a result of:
- Increased integration of the Kenyan financial markets with international markets;
- Increased volatility in asset prices in local and international markets;
- The need for more sophisticated risk management tools and strategies; and,
- The need to broaden and deepen Kenyan financial markets.
NEXT will facilitate the trading of two futures contracts, in particular: Equity Index Futures and Single Stock Futures.
NEXT Equity Index Futures
These are derivative instruments that would give investors exposure to price movements on an underlying index, the NSE 25 index. Market participants can profit from the price movements of a basket of equities without trading the individual constituents. The contracts will be held quarterly with expiry on the third Thursday of the expiry month. For the contract size, one index point equals Kshs 100.0, with the minimum quote spread at one index point.
The benefits of trading Equity index futures include:
- Price transparency and liquidity as they can be easily bought and sold;
- Lower transaction fees in comparison to individually buying and/or selling the basket of securities that are the underlying security;
- Enhanced returns, which are brought about by leverage, as the investor stands to gain more than they put in, inclusive of the margin payments; and,
- Reduction of counter-party risk as a result of trading via the exchange and centralized clearing.
The table below highlights the fees that would be incurred by trading:
|
Participant |
Percentage of Contract Value |
|
NSE Clear |
0.02% |
|
Clearing Member |
0.02% |
|
Trading Member |
0.08% |
|
IPF Levy |
0.01% |
|
CMA Fee |
0.01% |
|
Total |
0.14% |
NEXT Single Stock Futures
These are futures contract where the underlying security is an equity stock listed on the NSE, where one commits to buy or sell single equity at a future date. These instruments give investors exposure to price movements on an underlying stock. The single stock futures will be settled by cash with quarterly durations. The single stock futures contract will be valued based on the volume of the weighted average price of the underlying instrument for liquid contracts, and the theoretical price (spot price plus the cost of carry) for illiquid securities.
The single stock futures are expected to achieve various objectives:
- Provide an effective and transparent hedge against unfavorable share price movements,
- Enhanced returns, which are brought about by leverage, as the investor stands to gain more than they put in, inclusive of the margin payments;
- Possibly improve liquidity in illiquid securities, and,
- Give investors exposure to share price movements without owning the underlying share.
Under the NEXT Single Stock Futures, the following fees will be incurred:
|
Participant |
Percentage of the Contract value |
|
NSE Clear |
0.025% |
|
Clearing Member |
0.025% |
|
Trading Member |
0.10% |
|
IPF Levy |
0.01% |
|
CMA Fee |
0.01% |
|
Total |
0.17% |
Since the fees payable under the NEXT Equity Index and Single Stock futures are quite low, at 0.14%, and 0.17% of the contract value, as compared to direct equity brokerage costs that range from 0.9%-2.2% of the contract value, we expect that the lower transaction costs of trading will attract more investors and aid in the deepening of the market.
Performance on the first day of trading
On the first day of trading single stock futures for Safaricom, Equity Group, KCB Group, EABL, and BAT were listed with there being uptake for two single stock futures contracts; one for Safaricom and the other EABL with contract values of Kshs 28,900.0 and Kshs 19,974.0, respectively. There was no purchase of the equity index future contract, which may allude to investor preference for the single stock futures contracts. We are of the view that there needs to be more transparency on the contracts that are traded and the open positions of the buyers of the futures contracts. We view this as an important aspect given the impact on equity prices it may have, in the event of significant trade in the futures contracts.
Example of a single stock futures Investment:
Suppose there are two investors who had Kshs 40,000 in funds to buy Equity Group shares. Investor A purchases Equity Group shares directly, while Investor B purchases a futures contract. How would the two investors be affected by the movements in Equity Group’s share price?
- For Investor A, who directly purchases Equity Group’s shares, the value of his investment would directly correlate to the movement in Equity Group’s share price. Thus, Investor A will directly purchase 1,000 shares of Equity Group in the market, at a value of Kshs 40,000, using Equity Group’s closing price of Kshs 40.0 as at Friday, 5th July 2019. If the price of the shares rose by 20.0%, the value of the investment rises by 20.0%, if prices remained flat, the value of the investment remains flat, and if prices decline by 20.0%, the value of the investment also declines by 20.0%.
- For Investor B who purchases a futures contract, the contract will have specified the exercise price for the shares, i.e. the price that the investor will pay on the exercise date. Investor B will pay the initial margin and any additional margin at the onset of the contract, and be required to either pay or receive variation margins, depending on the changes in Equity Group’s share price. Assuming an initial margin of 10%, Investor B can use the entire Kshs 40,000 to purchase 10 Equity Group futures contracts of 1,000 units each at an exercise price of Kshs 40, bringing his entire exposure in Equity Group to Kshs 400,000. The tables below summarize the outcomes for Investor B when share prices rise and fall by up to 20.0%, respectively, using Equity Group’s closing price of Kshs 40.0 as at Friday, 5th July 2019.
Table 1: Share prices rise 20.0%
|
Date |
Closing Price |
P/L Calculation |
Initial Margin |
Variation Margin |
Net Cash flow |
|
5-July-2019 |
40.0 |
- |
(40,000.0) |
0 |
(40,000.0) |
|
5-Sept-2019 |
48.0 |
(48-40)*10*1,000 |
0 |
80,000.0 |
80,000.0 |
|
Settlement |
|
40,000 |
80,000.0 |
120,000.0 |
Table 2: Share prices decline 20.0%
|
Date |
Closing Price |
P/L Calculation |
Initial Margin |
Variation Margin |
Net Cash flow |
|
5-July-2019 |
40.0 |
- |
(40,000.0) |
0 |
(40,000.0) |
|
5-Sept-2019 |
32.0 |
(32-40)*10*1,000 |
0 |
(80,000.0) |
(80,000.0) |
|
Settlement |
|
40,000 |
(80,000.0) |
(40,000.0) |
If Equity Group’s share price was to rise by 20%, Investor B’s exposure of Kshs 400,000 will gain Kshs 80,000, giving him a Kshs 80,000 gain. If Equity Group’s share price was to remain flat, Investor B would not gain/ lose anything, as the margin payments would cancel out, and exercise price remains unchanged. If Equity Group’s share price falls by 20%, Investor B’s exposure of Kshs 400,000 would decline by Kshs 80,000, giving him a Kshs 80,000 loss. However, when his initial margin of Kshs 40,000 is wiped out, Investor B will receive a margin call from his broker (NSE trading member) and prompted to add additional funds to keep the futures contract open, otherwise, the position will be forcefully closed and the investor will lose his entire initial margin.
Section III: African Case Study: South Africa’s Derivatives MarketTable
The derivatives market in South Africa began with the operations of the Equity Derivative Division of the Johannesburg Stock Exchange in 1990, coordinating warrants, single stock futures, and equity indices futures. This was followed by the introduction of options contracts in 1992 and derivatives contracts with agricultural commodities as the underlying asset in 1995. The trading system was then fully automated in 1996. The development of the South African Derivatives Market was established in efforts to hedge against volatile capital flows and manage financial risk associated with the high volatility of asset prices.
As of 2018, the derivatives market had grown to the following volumes:
|
Exchange-traded derivatives market |
2018 Volume (in USD millions) |
|
Stock options |
9.0 |
|
Single stock futures |
139.0 |
|
Single index futures |
4.0 |
|
Short-term interest rate futures |
20.0 |
|
Currency options |
10.0 |
|
Currency Futures |
21.0 |
|
Commodity Futures |
48.0 |
|
Total |
251.0 |
|
Over-the-Counter derivatives market |
2018 Daily average turnover (in USD millions) |
|
Forwards |
7.0 |
|
Swaps |
1.0 |
|
Options |
1.0 |
|
Total |
9.0 |
The products offered on the JSE derivatives market include:
- Bond derivatives - Bond futures, bond options and bond index futures;
- Interest rate derivatives - Short-term Interest Rate Futures & Long-term Interest Rate Futures;
- Equity derivatives - Equities futures, Exchange Traded CFDs & Equities options;
- Commodity derivatives - Futures & options contracts; and
- Currency futures derivatives.
The prices of the derivatives are negotiated through the South African Futures Exchange order-matching platform, the automated trading system (ATS). There are 52 companies listed on the JSE that are involved in the derivatives market.
The main regulatory agencies involved in the derivatives market in South Africa include:
- The Financial Services of South Africa (FSB) – This agency supervises the activities of nonbank financial institutions and other financial services. The Capital Market Department of the FSB is responsible for the supervision of licensed exchanges, central securities depositories and clearing houses;
- The JSE and the Bond Exchange of South Africa (BESA) – These are licensed exchanges trading in derivative instruments and supervised by the FSB. Within the JSE, there are two divisions to oversee trading derivatives, which are the Equity Derivatives Division and the Agricultural Products Division; and,
- The SAFEX Clearing Company – This agency is licensed to clear transactions on the derivatives traded on the JSE and they operate under the direction of JSE.
The following are the main factors that have led to the success of the derivatives market in South Africa:
- Deregulation of the agricultural sector – Prior to 1995, the government had been involved in fixing prices of the agricultural commodities. With deregulation, this allowed for the creation of the agricultural commodities market on the JSE;
- Exchange control reforms – In 2007, corporate entities and retail investors were allowed to trade currency futures on JSE provided that they could cover the currency risk on a regulated platform;
- Economic and capital markets growth – With the economic expansion, the underlying value of equities and bonds in the capital market have appreciated over the years and thus increasing the value of the derivatives market; and,
- Ease of doing business – South Africa ranks 82 out of 190 countries in ease of doing business with ranks of 46 in payment of taxes and 23 in protecting minority investors. This has encouraged foreign investment into the market.
The following are the main challenges facing the derivatives market in South Africa:
- Stringent regulation – With regulation on asset allocation for institutional investors such as insurance and pension funds, this affects the demand for the derivatives market. Secondly, with different regulatory/supervisory agencies in place, this puts in place bureaucratic procedures to remain compliant with all the agencies. Furthermore, with regulation towards hedge fund products, this also affects the demand side of the derivatives market; and,
- Knowledge amongst retail investors – Institutional investors account for the larger proportion of investment on the JSE sighting to constraints on the retail investors such as the little or no knowledge of the derivatives market currently in operation.
The JSE has benefited from the derivatives market in the following ways:
- Increased liquidity – With derivatives increasing the investment opportunities on the Stock exchange, investors have an added investment channel for their funds and thus increasing the inflows into the JSE;
- Management of risk-exposure – The derivatives market has presented the aspect of loss minimization as the contracts have set out pre-agreed prices; and in the event that the prices of the stock market decline, the investors who purchased derivatives have reduced their exposure to loss.
In comparison to the Kenyan market, the South African market had more products on the issue when the derivative markets were introduced, as they also launched with Options Contracts, which are yet to be launched in Kenya. This may be attributed to the Kenyan market trying to ensure relatively good uptake of the new product, by not having many new product issuances. This is unlike the South African market, which was relatively more developed than the Kenyan market at the time in terms of size and product offerings, with derivative trades have been taking place informally, since 1987. In Kenya, products currently introduced are strategic, given that the single stock futures are few, and limited to only five of the largest companies by market capitalization, and a single equity index future. This may be done to avoid flooding the market with relatively new and complex products and give investors time to understand the new products and streamline processes by the various market intermediaries, before the introduction of additional products. We thus expect with time, introduction and uptake of new derivative products to improve.
Section IV: Our Views, Expectations, and Conclusion
The derivatives market is expected to be beneficial to investors in the following ways:
- Hedging – The Derivatives market provides an opportunity for investors to protect their portfolios against volatile stock prices;
- Higher Returns – The Derivatives market would only require an initial margin at the beginning of the contract and investors stand to gain higher returns upon expiration of the contract when they are in the money;
- Lower Transaction Costs – The Equities index and single stock futures contracts involve transaction costs of 0.14% and 0.17%, respectively in comparison to direct equity brokerage costs that range from 0.9% - 2.2%; and,
- Lower Credit Risk – With the NSE Clear ensuring that settlement is completed on a daily basis, there are lower chances of default by the counterparty in the agreement.
With the benefits presented by the Derivatives Market, there are risks that may affect the performance of the Derivatives market, some of which may include:
- Default Risk – Despite the NSE Clear handling the settlements, there is risk posed by investors who may not have enough funds to handle the daily variation margin settlement obligations;
- Market Risk – This is the risk of incurring losses due to market prices moving against investors’ expectations;
- Liquidity Risk-Liquidity risk exists, in the event, the counterparty to trade is to deliver a relatively illiquid counter on contract maturity. This has however been mitigated currently, with the clearing houses set to be the market makers, with Co-operative Bank and Stanbic Bank the clearing houses. They will be the initial writers (sellers) of the futures contracts. Furthermore, liquidity risk has however been mitigated by having futures contracts on the 5 largest companies by market capitalization, which should help buffer against low volumes trading periods in the market;
- Operational Risk – This risk would occur where market participants are unfamiliar with market procedures and that would lead them to incur unintended losses; and,
- Low Uptake – The Kenyan market has a low uptake rate when it comes to new products in the financial markets. This is mainly attributed lack of consumer education as has been the case for the Real Estate Investment Trusts (REITs).
The derivatives market in Kenya will be beneficial in opening up Kenya’s financial markets to domestic and international investors, which will influence the performance of the economy. In order for the derivatives market to be widely accepted in the Kenyan market, we believe the following should be taken into consideration:
- Investor Education - Investors both foreign and domestic would need to be informed of the workings of the derivatives market and the current offerings to ensure there is a larger rate of uptake in the derivatives market.
- Products Offered in the Derivatives Exchange – Given that the agricultural sector is the main backbone of the economy; it would be advisable to include a commodity derivatives market so as to support the entire agriculture value chain.
Disclaimer: The views expressed in this publication are those of the writers where particulars are not warranted. This publication, which is in compliance with Section 2 of the Capital Markets Authority Act Cap 485A, is meant for general information only and is not a warranty, representation, advice or solicitation of any nature. Readers are advised in all circumstances to seek the advice of a registered investment advisor.

- Talk to us
- Kenya
- P.O Box 20695 - 00200, Nairobi, Kenya
- Cell +254709101200
- Tel +254709101200
- WhatsApp +254741676635
- United States
- +254709101200
- DOWNLOAD OUR APP
-


- Kenya
- 8th Floor, Pinetree Plaza, Kaburu Drive, Ngong Road, Nairobi, Kenya
- USA
- Suite 1150, 1775 Eye Street NW, USA, Washington DC 20006, USA
- Investments
- High Yield
- Private Equity
- Real Estate
- Real Estate
- RiverRun Estates
- Cytonn Towers
- The Ridge
- Taraji Heights
- The Alma