Cytonn Q3’2019 Markets Review
By Cytonn Investments, Oct 6, 2019
Executive Summary
Global Markets Review
According to the World Bank, the global economy has continued to slow down, with 2019 growth expected at 2.6%, a 0.4% point decline from the 3.0% recorded in 2018. This is as a result of (i) an escalation in the trade dispute between the US and China, (ii) country-specific uncertainty such as Britain’s exit from the European Union (“Brexit”), (iii) heightened geopolitical tension between the US and Iran that has disrupted the mid-stream and down-stream oil supply channels, and (iv) overall slowing global trade, which, according to World Bank, contracted by 1.4% in June 2019;
Sub-Saharan Africa Region Review
Majority of the currencies in the Sub Saharan Africa Region have depreciated against the US Dollar on an YTD basis with the Ugandan Shilling and the Nigerian Naira being the only gainers. The Ghanaian Cedi was the worst performer, depreciating by 12.4% against the dollar YTD owing to perceptions about the country’s inability to manage its finances properly after a four-year bailout by the International Monetary Fund that ended in April 2019. Yields on African Eurobonds generally declined in Q3’2019. This was partly attributed to the adoption of a looser monetary policy regime by the Eurozone and the United States that led to a decline in yields in advanced economies and hence increased investor interest in Africa’s debt market. Majority of the SSA stock markets recorded negative returns during Q3’2019, attributed to expectations of slower global economic growth, and uncertainties from the escalated trade dispute between the United States and China;
Kenya Macroeconomic Review
The macroeconomic environment in Kenya has remained relatively stable in the third quarter of 2019, supported by (i) a stable interest rate environment, evidenced by the declining yields in government securities in the primary market, which has enabled the Kenyan Government to continue accessing cheap domestic debt, and (ii) improved business confidence and strong private consumption as evidenced by the Stanbic Bank Monthly Purchasing Manager’s Index (PMI), which averaged 53.7 in Q3’2019 and rose to 54.1 in September, indicating expansion. Kenya’s economy expanded by 5.6% in Q2’2019, similar to the 5.6% recorded in Q1’2019, but lower than the 6.4% recorded in Q2’2018. The average inflation rate increased to an average of 5.1% in Q3’2019, compared to 4.4% in Q3’2018;
Fixed Income
T-bill’s remained oversubscribed in Q3’2019, with the average subscription rate coming in at 106.8%, a decline compared to 125.5% in Q2’2019. Average subscription rates for the 91-day, 182-day, and 364-day papers in Q3’2019 came in at 121.9%, 44.4% and 163.0%, respectively, from 100.6%, 49.6% and 248.1% in Q2’2019;
Equities
In Q3’2019, the equities market was on a downward trend, with NASI, NSE 20 and NSE 25 declining by 3.0%, 7.6%, and 3.1%, respectively, taking their YTD performance as at the end of September to gains and (losses) of 3.6%, (14.2%) and (2.2%) for NASI, NSE 20 and NSE 25, respectively. The equities market performance during the quarter was shaped by declines in large caps such as Bamburi, Equity Group, and Safaricom, which declined by 17.9%, 3.9%, and 2.1%, respectively. During the week, the equities market was on an upward trend, with NASI, NSE 20 and NSE 25 gaining by 1.8%, 1.6%, and 1.5%, respectively, taking their YTD performance to gains and (losses) of 4.8%, (13.9%) and (1.3%), respectively. The performance in NASI during the week was driven by gains in Safaricom, BAT, Co-operative Bank of Kenya, and Standard Chartered Bank, which gained by 3.5%, 2.9%, 2.1% and 1.9%, respectively;
Private Equity
During Q3’2019, we witnessed high levels of private equity activity across the sectors we cover, including financial services, FinTech, and Education, evidenced by increased deal activity by global investors, among them Helios and Actis. The financial services and FinTech sectors witnessed the most activity, with some of the notable transactions being the capital raises by Branch and Tala, and the acquisition of a stake in Credit Bank by Oiko Credit, among others;
Real Estate
The real estate sector has recorded subdued performance in Q3’2019, with the residential, commercial office and retail sectors recording average yields of 4.7%, 7.7% and 8.0% in Q3’2019, from 4.9%, 7.8% and 8.2%, respectively, in H1’2019. The decline in performance was driven by (i) delay in the processing of construction permits by some county governments, (ii) oversupply in the commercial office and retail sectors with a surplus of 5.2 mn SQFT and 2.0 mn SQFT, respectively, as at 2018, and (iii) slow private sector credit growth.
- Cytonn Investments filed an application with the Capital Markets Authority (CMA), on 3rd October 2019, to register a Development Real Estate Investment Trust, (D-REIT), seeking to raise Kshs 2.0 bn of capital. The D-REIT, which is innovatively structured to pay a coupon over the life of the development, will be deployed for the first phases of two of our real estate projects, The Ridge in Ridgeways, and RiverRun Estates in Ruiru. For a copy of the press release, please see here.
- The Ridge is a comprehensive aspirational lifestyle development on 10 acres in Ridgeways where stage one of the development is complete – including land acquisition, concept development and foundation works. The funds raised will go towards the second stage, entailing the superstructure construction.
- RiverRun is a master planned mixed-use community on 100 acres in Ruiru, with a dedicated affordable housing component;
- David Gitau, Investments Analyst, was on K24 to discuss Cytonn’s Listed Banks H1’2019 Report. Watch David here;
- Caleb Mugendi, Assistant Manager – Public Markets, was on NTV to discuss alternative investments. Watch Caleb here;
- Beatrice Mwangi, Research and Deal Orientation Analyst was on Inooro TV to discuss the performance of Kenyan markets. Watch Beatrice here;
- Phase 1 of The Alma is now 100% sold with early buyers having achieved up to 55% capital appreciation. Phase 2 now open for sale. For inquiries, please email us on clientservices@cytonn.com. The site is open between 8 am - 5 pm, 7-days a week for site visits;
- Cytonn Money Market Fund closed the week at an average yield of 10.4% p.a. To subscribe, just dial *809#;
- For an exclusive tour of Cytonn’s real estate developments, visit: Sharp Investor’s Tour and for more information, email us at sales@cytonn.com;
- Following the completion and handover of Amara Ridge in Karen, we have now launched our next Karen project, dubbed Applewood, a Kshs 2.5 bn residential development located in Miotoni, Karen. This signature development shall comprise luxury homes, each sitting on 1/2 acre. We invite you to the exhibition of Applewood which is ongoing at the Amara Ridge Clubhouse (Location pin: https://goo.gl/maps/B3GVnu8pHyn) or at the Applewood Sales Centre on Miotoni Road (Location pin: https://goo.gl/maps/ZfABuGjFo1z) from 9:00 am to 5:00 pm daily. Call 0709 101 000 or email resales@cytonn.com to reserve a villa! See Video here;
- We continue to hold weekly workshops and site visits on how to build wealth through real estate investments. The weekly workshops and site visits target both investors looking to invest in real estate directly and those interested in high yield investment products to familiarize themselves with how we support our high yields. Watch progress videos and pictures of The Alma, Amara Ridge, and The Ridge;
- We continue to see very strong interest in our weekly Private Wealth Management Training (largely covering financial planning and structured products). The training is at no cost and is open only to pre-screened participants. We also continue to see institutions and investment groups interested in the training for their teams. Cytonn Foundation, under its financial literacy pillar, runs the Wealth Management Training. If interested in our Private Wealth Management Training for your employees or investment group, please get in touch with us through wmt@cytonn.com. To view the Wealth Management Training topics, click here;
- For recent news about the company, see our news section here;
- We have 10 investment-ready projects, offering attractive development and buyer targeted returns. See further details here: Summary of Investment-Ready Projects.
Introduction
According to the World Bank, the global economy has continued to slowdown, with 2019 growth expected at 2.6%, a 0.4% point decline from 3.0% recorded the in 2018. This is as a result of;
- An escalation in the trade dispute between the US and China,
- Country-specific uncertainty such as Britain’s exit from the European Union (“Brexit”),
- Heightened geopolitical tension between the US and Iran, disrupting the mid-stream and down-stream oil supply channel,
- Overall slowing global trade, which, according to World Bank, contracted by 1.4% in June 2019, and,
- Reduced consumption expenditure in major global economic regions such as Asia, as it has resulted in the reduction in global demand for goods and services, and hence contributed to the slowing global trade.
United States
The US economy grew by 2.0% in Q2’2019, a 2.2% point decline from the 4.2% recorded in Q2’2018. The decline is attributed to a decline in the manufacturing sector with industrial production growing by 0.4% in August 2019, the slowest pace since August 2017. The US economy is expected to grow by 2.5% in 2019, slower than the 2.9% growth recorded in 2018, weighed down by reduced exports to major traditional partners such as China and the Eurozone, owing to uncertainty regarding the trade dispute between the US and China, and the fragile growth in the Eurozone.
The Federal Open Monetary Committee (FOMC) held 2 meetings during Q3’2019, and reduced the Federal Funds Rate by 25 bps at each meeting, to a range of 1.75% - 2.00%, from 2.25%-2.50% previously, citing:
- Weakened business investment and exports amid falling manufacturing as a result of slower global growth and trade policy tensions, and,
- Muted inflationary pressure with the current inflation rate of 1.7%, being below the government’s target of 2.0%
The stock market has been on an upward trend, with the S&P 500 gaining by 1.2% in the quarter and 18.7% YTD. The gain was largely supported by improved corporate earnings performance by a majority of counters in the financial services, oil and gas, consumer goods and technology sectors, and the easing stance adopted by the Federal Reserve. US valuations are still higher than their long-term historical average with the Shiller Cyclically Adjusted P/E (CAPE) multiple currently at 29.6x, which is 77.2% above the historical average of 16.7x.
Eurozone
The Eurozone economy grew by 0.2% in Q2’2019, a 0.1% point decline from the 0.3% recorded in Q2’2018. The slow growth is attributed to dampened sentiments in major economies such as Germany, which contracted by 0.3% during the quarter as a result of falling exports, and could be on path for a recession this year. The slow growth is also attributed to a fall of 1.8% in industrial production as a result of collapsing production of motor vehicles and capital goods. In addition, uncertainty over Britain’s exit from the European Union (“Brexit”) has also led to increased uncertainty in the Eurozone regarding its impact, and the type of exit deal to be adopted by the UK.
The European Central Bank (ECB) maintained the base lending rate at 0.0%, and the rates on the marginal lending facility at 0.25%, while it reduced its deposit rates by 10 bps to (0.5%) from (0.4%), and introduced a fresh stimulus package by restarting its bond purchases of EUR 20.0 bn a month from November. The stimulus packages were in a bid to revive growth amid the fragile economic growth in the Eurozone, and the muted inflationary pressures, as the inflation rate for the region came in at 1.0% in September, lower than the ECB target of 2.0%.
The Stoxx 600 index rose by 2.2% in Q3’2019 and by 16.4% YTD. The P/E ratio currently at 16.0x, is 17.9% below the historical average of 19.5x, indicating markets are currently trading at relatively cheaper valuations.
China
The Chinese economy grew by 6.2% in Q2’2019, a 0.5% point decline from the 6.7% recorded in Q2’2018. The decline is attributed to trade flows remaining weak amid softening global demand and higher tariffs on bilateral trade with the U.S, coupled with a decline in manufacturing activity. The government is however providing additional fiscal support through fixed investments that grew by 5.5% in August 2019. During the quarter, the Manufacturing PMI closed at 49.8 in September 2019, marking the fifth consecutive month the manufacturing sector contracted during the year since the last recorded expansion in April at 50.1.
The Chinese government has adopted a more accommodative stance, with the aim of attaining the target GDP growth of “around 6.5%” by injecting liquidity in the economy by reducing the reserve requirements for banks, and resuming public investment, which should result in increased liquidity and consequently higher domestic consumption.
The Shanghai Composite index declined by 2.5% in Q3’2019, for a gain of 16.4% YTD. The year to date gain is supported by expectations of a positive outcome following resumption of trade talks with the United States, coupled with increased capital injection by the government, which improved investor confidence. The P/E ratio currently at 11.8x, is 18.6% below the historical average of 14.5x, indicating markets are currently trading at relatively cheaper valuations.
Commodity Prices
According to the World Bank Commodity Prices Index, energy, metals, precious metals and agriculture segments gained/(declined) by 2.7%, (1.5%), 12.5% and (1.5%), respectively, in Q3’2019. Below is a chart showing the performance of select commodity groups for Q3’2019;
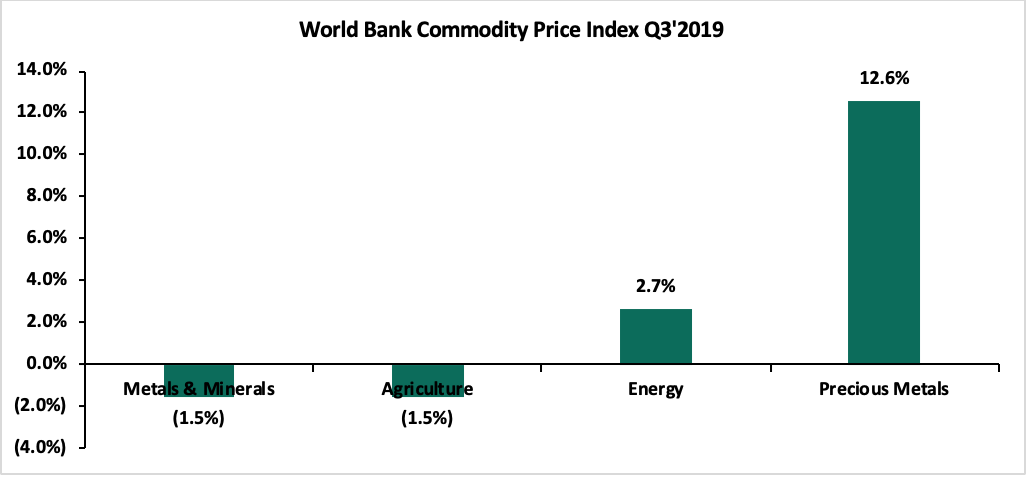
As per the chart above:
- The increase in precious metals was largely influenced by the rise in gold prices, which has benefitted as a store of value following the expansionary monetary policy adopted in advanced economies leading to lower interest rates, and
- The decline in agriculture was largely driven by the declines in oils & meals and food, which both recorded declines of 1.0% points.
Currency Performance
Majority of the currencies in the Sub Saharan Africa Region have depreciated against the US Dollar on an YTD basis with the Ugandan Shilling and the Nigerian Naira being the only gainers. The Ghanaian Cedi was the worst performer, depreciating by 12.4% against the US Dollar YTD owing to perceptions about the country’s inability to manage its finances properly after a four-year bailout by the International Monetary Fund that ended in April 2019. The Kenya Shilling’s depreciation against the US Dollar YTD has mainly been attributable to high dollar demand from merchandise importers and the energy sector. Below is a table showing the performance of select African currencies:
|
Select Sub Saharan Africa Currency Performance vs USD |
|||||
|
Currency |
Sep-18 |
Dec-18 |
Sep-19 |
Last 12 Months Change (%) |
YTD Change (%) |
|
Ugandan Shilling |
3,820.0 |
3,699.3 |
3,675.0 |
3.8% |
0.7% |
|
Nigerian Naira |
306.4 |
307.0 |
306.0 |
0.1% |
0.3% |
|
Tanzanian Shilling |
2,257.2 |
2,298.7 |
2,315.5 |
(2.6%) |
(0.7%) |
|
Malawian Kwacha |
718.4 |
719.8 |
727.6 |
(1.3%) |
(1.1%) |
|
Kenyan Shilling |
100.7 |
101.8 |
103.8 |
(3.0%) |
(1.9%) |
|
Botswana Pula |
10.6 |
10.7 |
11.0 |
(4.2%) |
(3.1%) |
|
South African Rand |
14.1 |
14.3 |
15.1 |
(7.1%) |
(5.5%) |
|
Mauritius Rupee |
34.2 |
34.2 |
36.1 |
(5.5%) |
(5.7%) |
|
Ghanaian Cedi |
4.8 |
4.8 |
5.4 |
(13.5%) |
(12.4%) |
African Eurobonds
Yields on African Eurobonds generally declined in Q3’2019. This was partly attributed to the adoption of a looser monetary policy regime in the Eurozone and the United States that led to a decline in yields in advanced economies. As a result, there was increased investor interest in Africa’s debt market.
Below is a graph showing the Eurobond secondary market performance of select 10-year Eurobonds issued by their respective countries:
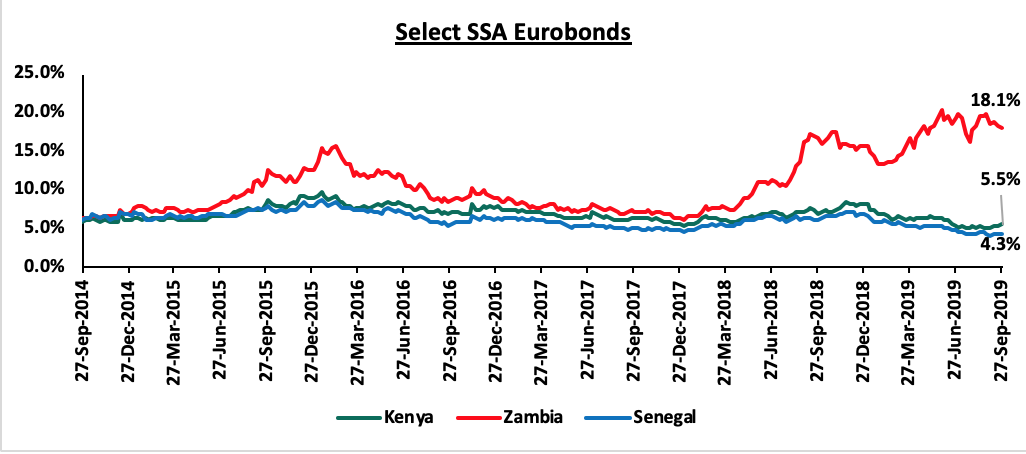
Analysis of trends observed in the chart above is as follows:
- Yields on the Zambia Eurobond continued to increase in Q3’2019, attributable to the exodus of foreign investors amid fears of the country’s debt sustainability, with most believing it to be close to default as the country is struggling with high debt levels. Zambia’s external debt has risen to USD 10.1 bn at the end of 2018, compared with USD 8.7 bn in 2017, with the debt to GDP ratio estimated at 74.4% further, raising fears of a debt crisis in the country. This has seen the downgrading of the Government of Zambia's long-term issuer ratings to Caa2 from Caa1 and changed the outlook to negative from stable.
- Yields on Kenyan and Senegalese Eurobonds both declined in Q3’2019, signalling that the demand for the instruments had risen during the period, mostly attributed to macroeconomic stability in both countries.
Equities Market Performance
Majority of the SSA stock markets recorded negative returns during Q3’2019, attributed to expectations of slower global economic growth, coupled with uncertainties from the escalated trade dispute between the United States and China, which saw widespread sell-offs across emerging markets by investors. In the near term, we expect the markets to remain subdued due to the exit of offshore investors. Below is a summary of the performance of key bourses in SSA:
|
Equities Market Performance (Dollarized*) |
|||||
|
Country |
Sep-18 |
Dec-18 |
Sep-19 |
Last 12 Months Change (%) |
YTD Change (%) |
|
Kenya |
1.5 |
1.4 |
1.4 |
(6.0%) |
1.4% |
|
Rwanda |
0.1 |
0.1 |
0.1 |
(1.3%) |
0.0% |
|
South Africa |
3,939.8 |
3,675.7 |
3,622.9 |
(8.0%) |
(1.4%) |
|
Uganda |
0.5 |
0.5 |
0.4 |
(12.5%) |
(6.7%) |
|
Nigeria |
107.0 |
102.4 |
90.3 |
(15.6%) |
(11.8%) |
|
Tanzania |
1.0 |
1.0 |
0.8 |
(11.8%) |
(19.2%) |
|
Ghana |
604.0 |
519.0 |
408.0 |
(32.5%) |
(21.4%) |
|
Zambia |
448.0 |
440.7 |
336.2 |
(25.0%) |
(23.7%) |
|
*The index values are dollarized for ease of comparison |
|||||
We are of the view that relative political stability, higher oil production (in oil exporting countries), strong agricultural production and strengthening economic reforms will improve SSA’s economic outlook. However, political uncertainty, widening fiscal and current account deficits, and rising public debt levels could continue to weigh on the economic outlook for the region.
According to the Kenya National Bureau of Statistics (KNBS), Kenya’s economy expanded by 5.6% in Q2’2019, similar to the 5.6% recorded in Q1’2019, but lower than 6.4% recorded in Q2’2018. The economic growth was driven by:
- Recovery in the financial and insurance sector, which recorded a growth of 6.7% compared to the growth of 3.9% seen in Q2’2018,
- Increased output in the education, transport and storage and construction sectors, which grew by 6.0%, 7.2% and 7.2%, respectively,
- Information and Communication sector which recorded the highest growth of 11.6%, compared to 11.7% recorded in Q2’2018, and,
- The agricultural sector which recorded a slower growth of 4.1%, compared to 6.5% seen in Q2’2018.
With the implementation of the Big 4 agenda, various sectors stand to grow significantly with the increased activity such as the manufacturing sector, which will also benefit from the major infrastructural developments taking place. For a more comprehensive analysis, see our Q2’2019 Quarterly GDP Review and Outlook Note.
During Q3’2019, we tracked Kenya 2019 GDP growth projections released by 13 organizations, that comprised of research houses, global agencies, and government organizations. The average GDP growth, including Cytonn’s 2019 growth estimate of 5.9%, came in at 5.9%, unchanged from average projections released in Q2’2019. The common view is that GDP growth will slow in 2019 from a growth of 6.3% in 2018, the fastest economic growth since the 8.4% recorded in 2010.
Below is a table showing average projected GDP growth for Kenya in 2019; noteworthy being that the highest projection is by the Central Bank of Kenya at 6.3%. We shall be updating this table should projections change and shall highlight who had the most accurate projection at the end of the year.
|
Kenya 2019 Annual GDP Growth Outlook |
||||
|
No. |
Organization |
Q1'2019 |
Q2'2019 |
Q3’2019 |
|
1. |
Central Bank of Kenya |
6.3% |
6.3% |
6.3% |
|
2. |
Citigroup Global Markets |
6.1% |
6.1% |
6.1% |
|
3. |
African Development Bank (AfDB) |
6.0% |
6.0% |
6.0% |
|
4. |
PNB Paribas |
6.0% |
6.0% |
6.1% |
|
5. |
UK HSBC |
6.0% |
6.0% |
6.0% |
|
6. |
Euromonitor International |
5.9% |
5.9% |
6.3% |
|
7. |
International Monetary Fund (IMF) |
6.1% |
5.8% |
5.9% |
|
8. |
Cytonn Investments Management Plc |
5.8% |
5.8% |
5.8% |
|
9. |
Focus Economics |
5.8% |
5.8% |
5.6% |
|
10. |
World Bank |
5.8% |
5.7% |
5.7% |
|
11. |
JPMorgan |
5.7% |
5.7% |
5.6% |
|
12. |
Euler Hermes |
5.7% |
5.7% |
5.7% |
|
13. |
Oxford Economics |
5.6% |
5.6% |
5.6% |
|
|
Average |
5.9% |
5.9% |
5.9% |
Inflation
The average inflation rate rose to 5.1% as compared to 4.4% in a similar period in 2018. September’s inflation rate declined significantly to 3.8% from 5.0% in August 2019, with the m/m inflation decreasing marginally by 0.1%. The decline in the month-on-month inflation in September was mainly due to:
- A 0.4% decline in the food and non-alcoholic beverage index, owing to a decrease in prices of some foodstuffs in September 2019 outweighing increases recorded in others, with carrots, cabbages and tomato prices having decreased by 9.8%, 6.3% and 4.1%, respectively.
However, continued upward pressure in prices are coming from:
- A 0.5% increase in transport cost driven by a raise in pump prices for petrol and diesel, and
- A 0.1% increase in Housing, Water, Electricity, Gas and Other Fuels Index stimulated by an increase in house rent and cooking fuel prices.
|
Major Inflation Changes - September 2019 |
|||
|
Broad Commodity Group |
Price change m/m (Sep-19/Aug-19) |
Price change y/y (Sep-19/Sep-18) |
Reason |
|
Food & Non-Alcoholic Beverages |
(0.4%) |
6.3% |
The m/m decline was due to a decrease in prices of some foodstuffs for instance carrots, cabbages and tomatoes |
|
Transport Cost |
0.5% |
1.9% |
The m/m rise was mainly on account of increase in pump prices of petrol and diesel. |
|
Housing, Water, Electricity, Gas and other Fuels |
0.1% |
1.0% |
The m/m rise was as a result of increase in house rent and cooking fuels |
|
Overall Inflation |
(0.1%) |
3.8% |
The m/m decline was due to a 0.4% decline in the food index which has a CPI weight of 36.0% |
The Kenya Shilling
The Kenya Shilling depreciated against the US Dollar by 1.6% in Q3’2019, to close at Kshs 103.9, from Kshs 102.3 at the end of Q2’2019. During the week, the Kenya Shilling remained stable against the dollar to close at 103.8, unchanged from the previous week. In our view, the shilling should remain relatively stable to the dollar in the short term, supported by:
- The narrowing of the current account deficit, with preliminary data indicating that Kenya’s current account deficit improved by 11.8% during Q2’2019, coming in at a deficit of Kshs 107.6 bn, from Kshs 122.0 bn in Q2’2018, equivalent to (6.2%) of GDP, from (7.6%) recorded in Q2’2018. This was mainly driven by the narrowing of the country’s merchandise trade deficit by 1.7% and a rise in secondary income (transfers) balance by 5.1%,
- Improving diaspora remittances, which have increased cumulatively by 8.9% in the 12-months to August 2019 to USD 2.8 bn, from USD 2.6 bn recorded in a similar period of review in 2018. The rise is due to:
- Increased uptake of financial products by the diaspora due to financial services firms, particularly banks, targeting the diaspora, and,
- New partnerships between international money remittance providers and local commercial banks making the process more convenient,
- CBK’s supportive activities in the money market, such as repurchase agreements and selling of dollars, and,
- High levels of forex reserves, currently at USD 9.0 bn (equivalent to 5.6-months of import cover), above the statutory requirement of maintaining at least 4.0-months of import cover, and the EAC region’s convergence criteria of 4.5-months of import cover.
Monetary Policy
The Monetary Policy Committee (MPC) met twice in Q3’2019, retaining the Central Bank Rate (CBR) at 9.0% on both occasions. In the July 24th meeting, the committee noted that inflation expectations were well anchored within the target range of 2.5% - 7.5%, and that economic growth prospects were improving, in line with our expectations. This was evidenced by;
- A stable foreign exchange market, with the current account deficit narrowing to 4.2% in the 12 months to June 2019 from 5.4% in May 2018, and;
- A stable and resilient banking sector, with average liquidity and capital adequacy ratios at 50.6% and 18.2%, respectively in June 2018. The committee also noted that the economy was performing stronger than expected supported by agricultural production, strong growth of MSMEs and the service sector, foreign direct investment, and a stable macroeconomic environment.
For more information, see our note on Monetary Policy Committee Meeting for July 2019.
In the September 23rd meeting, the MPC cited that inflation expectations remained well anchored within the target range largely due to lower food prices following improved weather conditions and that there was sustained optimism for stronger economic growth in 2019 as per the private sector market perception survey. This was mainly attributed to implementation of the Big 4 agenda projects, ongoing public infrastructure investments, improved weather conditions, and a stable macroeconomic environment. The MPC noted that there was; however, need to remain vigilant on the possible effects of the increased uncertainties in the external environment. For more information see our note on Monetary Policy Committee Meeting for September 2019. Going forward we expect the MPC to retain the CBR at 9%, similar to their previous meetings with due to the current uncertainty in the market around the Finance Bill 2019, which contained a proposal to remove the interest rate cap.
Q3’2019 Highlights
- The National Treasury in the Finance Bill 2019 proposed to repeal the current interest rate cap. This proposal was rejected on grounds that it will subject Kenyans to expensive loans from commercial banks. Members of Parliament also cited that banks have continued to be profitable in the interest rate cap regime, and there is no guarantee from banks that a repeal would lead to increased lending to Micro, Small and Medium Enterprises (MSMEs), who have been the most affected by the rate cap. We do expect a review of the Banking (Amendment) Act 2015, given a Member of Parliament proposed a revision of the law to include a ceiling of 6.0% above the limit set by the Banking (Amendment) Act, 2015 for the high-risk borrowers. For more information see Cytonn Weekly #38/2019,
- The National Treasury released the budgetary review for the 2018/2019 financial year indicating that revenues collected had increased by 9.2% to Kshs 1.7 tn from Kshs 1.5 tn collected during the 2017/2018 financial year. The revenue collected was 93.1% of the budgetary target for the year as compared to the previous period where revenue collected was 91.7% of the budgetary target. Total expenditure amounted to Kshs 2.4 tn, a 12.1% increase from Kshs 2.1 tn recorded during the same period last year. This was 94.7% of the Kshs 2.5 tn target, with 62.2% of the expenditure being on recurrent expenditure, while development expenditure only accounted for 22.5%. Total expenditure was, however, 6.3% lower than the targeted expenditure as per the budget. The key concern, however, remains the widening of the fiscal deficit where the expenditure side has continued to grow faster recording a 12.1% growth, compared to the 9.2% growth in revenue collection. For more information see our Cytonn Weekly #34/2019,
- According to KNBS, Kenya’s current account deficit improved by 11.8% during Q2’2019, coming in at a deficit of Kshs 107.6 bn, from Kshs 122.0 bn in Q2’2018, equivalent to (6.2%) of GDP, from (7.6%) recorded in Q2’2018. This was mainly driven by; (i) A 1.7% narrowing of the merchandise trade deficit from Kshs 277.7 bn in Q2’2018 to Kshs 272.9 billion in Q2’2019, (ii) A marginal decline in net inflows of international trade in services by 0.1% points to Kshs 38.27 bn, from Kshs 38.29 bn recorded in Q2’2018, and (iii) A 5.1% rise in the secondary income (transfers) balance, to a surplus of Kshs 149.2 bn, from a surplus of Kshs 142.0 bn in Q2’2018. For a more comprehensive analysis, see our Q2’2019 Quarterly Balance of Payments Review and Outlook Note
- According to Stanbic Bank’s Monthly Purchasing Manager’s Index (PMI), released earlier during the week, a sharper upturn in new business stimulated a stronger improvement in operating conditions during the month of September. The seasonally adjusted PMI came in at 54.1 in September, an improvement from 52.9 in August. A PMI reading of above 50 indicates improvements in the business environment, while a reading below 50 indicates a worsening outlook. The sharper increase in new business saw several firms report higher client numbers since August. Export demand rose at a quicker pace, however, it was still the second lowest in nearly two years. The growth was attributed to greater trade with customers in Tanzania, Burundi and Congo, as well as international markets such as the US and Europe. Nonetheless, output levels rose only modestly as many companies continued to struggle with cash flow problems. This led to an increase in outstanding business as well as further build-up of input stocks. Job numbers grew solidly at its quickest pace since December 2016 as businesses reportedly built up their workforces for future activity. This was as a result of high sentiments towards the 12-month outlook. Price pressures faced by Kenyan firms eased in September, due to the slowed rate of overall input cost inflation, which reached a near two-year low. Firms that saw input prices rise related this to higher taxation and fuel costs, as well as a marginal mark-up of salaries. However, a greater supply of agricultural goods meant that many commodities dropped in price. Consequently, output charges increased only moderately, with the pace of inflation falling to a four-month low. Some attributed the rise in prices of export goods from August to a deterioration in the shilling exchange rate.
|
Macro-Economic & Business Environment Outlook |
|||
|
Macro-Economic Indicators |
YTD 2019 Experience and Outlook Going Forward |
Outlook at the Beginning of the Year |
Current outlook |
|
Government Borrowing |
· We still maintain our expectations of KRA not achieving their revenue targets having been raised by 14.2% in the FY’2019/2020 budget to Kshs 2.1 tn from the Kshs 1.9 tn. In the National Treasury’s budgetary review for the 2018/2019 financial year, revenues collected had increased by 9.2% to Kshs 1.7 tn from Kshs 1.5 tn collected during the 2017/2018 financial year. The revenue collected was 93.1% of the budgetary target for the year. It is doubtful that the KRA will meet its target. This is expected to result in further borrowing from the domestic market to plug in the deficit, which coupled with heavy maturities might lead to pressure on domestic borrowing, · We also remain negative due to the ballooning public debt, as well as the maturity profile of the newly acquired foreign debt as it is relatively short, which raises maturity concentration risk as the country will be in a continuous state of maturing obligations between 2024 and 2028 |
Negative |
Negative |
|
Exchange Rate |
· The Kenya Shilling is expected to remain stable against the US Dollar in the range Kshs 101.0-Kshs 104.0 against the USD in 2019, with continued support from the CBK in the short term through its sufficient reserves currently at USD 9.0 bn (equivalent to 5.6-months of import cover) |
Neutral |
Neutral |
|
Interest Rates |
· The interest rate environment has remained stable in 2019, with the CBR having been retained at 9.0% in the 2 MPC meetings held in Q3’2019. We expect slight upward pressure on interest rates going forward, as the government tries to meet its domestic borrowing targets for the 2019/2020 fiscal year |
Neutral |
Neutral |
|
Inflation |
· Inflation is expected to remain within the government target range of 2.5% - 7.5%. Risks are however abound in the near-term, arising from the late onset of the traditionally long rains season which has disrupted food supply leading to a flare in food inflation, coupled with the continued rise in global fuel prices |
Positive |
Positive |
|
GDP |
· The country's Gross Domestic Product (GDP), adjusted for inflation, rebounded in 2018 having expanded by 6.3% in 2018 from 4.9% recorded in 2017. This was the fastest economic growth since the 8.4% recorded in 2010, and above the 5-year average GDP growth rate of 5.4% |
Positive |
Positive |
|
· GDP growth is projected to range between 5.7%-5.9% in 2019, lower than the 6.3% growth in 2018, but higher than the 5-year historical average of 5.4%. |
|||
|
Investor Sentiment |
· Eurobond yields have been on a declining trend YTD. An improvement was also recorded in foreign inflows in the capital market to a net buying position of USD 1.2 mn Q3’2019 from a net selling position of USD 93.4 mn in Q4’2018, an indication of improved investor sentiments |
Neutral |
Neutral |
|
· We expect improved foreign inflows from the negative position in 2018, mainly supported by long term investors who enter the market looking to take advantage of the current cheap valuations in select sections of the market |
|||
|
Security |
· The political climate in the country has eased. Despite the terror attack experienced during the first half of 2019, Kenya was spared from travel advisories, evidence of the international community’s confidence in the country’s security position |
Positive |
Positive |
Of the 7 indicators we track, 3 are positive, 3 are neutral and 1 is negative. The outlook of the 7 indicators has remained unchanged from the beginning of the year. From this, we maintain our positive outlook on the 2019 macroeconomic environment supported by expectations for strong economic growth at between 5.7%-5.9%, a stable currency, inflation rates within the government’s target, and stable interest rates in 2019.
Money Markets, T-Bills & T-Bonds Primary Auction:
T-bills remained oversubscribed in Q3’2019, with the average subscription rate coming in at 106.8%, a decline compared to 125.5% in Q2’2019. Average subscription rates for the 91-day, 182-day, and 364-day papers in Q3’2019 came in at 121.9%, 44.4% and 163.0%, respectively, from 100.6%, 49.6% and 248.1% in Q2’2019. Yields on the 91-day and 182-day T-bills decreased by 0.4% points and 0.3% points, while that of the 364-day T-bill gained by 1.0% points in Q3’2019, closing at 6.3%, 7.2%, and 9.8%, from 6.7%, 7.5%, and 8.8% for the 91, 182, and 364-day papers, respectively, mainly due to the Central Bank of Kenya’s (CBK’s) efforts to keep rates low by rejecting expensive bids in the auction market.
During the week, T-bills were undersubscribed at a subscription rate of 86.4%, down from 98.4% recorded the previous week attributable to tight liquidity in the market owing to CBK’s actions of mopping up of liquidity through offering attractive rates of about 8.9% on repurchase agreements (repos). The yields on the 182-day and 364-day papers remained unchanged at 7.2% and 9.8%, respectively, while the yield on the 91-day paper increased marginally to 6.4% from 6.3%, the previous week. The acceptance rate declined to 55.2% from 64.9% recorded the previous week, with the government accepting Kshs 15.3 bn of the Kshs 23.6 bn worth of bids received.
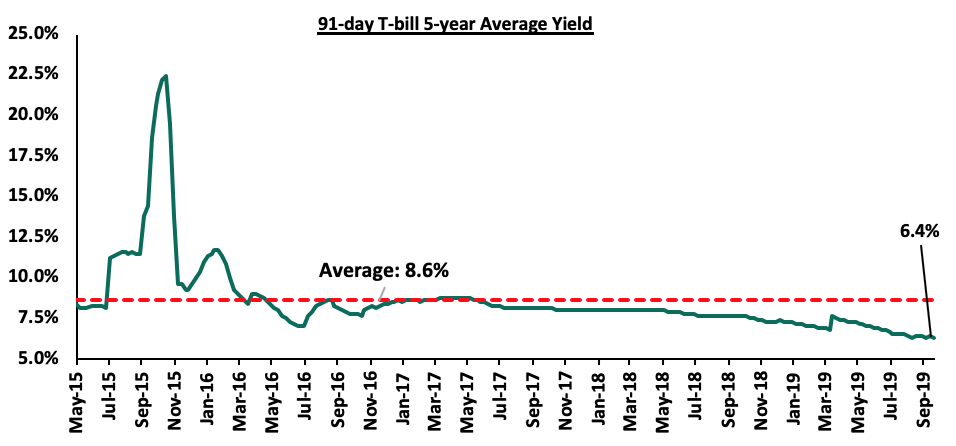
The yield on the 91-day T-bill is currently at 6.4%, below its 5-year average of 8.6%. The lower yield on the 91- day paper is mainly attributed to the low interest rate environment we have been experiencing, and we expect this to continue in the short-term because:
- The rate cap is still in place, which will make it easier for the government to borrow from the domestic market, as institutions will continue channeling funds more actively towards government securities deemed less risky, since the pricing of loans to the private sector is based on the Central Bank Rate as opposed to their risk profiles, and,
- The government domestic borrowing requirement for the 2019/20 financial year has been reduced by 4.8%, to Kshs 305.7 bn from Kshs 321.0 bn, with revenues expected to increase by 14.2% from the previous fiscal year, to Kshs 2.1 tn from Kshs 1.9 tn.
During Q3’2019, the Kenyan Government issued 5 Treasury Bonds, with details in the table below:
|
No. |
Date |
Bond Auctioned |
Effective Tenor to Maturity (Years) |
Coupon |
Amount to be Raised (Kshs bn) |
Actual Amount Raised (Kshs bn) |
Average Accepted Yield |
Subscription Rate |
Acceptance Rate |
|
1 |
29/07/2019 |
FXD3/2019/15 |
15.0 |
12.3% |
40.0 |
50.6 |
12.3% |
216.7% |
58.4% |
|
2 |
19/08/2019 |
FXD3/2019/10 |
10.0 |
11.5% |
50.0 |
45.0 |
11.5% |
105.5% |
85.3% |
|
3 |
19/08/2019 |
FXD1/2019/20 |
20.0 |
12.9% |
14.7 |
12.7% |
29.3% |
100.0% |
|
|
4 |
23/09/2019 |
FXD1/2018/15 (Re-open) |
15.0 |
12.7% |
50.0 |
15.3 |
12.6% |
30.5% |
100.0% |
|
5 |
23/09/2019 |
FXD2/2019/15 |
15.0 |
12.7% |
17.4 |
12.7% |
34.7% |
100.0% |
|
|
|
Average |
|
|
|
|
|
|
83.3% |
88.7% |
Performance in the Primary T-bond auctions in Q3’2019 was varied between the various issues, with the subscription rate averaging 83.4%. The average acceptance rate for Q3’2019 came in at 88.7%, as the CBK continued to reject bids deemed expensive in order to maintain the rates at low levels.
During the week, the CBK re-opened two T-bonds; FXD1/2018/15 and FXD2/2019/15 through a tap sale. The bonds were undersubscribed at an overall subscription rate of 31.2%. The yield came in at 12.6% for FXD1/2018/15 and 12.7% for FXD2/2019/15. The acceptance rate came in at 100.0%, meaning the government accepted all the bids received, which were worth Kshs 9.3 bn, against Kshs 30.0 bn on offer.
Green Bond
During the week, Acorn Group announced that the country’s first ever green bond issued by the company, in partnership with PE Fund Helios, had attracted an 85.0% subscription rate, raising Kshs 4.3 bn of the targeted amount of Kshs 5.0 bn. The notes have been certified as ‘Green Bonds’ based on Acorn’s compliance with Climate Bonds Standards through the Climate Bonds Standard Board, who approved the Pre-issuance Certificate of the bond. The criteria to meet the Climate Bonds Standard principles include water, energy and materials efficiency. Under water efficiency, an independent verifier will look at the use of low flow showerheads and faucets for kitchen sinks and wash basins. In terms of energy efficiency, the verifier will look at natural ventilation, smart meters and sensor lighting. For material efficiency, they will focus on materials used for floor slabs, roof slabs and aluminium window frames.
The bond was priced at a rate of 12.3%, and will be used to finance sustainable and climate-resilient student accommodation with a combined capacity of 40,000 beds. According to the company’s CEO, Edward Kirathe, the first tranche of the medium-term note targeted to raise Kshs 2.0 bn given that the local bond market has not witnessed any corporate bond issue since 2017, attributable to defaults witnessed over the past five-years by issuers such as ARM Cement, Nakumatt and Imperial Bank. Contrary to expectations, the market has been receptive and the company attributes this to having GuarantCo as its guarantor, which sparked investor confidence. According to the company, the investor mix comprised mainly of pension funds, commercial banks, and development finance institutions accounting for 30.0% each, while insurance firms took up 10.0%. The lead arrangers of the issue, Stanbic Investment Bank, recommended that prospective issuers of bonds will have to enhance their credit risk profiles to be able to be successful, citing that it was important to outline the benefits, risk and engage early on a non-deal roadshow in order to spark interest.
According to report done by the IFC, a green bond is a fixed-income instrument whose distinguishing feature is that proceeds are earmarked exclusively for projects with environmental benefits. These include: renewable energy, adaptation to climate change, waste management, pollution prevention, water management and green buildings, just to name a few. The green bond market was launched in Kenya in February 2019, through the Green Bonds Programme Kenya, which is a joint initiative between the Central Bank of Kenya, Nairobi Securities Exchange, Climate Bonds Initiative and Kenya Bankers Association with several other organizations endorsing the program. Similar to infrastructure bonds, the instruments will be tax-free following changes in the proposed Finance Bill 2019 which is still going through the legislative process in parliament. In our view, the introduction of the green bond is a pro-active and good initiative by the Capital Markets Authority, which will benefit both investors and the stakeholders in the long-run considering its focus on environmental issues and a more sustainable economy.
Money Market Funds
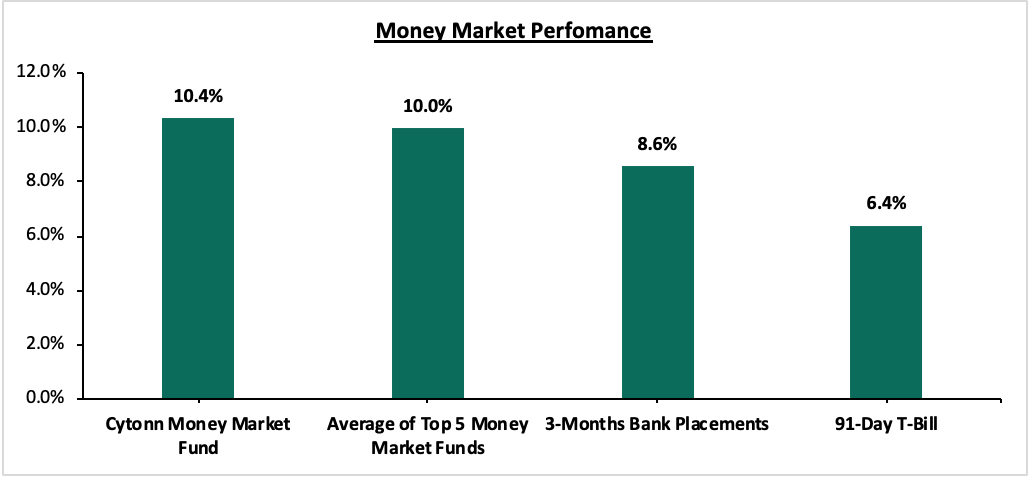
In the money markets, 3-month bank placements ended the week at 8.6% (based on what we have been offered), the 91-day T-bill came in at 6.4%, while the average of Top 5 Money Market Funds by yield came in at 10.0%, unchanged from the previous week, with the Cytonn Money Market Fund closing the week at 10.4%.
Liquidity
Liquidity tightened during Q3’2019 as indicated by an increase in the average interbank rate to 4.1%, from 3.7% recorded in H1’2019. During the week, liquidity tightened with the average interbank rate increasing to 7.5%, from 7.3% recorded the previous week, attributable to CBK’s actions of mopping up of liquidity through offering attractive rates of about 8.9% on repurchase agreements (repos) which is posing stiff competition for smaller banks. This saw commercial banks’ excess reserves increase to come in at Kshs 13.0 bn in relation to the 5.25% cash reserves requirement (CRR), from Kshs 14.4 bn the previous week. The average volumes traded in the interbank market decreased by 14.9% to Kshs 6.2 bn, from Kshs 7.3 bn the previous week.
Kenya Eurobonds:
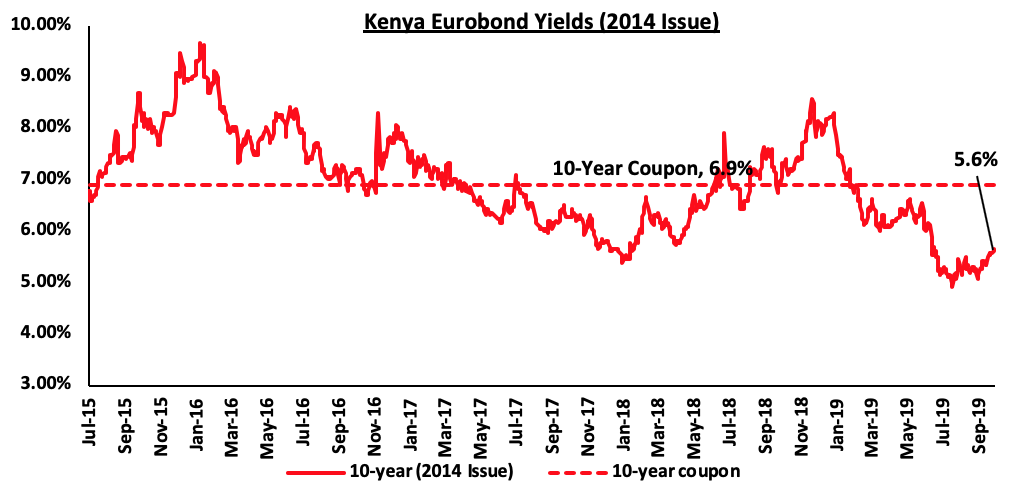
The yields on the 10-Year Eurobond issued in 2014 have increased marginally by 0.1% points to 5.6%, from 5.5% seen in Q2’2019. The rise in Eurobond yields in the past four weeks has been attributable to news that global rating firm Moody’s could further lower Kenya’s creditworthiness currently at ‘B2 stable’ following the completion of their periodic review on Kenya, where they raised concern over the country's very low fiscal strength, ballooning debt and rampant corruption.
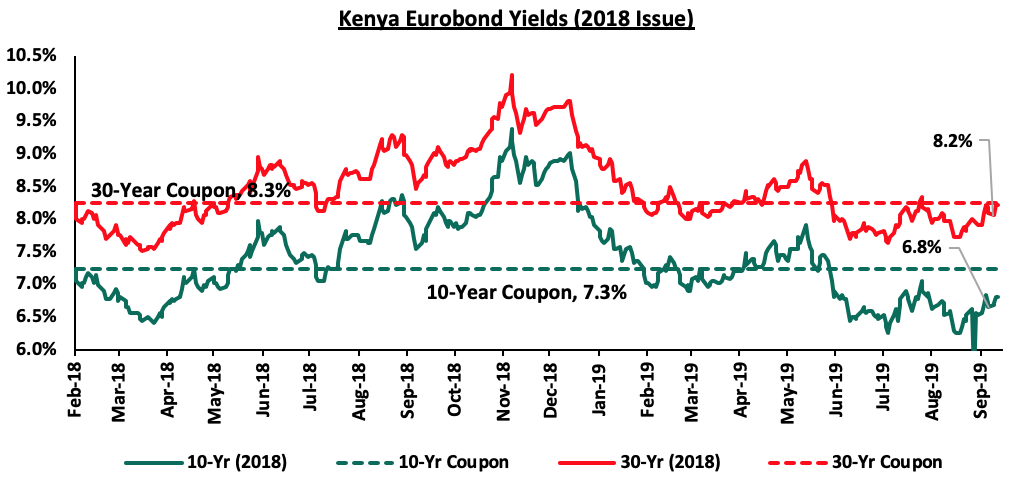
For the February 2018 Eurobond issue, since the issue date, yields on the 10-year Eurobond have decreased by 0.4% points to close Q3’2019 at 6.7% while the 30-year Eurobond has decreased by 0.2% points to close the quarter at 8.1%. During the week, the yields on the 10-year and 30-year Eurobond both increased by 0.1% points to 6.8% and 8.2%, from 6.7% and 8.1% recorded the previous week.
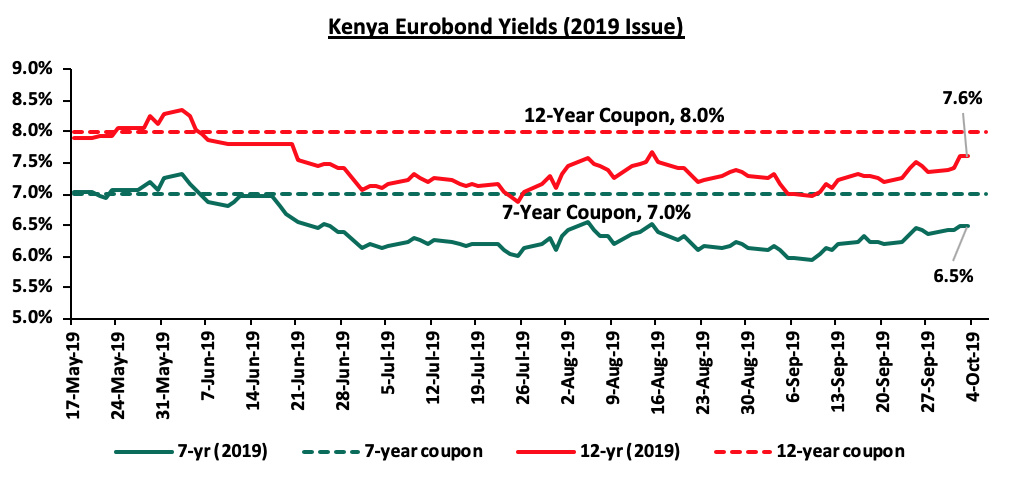
For the latest issued dual-tranche Eurobond during Q3’2019, with 7-years and 12-years tenor, priced at 7.0% for the 7-year tenor and 8.0% for the 12-year tenor, respectively; the yield on the 7-year bond gained by 0.1% points to 6.5% from 6.4% recorded in the previous week, while the 12-year bond gained by 0.2% points to 7.6% from 7.4% recorded in the previous week.
Rates in the fixed income market have remained relatively stable as the government rejects expensive bids. The Government failed to meet its FY’2018/2019 domestic target narrowly by 1.3%, having borrowed Kshs 317.0 bn against a target of Kshs 321.0 bn. A budget deficit is likely to result from depressed revenue collection with the revenue target for FY’2019/2020 at Kshs 2.1 tn, creating uncertainty in the interest rate environment as additional borrowing from the domestic market goes to plug the deficit. Despite this, we do not expect upward pressure on interest rates due to increased demand for government securities, driven by improved liquidity in the market owing to the relatively high debt maturities. Our view is that investors should be biased towards medium-term fixed income instruments to reduce duration risk associated with long-term debt, coupled with the relatively flat yield curve on the long-end due to saturation of long-term bonds.
Market Performance
During Q3’2019, the equities market was on a downward trend, with NASI, NSE 20 and NSE 25 declining by 3.0%, 8.3%, and 4.3%, respectively, taking their YTD performance as at the end of September to gains and losses of 3.6%, (14.2%) and (2.9%) for NASI, NSE 20 and NSE 25, respectively. The equities market performance during the quarter was shaped by declines in large caps such as Bamburi, Equity Group, and Safaricom, which declined by 17.9%, 3.9%, and 2.1%, respectively. During the week, the equities market was on an upward trend, with NASI, NSE 20 and NSE 25 gaining by 1.8%, 1.6%, and 1.5%, respectively, taking their YTD performance to gains and losses of 4.8%, (13.9%) and (1.3%), respectively. The performance in NASI during the week was driven by gains in Safaricom, BAT, Co-operative Bank of Kenya, and Standard Chartered Bank, which gained by 3.5%, 2.9%, 2.1% and 1.9%, respectively.
Equities turnover declined by 7.5% during the quarter to USD 289.6 mn, from USD 313.1 mn recorded in Q2’2019, taking the YTD turnover to USD 1.1 bn. During the week, equities turnover increased by 1.5% to USD 25.6 mn, from USD 25.2 mn the previous week. In the quarter under review, foreign investors were net buyers, with a net buying position of USD 0.8 mn, a 9.4% decline from the net buying position of USD 14.9 mn recorded in Q2’2019. During the week, foreign investors remained net buyers for the week, with a net buying position of USD 2.2 mn, a 13.6% decline from a net buying position of USD 2.6 mn the previous week.
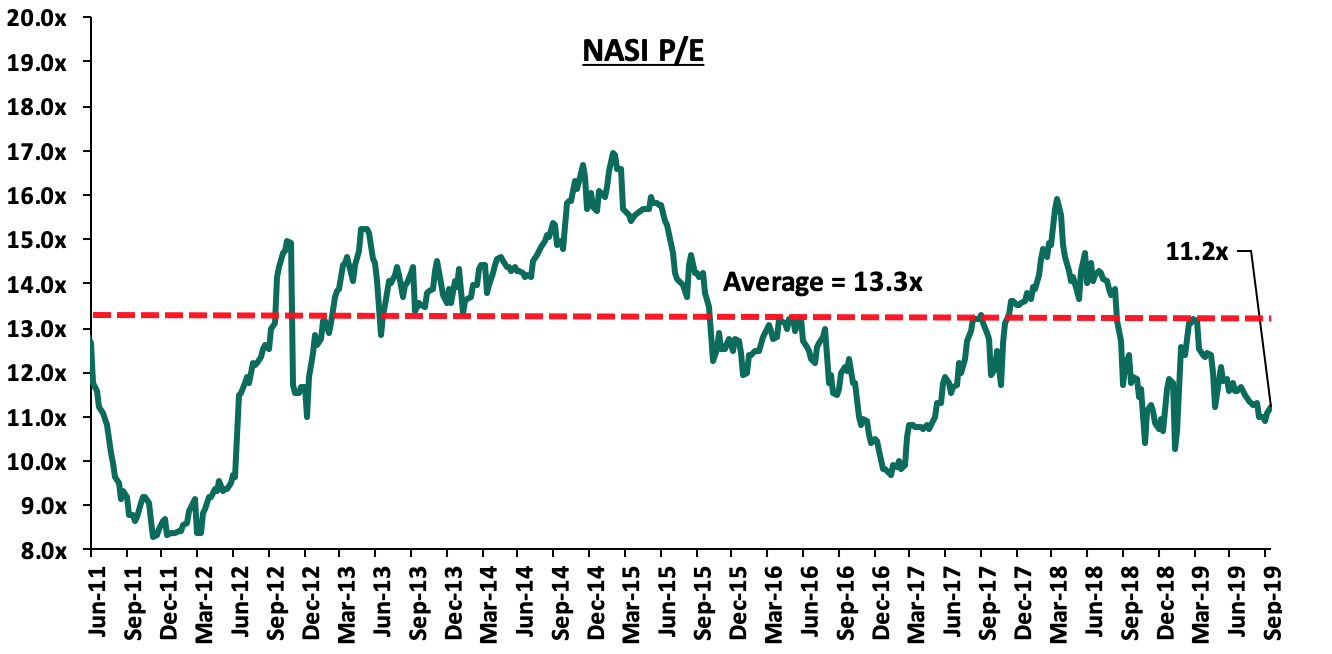
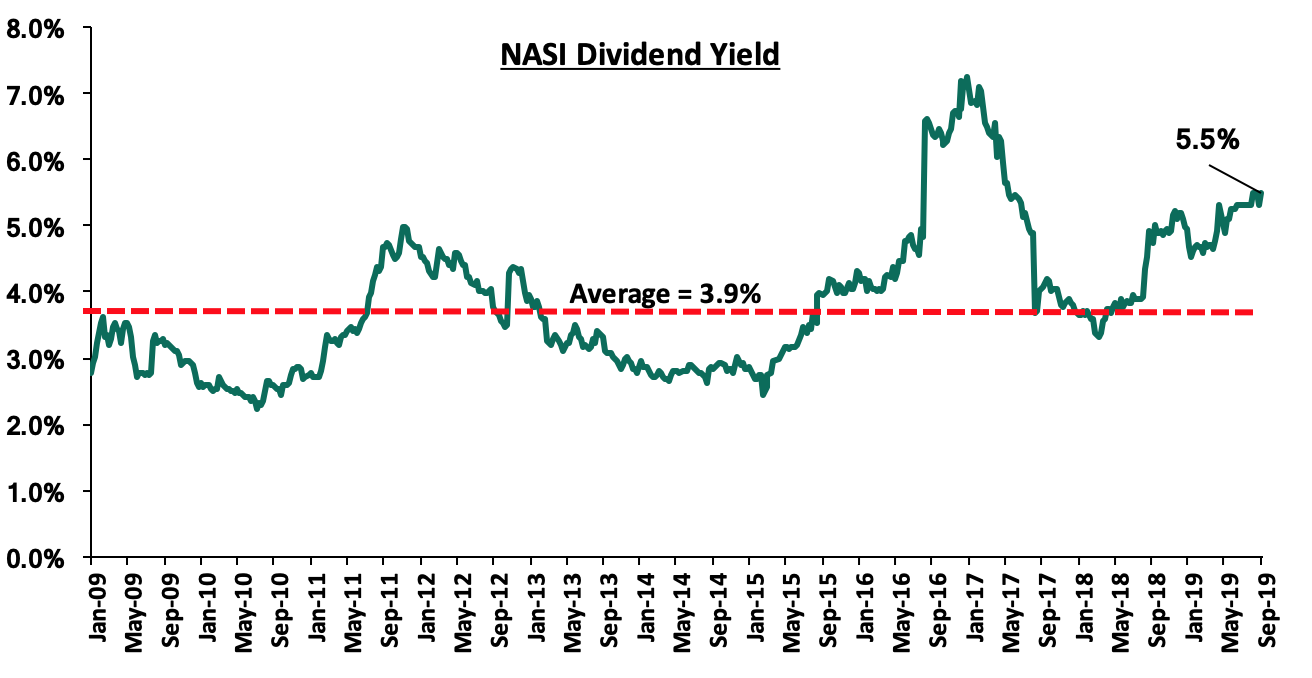
The market is currently trading at a price to earnings ratio (P/E) of 11.2x, 15.5% below the historical average of 13.3x, and a dividend yield of 5.5%, above the historical average of 3.9%. With the market trading at valuations below the historical average, we believe there is value in the market. The current P/E valuation of 11.2x is 15.9% above the most recent trough valuation of 9.7x experienced in the first week of February 2017, and 35.4% above the previous trough valuation of 8.3x experienced in December 2011. The charts below indicate the historical P/E and dividend yields of the market.
Listed Banks H1’2019 Results:
The table below highlights the performance of the banking sector, showing the performance using several metrics, and the key take-outs of the performance. For more details, see our H1’2019 Banking Report here.
|
Bank |
Core EPS Growth |
Interest Income Growth |
Interest Expense Growth |
Net Interest Income Growth |
Net Interest Margin |
Non-Funded Income Growth |
NFI to Total Operating Income |
Growth in Total Fees & Commissions |
Deposit Growth |
Growth in Government Securities |
Loan to Deposit Ratio |
Loan Growth |
Return on Average Equity |
|
Barclays Bank Kenya |
18.0% |
7.4% |
30.8% |
0.6% |
8.4% |
12.6% |
32.4% |
11.1% |
5.9% |
15.4% |
81.3% |
6.0% |
18.1% |
|
I&M Bank |
17.0% |
8.8% |
18.3% |
2.2% |
6.0% |
21.9% |
39.3% |
6.0% |
12.5% |
28.5% |
72.6% |
5.7% |
17.7% |
|
Stanbic Holdings |
14.4% |
10.5% |
5.2% |
19.5% |
5.1% |
10.1% |
47.8% |
53.2% |
10.3% |
8.1% |
74.4% |
15.0% |
15.3% |
|
Diamond Trust Bank |
11.0% |
(6.6%) |
(5.5%) |
(7.5%) |
6.0% |
8.5% |
24.5% |
(15.6%) |
0.5% |
14.4% |
67.4% |
(3.8%) |
13.9% |
|
Equity Group |
9.1% |
9.2% |
14.3% |
7.6% |
8.5% |
25.6% |
44.0% |
16.1% |
16.5% |
13.0% |
70.0% |
16.7% |
22.1% |
|
NIC Group |
8.6% |
0.9% |
(7.0%) |
7.7% |
6.0% |
23.9% |
32.5% |
29.3% |
3.5% |
8.1% |
77.8% |
3.1% |
12.0% |
|
SCBK |
5.4% |
(7.3%) |
(26.0%) |
0.0% |
7.6% |
(2.2%) |
32.4% |
(12.8%) |
(1.0%) |
(15.2%) |
52.5% |
7.4% |
18.2% |
|
KCB Group |
5.0% |
4.3% |
1.6% |
5.2% |
8.2% |
14.7% |
34.1% |
3.5% |
7.3% |
20.3% |
85.0% |
13.6% |
22.7% |
|
Co-operative Bank |
4.6% |
(1.7%) |
3.5% |
(3.8%) |
8.4% |
25.1% |
38.0% |
38.1% |
9.0% |
14.2% |
79.6% |
2.6% |
18.8% |
|
National Bank of Kenya |
(40.1%) |
7.3% |
(14.4%) |
20.0% |
8.2% |
(28.7%) |
19.4% |
(4.6%) |
(4.9%) |
(17.5%) |
51.8% |
(1.0%) |
6.7% |
|
HF Group |
N/A |
(15.6%) |
(9.8%) |
(23.5%) |
4.0% |
55.8% |
47.1% |
44.4% |
(6.6%) |
5.4% |
91.0% |
(14.8%) |
(6.5%) |
|
H1'2019 Mkt Weighted Average* |
9.0% |
3.7% |
5.3% |
3.8% |
7.7% |
16.5% |
37.2% |
12.7% |
8.6% |
12.1% |
73.8% |
9.8% |
19.3% |
|
H1'2018 Mkt Weighted Average** |
19.0% |
7.9% |
12.0% |
6.4% |
8.1% |
6.9% |
34.3% |
4.6% |
10.0% |
14.9% |
73.8% |
3.8% |
19.5% |
|
*Market cap weighted as at 6/09/2019 **Market cap weighted as at 31/08/2018 |
|||||||||||||
Key takeaways from the table above include:
- Kenya Listed Banks recorded a 9.0% average increase in core Earnings per Share (EPS), compared to a growth of 19.0% in H1’2018. As a result, the Return on Average Equity decreased marginally to 19.3% compared to 19.5% recorded a similar period in 2018,
- Deposit growth came in at 8.6%, slower than the 10.0% growth recorded in H1’2018. On the other hand, interest expense increased at a slower pace of 5.3%, compared to 12.0% in H1’2018, indicating that banks have been able to mobilize relatively cheaper deposits. In addition, the removal of the 70.0% minimum deposit payable on deposits in the Finance Act 2018 reduced the cost of deposit funding,
- Average loan growth came in at 9.8%, which was faster than the 3.8% recorded in H1’2018, indicating that there was an improvement in credit extension to the economy. Government Securities on the other hand recorded growth of 12.1%, which was a slower growth rate compared to the 14.9% in H1’2018. This shows that banks have begun to adjust their business models, focusing more on private sector lending as opposed to investing in government securities, whose yields declined during the year. Interest income increased by 3.7%, slower than the 7.9% recorded in H1’2018. Consequently, the Net Interest Income grew by 3.8%, slower than the 6.4% recorded in H1’2018,
- The average Net Interest Margin in the sector came in at 7.7%, lower than the 8.1% in H1’2018. The decline was mainly due to a decline in yields recorded in government securities, coupled with the decline in yields on loans due to the 100-bps decline in the Central Bank Rate, and,
- Non-Funded Income grew by 16.5% y/y, faster than the 6.9% recorded in H1’2018. The growth in NFI was boosted by the total fee and commission income which improved by 12.7%, compared to the 4.6% growth recorded in H1’2018, owing to the faster loan growth.
Quarterly Highlights
During the quarter;
- The Central Bank of Kenya (CBK) announced the issuance of the final regulatory approval for the merger between Commercial Bank of Africa (CBA) and NIC Group. The final approval of the transaction comes after the approval by the Cabinet Secretary of the National Treasury on 20th September 2019, under Section 9 of the Banking Act, which guides on amalgamations and transfer of assets and liabilities for banking institutions, as highlighted in our Cytonn Weekly #39/2019,
- KCB Group revised its final offer to take over 7.5% of the deposits and loans held by Imperial Bank Limited Under Receivership (IBLR) as at the end of July 2019, after the bank conducted extensive due diligence on IBLR. With approximately Kshs 53.0 bn outstanding deposits, this translates to a final payout of approximately Kshs 3.975 bn, bringing the final recovery rate to approximately 38.0%. The transaction has seen 92.0% depositors who held deposits in IBLR gain access to their deposits. We thus continue to maintain our view that a resolution of the matter would mark the second instance a bank is successfully brought out of receivership, thereby providing more confidence in the Kenyan financial services space regulation, which provides an avenue for remediation of collapsed entities as well as providing protection for depositors’ funds. For more information, see here,
- The Banking Amendment Bill was tabled in the National Assembly. The Bill seeks to seal the loopholes in the wordings of the Banking (Amendment) Act 2015. In March 2019, the High Court suspended the Banking (Amendment) Act 2015 in a ruling that declared Section 33B (1) and (2) of the Banking Act unconstitutional, and gave the National Assembly one year to amend the anomalies, failure to which will mean a reversion to a free-floating interest rates regime. For more details, please see our Cytonn Weekly #30/2019,
- CIC Group announced the redemption of its 5-year corporate bond issued in October 2014 of Kshs 5.0 bn, with a coupon rate of 13.0%, which will be redeemed in October 2019. The bond was issued to fund CIC’s regional expansion into Uganda and Malawi, as well as bolstering the capital requirements of the insurer's subsidiaries, and supporting investments in their medical and real estate projects. For more details, please see our Cytonn Weekly #39/2019, and,
- Barclays Bank of Kenya announced that three of its branches namely, Bamburi, Maragua and Supplies, were up for sale, valued at Kshs 65.0 mn. This is in line with the lender’s strategy of deepening digital channels to accommodate the changing pattern of customer preferences towards alternate channels. Previously, in FY’2017, the lender closed 13 branches as part of its consolidation strategy and drive to achieve operational efficiencies. For a more detailed analysis, please see our Cytonn Weekly #27/2019.
Universe of Coverage
|
Banks |
Price at 4/10/2019 |
w/w change |
q/q change |
YTD Change |
Target Price* |
Dividend Yield |
Upside/ Downside** |
P/TBv Multiple |
Recommendation |
|
I&M Holdings |
45.1 |
7.4% |
(18.2%) |
5.9% |
79.8 |
7.8% |
84.7% |
0.8x |
Buy |
|
Sanlam |
17.4 |
(7.2%) |
(8.5%) |
(14.8%) |
29.0 |
0.0% |
66.7% |
0.8x |
Buy |
|
KCB Group*** |
41.9 |
(7.0%) |
9.8% |
12.1% |
61.4 |
8.3% |
54.9% |
1.1x |
Buy |
|
Diamond Trust Bank |
115 |
1.3% |
(3.2%) |
(27.2%) |
175.6 |
2.3% |
55.0% |
0.6x |
Buy |
|
Equity Group*** |
37.9 |
1.2% |
(3.9%) |
7.5% |
53.0 |
5.3% |
45.2% |
1.6x |
Buy |
|
Co-operative Bank*** |
12.1 |
2.1% |
(0.8%) |
(16.8%) |
15.0 |
8.4% |
32.8% |
1.0x |
Buy |
|
NIC Group |
29.5 |
3.3% |
(2.1%) |
7.7% |
37.9 |
3.3% |
32.0% |
0.6x |
Buy |
|
Kenya Reinsurance |
3.0 |
2.7% |
(23.1%) |
(17.2%) |
3.8 |
5.2% |
30.6% |
0.1x |
Buy |
|
Britam |
7.0 |
(0.3%) |
(13.7%) |
(30.2%) |
8.8 |
4.9% |
30.3% |
0.7x |
Buy |
|
Barclays Bank*** |
11.2 |
1.8% |
4.8% |
0.0% |
12.6 |
10.0% |
22.3% |
1.4x |
Buy |
|
CIC Group |
3.1 |
(0.7%) |
(13.5%) |
(20.5%) |
3.8 |
4.2% |
28.8% |
1.2x |
Buy |
|
Liberty Holdings |
9.7 |
0.2% |
(7.0%) |
(24.7%) |
11.3 |
5.1% |
21.2% |
0.7x |
Buy |
|
Jubilee holdings |
346.0 |
(1.1%) |
(12.4%) |
(13.5%) |
418.5 |
2.6% |
23.5% |
1.0x |
Accumulate |
|
Standard Chartered |
198.0 |
1.9% |
2.7% |
2.7% |
208.0 |
6.3% |
11.3% |
1.5x |
Accumulate |
|
Stanbic Holdings |
96.3 |
0.3% |
0.0% |
5.8% |
100.5 |
6.1% |
10.5% |
1.1x |
Accumulate |
|
HF Group |
6.9 |
(4.7%) |
75.6% |
27.1% |
2.8 |
0.0% |
(60.2%) |
0.2x |
Sell |
|
*Target Price as per Cytonn Analyst estimates **Upside / (Downside) is adjusted for Dividend Yield ***Banks in which Cytonn and/or its affiliates are invested in |
|||||||||
We are “Positive” on equities for investors as the sustained price declines has seen the market P/E decline to below its historical average. We expect increased market activity, and possibly increased inflows from foreign investors, as they take advantage of the attractive valuations, to support the positive performance
Financial Services
Deals in the financial services sector in the quarter include;
- Interswitch, a Nigeria-based payments firm that is owned 60.0% by Helios Investment Partners, announced that it has hired advisors, including JPMorgan Chase & Co., Citigroup Inc. and Standard Bank Group Ltd to revive plans for a stock-market listing in London and Lagos later this year. According to Reuters, the value of the financial technology company is speculated to be between USD 1.3 bn to USD 1.5 bn. For more information, see our Cytonn Weekly #30.
- Actis, a UK based private equity investor, took over the management rights of the Abraaj Private Equity Fund IV (APEF IV), a global buyout fund, and Abraaj Africa Fund III (AAF III), a Sub-Saharan investment fund. APEF IV has made investments worth USD 1.6 bn (Kshs 165.2 bn) in the Middle East and Africa while AAF III has a portfolio of investments in Africa. This transaction follows the collapse of Abraaj group, a global private equity firm based in the United Arab Emirates (UAE), following the liquidation case the firm currently faces. For more information, see our Cytonn Weekly #29.
- Sterling Capital, a Kenyan-based investment bank, acquired a 20.0% stake in Afvest, a Nairobi-based emerging markets private equity firm for an undisclosed value. Afvest focuses on early-stage businesses in the financial services, energy, agro-processing and technology sectors. This acquisition is in line with the two firms’ strategy of investing in early-stage businesses and entrepreneurs with the potential to generate high returns. For more information, see our Cytonn Weekly #28.
- TLG Capital, a frontier markets Investment Company based in England, announced a USD 10.0 mn investment in Tanzania based Platcorp Holdings Limited, the holding company of Platinum Credit - a Kenyan micro-finance company, through its Credit Opportunities Fund (COF). Platcorp Holdings Limited focuses on investments in its microfinance and non-banking subsidiaries. For more information, see our Cytonn Weekly #27.
- Oiko Credit, a Netherland’s based private equity firm, acquired a 22.8% stake in Credit Bank. The stake acquired was through a capital injection of Kshs 1.0 bn. For more information, see our Cytonn Monthly - August 2019.
Fundraising
- Investment firm Centum, through its real estate arm Centum Real Estate, signed a refinancing deal with Nedbank Corporate and Investment Bank (CIB), which is Nedbank’s property finance division. They managed to raise Kshs 6.5 bn from the South Africa-based firm. These funds will allow the firm to consolidate the debt facilities for the Two Rivers development, which is the firm’s biggest project. The development is currently in its second phase, which will utilize the 102 acres the company owns on Limuru Road in Nairobi, near the affluent neighborhoods of Runda, Nyari, Gigiri and Muthaiga. For more information, see our Cytonn Weekly #30.
- OPay, a Nigerian based mobile payment platform, raised USD 50.0 mn (Kshs 5.1 bn) in its first round of funding. The startup, founded by Norwegian browser company Opera in 2018, aims to use the capital for expansion to other African Markets including Tanzania, Ghana and South Africa where Opera reaches 120 mn customers across the region and to support Opera’s commercial network in Nigeria which includes ORide, a motorcycle ride-hailing app and OFood, a food delivery service application. For more information, see our Cytonn Weekly #28.
- Lulalend, a South African digital lender, raised USD 6.5 mn in its Series A round funding, which was co-led by the International Finance Corporation (IFC) and Quona Capital. The startup, based in Cape Town, provides short-term loans to small and medium-sized businesses (SMEs) that are often unable to obtain working capital. The funds raised will be used to build its staff capacity and strengthen its balance sheet, in order to provide financing to more SMEs in South Africa by expanding its loan book to USD 100.0 mn. For more information, see our Cytonn Weekly #27.
- Tala, a California-based FinTech company with operations in Kenya, raised Kshs 11.4 bn (USD 110.0 mn) in a Series D financing round (the fourth round of capital injection from external investors) led by RPS Ventures, a California-based venture capital firm. Other investors in the round include GGV Capital, and previous investors IVP (Institutional Venture Partners), Revolution Growth, Lowercase Capital, Data Collective VC, ThomVest Ventures and PayPal Ventures. The new investment builds on PayPal Ventures’ strategic investment in Tala, announced in November 2018. This funding round brings the total amounts raised by Tala to over Kshs 22.6 bn (USD 219.4 mn). For more information, please see our Cytonn Weekly #34/2019.
- Accion, through its seed-stage investment arm, Accion Venture Lab, raised USD 23.0 mn (Kshs 2.4 bn), for a new FinTech start-up fund. The capital for the new fund was raised through contributions from various participants including Ford Foundation, Prudential Financial, Blue Haven Initiative, Visa Inc. and Proparco (the development finance institution of the French Government). The firm intends to allocate approximately 25% - 30% of the funds to Africa where their focus will be on start-ups that leverage technology to increase the reach, quality and affordability of financial services for the under-served. For more information, please see our Cytonn Weekly #37/2019.
Education
- Investisseurs & Partenaires (I&P), a Sub-Saharan impact investing firm based in Paris, France, announced plans to invest EUR 70.0 mn (Kshs 8.1 bn) in Africa’s education sector with the aim of addressing the challenges of access, equity, quality and adequacy of education in Africa. For more information, see our Cytonn Weekly #29.
- The Danish SDG (Sustainable Development Goals) Investment Fund invested Danish Krone (DKK)0 mn (Kshs 692.5 mn) in Africa Education Holding, which offers affordable high-quality programmes in labour market relevant studies of medicine, business, IT, law and social sciences, for an undisclosed stake. This was done in collaboration with Proparco, the French development agency, who invested USD 7.0 mn (Kshs 726.9 mn) as well as Finnfund, the Finnish development agency which invested an undisclosed amount. For more information, please see our Cytonn Weekly #38/2019.
Hospitality
- Amethis, an Africa-focused investment fund manager, acquired a stake in Veranda Leisure & Hospitality (VLH), a subsidiary of Rogers Group, a listed company on the Stock Exchange of Mauritius, with the funds intended to be directed towards projects under VLH through new leisure activities and accommodation offerings. For more information, please see our Cytonn Weekly #37/2019.
FinTech
- Mobile lender, Branch International, through Barium Capital, announced the issuance of its fourth commercial paper and full repayment of its previous issue worth Kshs 500.0 mn. To date, the firm has been able to raise Kshs 16.5 bn from the private capital market. For more information, see our Cytonn Monthly - July 2019.
- Juhudi Kilimo, a Kenyan based microfinance institution, raised EUR 2.2 mn (Kshs 252.2 mn) in equity capital from Incofin CVSO, a fund managed by Belgian based Incofin Investment Management, for an undisclosed stake. This will be Incofin’s first equity investment in the country, adding to its expansive portfolio, which includes over 325 investments in 65 countries, with a combined value of over USD 1.0 bn, focused on growing the financial services industry in developing countries. For more information, please see our Cytonn Weekly #33/2019.
- TechAdvance, a Nigerian based payment application development company, raised USD 1.0 mn (Kshs 103.5) mn in equity funding from Lamar Holding, an energy investment company based in Bahrain. TechAdvance will use this funding to support its expansion strategy, aimed at widening its coverage in Africa as well as reaching out to other markets globally, having gotten approval from the Central Bank of Bahrain to operate a payment solutions service business, in addition to a similar license from the Central Bank of Nigeria, indicating that the firm intends to leverage the partnership with Lamar Holdings to cross into the Middle Eastern market. For more information, please see our Cytonn Weekly #33/2019.
- In the FinTech sector, FairMoney, a Paris-based FinTech startup focused on Nigeria, closed a Series A round of investment, raising USD 10.0 mn (Kshs 1.0 bn), led by Flourish, a venture of The Omidyar Group, a family-founded impact investment firm with operations in Asia, North America and Africa. The funding round was also boosted by existing seed investors; DST Global, a Hong Kong-based investment company that funds late-stage ventures in the global internet industry, Newfund, and Le Studio VC, French venture capital firms, and Speedinvest, an Austrian venture capital firm. For more information, please see our Cytonn Weekly #38/2019.
- Development Partners International, a London-based Africa-focused private equity firm, in collaboration with Convergence Partners, a South-African impact investment company, announced an investment of USD 54.0 mn (Kshs 5.6 bn) in Channel VAS, a FinTech company with operations in Africa, Asia and the Middle East that advances micro-credit to individuals through mobile money transfer, for an undisclosed stake. For more information, please see our Cytonn Weekly #39/2019.
Reports
During the quarter, the following private equity reports were released;
- KPMG East Africa and East Africa Venture Capital Association (EAVCA) released a joint report, Private Equity Sector Survey of East Africa, which looks into the private equity market over the period spanning 2017 and 2018, with a keen focus on the shift in trends in the private equity space since 2016. The report highlighted an improvement in deal activity in 2017 and 2018, with 33 and 51 deals disclosed, respectively, as well as the number of PE funds investing in East Africa increased to 97 up from 72 recorded in a similar study conducted between 2015 and 2016. For more information, please see our Cytonn Weekly #32/2019.
- During the quarter, Emerging Markets Private Equity Association (EMPEA), a global industry association for private capital in emerging markets, released their Mid-Year 2019 Statistics Report, which gives a snapshot of the global private equity space, particularly on the fundraising space, highlighting a significant drop in funds raised towards private equity, to USD 165.0 bn (Kshs 17.1 tn) in H1’2019, less than 33.0% of the USD 505.6 bn (Kshs 52.4 tn) raised in FY’2018. For more information, please see our Cytonn Weekly #39/2019.
We maintain a positive outlook on private equity investments in Africa as evidenced by the increasing investor interest, which is attributed to; (i) economic growth, which is projected to improve in Africa’s most developed PE markets, (ii) attractive valuations in Sub Saharan Africa’s private markets compared to its public markets, and (iii) attractive valuations in Sub Saharan Africa’s markets compared to global markets. Going forward, the increasing investor interest, stable macro-economic and political environment will continue to boost deal flow into African markets.
In Q3’2019, the real estate sector recorded an array of activities across the various themes supported by the Kenyan Government’s focus on the affordable housing initiative and continued infrastructural improvement. As per the Kenya National Bureau of Statistics (KNBS) Quarterly Gross Domestic Product Report Q2'2019, the real estate sector improved with the sector’s growth rate coming in at 5.4% in Q2’2019, 0.8% points higher than 4.6% recorded in Q2’2018. The construction sector’s growth rate increased to 7.2% in Q2’2019, from 5.4% in Q2’2018, attributable to ongoing public infrastructure projects especially the construction of roads and Phase Two of the Standard Gauge Railway.
During the quarter, the key challenge was the delay in the processing of construction permits by some county governments such as Nairobi and Kiambu, which continues to affect developers by prolonging project implementation timelines. The delays have mainly been as a result of the e-permit system downtime, inadequate staffing, and suspension of planning committees of the Nairobi, Kisumu, Kiambu, and Mombasa County Governments. Currently, construction permits in Kenya can take as long as two years and this has greatly affected Kenya’s rank in the global Ease of Doing Business Index by World Bank. As of 2018, Kenya’s rank dropped four ranks to #128 from #124 in 2017 in terms of ease of obtaining construction permits, owing to lack of improvements on the system, and the situation has only worsened in 2019, and thus, we expect Kenya’s rank in 2019 to drop further. Industry players such as the Architectural Association of Kenya (AAK) and the Kenya Private Developers Association (KPDA) have decried over the matter calling for an immediate resolution of the matter. This is especially critical as the government attempts to deliver the affordable housing initiative through public-private partnerships. Delays in the approval system ultimately leads to unnecessarily high development costs for private developers.
Other challenges facing the sector include; (i) access to financing with private sector credit growth coming in at 5.2% in June 2019, compared to a 5-year (2013-2018) average of 14.0%, and (ii) oversupply in select sectors such as the commercial office and retail sectors with a surplus of 5.2mn SQFT and 2.0mn SQFT, respectively, as at 2018.
- Residential Sector
During Q3’2018, construction activity in the residential sector picked up. Key developments included:
- The County Government of Nairobi commenced works on the Pangani Regeneration Project, one of the 7 flagship projects earmarked for Nairobi County as part of the Kenyan Government’s Affordable Housing Initiative. For more, see Cytonn Weekly #29/2019,
- Cytonn Real Estate, the development affiliate of Cytonn Investments, handed over the first phase of its Ruaka project, The Alma, after full uptake of the 16 one-bedrooms, 70 two-bedroom and 27 three-bedroom units selling at Kshs 6.3 mn, Kshs 9.9 mn and Kshs 12.9 mn, respectively. For more, see Cytonn Weekly #29/2019,
- Centum Real Estate broke ground on its Riverbank Apartments Project, consisting of 160-units, within the Two Rivers development complex, along Limuru Road. For more, see Cytonn Weekly #32/2019,
- Chinese developers Erdemann Properties launched Phase III of their Greatwall Gardens Project in Athi River. For more see Cytonn Weekly #32/2019,
- Safaricom Investment Co-operative (SIC) unveiled its gated community development, dubbed “The Zaria Village”, located in Kiambu County off the Ruiru-Kiambu Bypass. For more, see Cytonn Weekly #37/2019, and
- The government’s aim of improving the mortgage market also took shape as the Central Bank of Kenya finally gazetted the Mortgage Refinancing Companies regulations, which are especially critical for the commencement of operations of the Kenya Mortgage Refinancing Company. For analysis, see Cytonn Weekly #34/2019.
Market Performance
In Q3’2019, apartments registered higher average returns to investors at 4.9% in comparison to detached markets with 4.5%. In comparison to H1’2019, rental yields notably improved across the residential market with apartments recording average rental yields of 5.2%, in comparison to 4.9% in H1’2019, whereas detached markets recorded an average of 4.6%, in comparison to 3.9% in H1’2019, largely attributable to increase in occupancy rates as homebuyers capitalize on the pricing discounts.
- Detached Performance
Detached units posted average total returns of 4.5%, 0.8% points lower than the 5.3% recorded in Q3’2018. This was evidenced by a drop in price per SQM from Kshs 138,049 as at Q3’2018 to Kshs 137,421 as developers cut their prices in order to attract clientele amidst a tough financial environment.
In the high-end markets, rental yields averaged at 4.3% in Q3’2019 in comparison to 3.7% in H1’2019, owing to an increase in rental rates from Kshs 741 per SQM in Q3’2018 to Kshs 796 per SQM in Q3’2019, especially in Runda, which is in close proximity to international organizations such as the United Nations and foreign embassies, thus attracting wealthy tenants willing to pay premium rent for an exclusive neighbourhood close to the organizations.
The upper mid-end markets remained largely flat with prices appreciating annually by 0.1%. Average total returns to investors came in at 4.3%, 0.2% points lower than 4.5% recorded in H1’2019. This was on account of a drop in occupancy rates from 89.1% to 88.7% in Q3’2019, which led to a 0.1% point drop in rental yields from 4.3% in H1’2019 to 4.2% in Q3’2019. This is as appetite for lower mid-end units increased due to their affordability evidenced by a relatively low rent per SQM of Kshs 380 in comparison to upper mid-end and high-end markets at Kshs 650 and Kshs 796, respectively. Consequently, the lower mid-end markets recorded the highest returns to investors in the detached market, averaging at 5.2%. However, these areas also recorded an overall price depreciation of 0.1% owing to increased price offers from developers in a bid to lure clientele.
(All Values in Kshs Unless Stated Otherwise)
|
Detached Units Performance Q3’2019 |
|||||||
|
Location |
Price per SQM Q3'2019 |
Rent Per SQM Q3'2019 |
Annual Uptake Q3'2019 |
Occupancy Q3'2019 |
Rental Yield Q3'2019 |
Annual Price Appreciation Q3'2019 |
Total Returns Q3'2019 |
|
A: Top 5 High-End |
|||||||
|
Runda |
229,183 |
1,033 |
11.9% |
93.3% |
5.1% |
0.7% |
5.8% |
|
Rosslyn |
164,377 |
848 |
21.7% |
83.3% |
5.3% |
0.0% |
5.3% |
|
Karen |
188,172 |
763 |
20.9% |
73.8% |
4.2% |
0.6% |
4.8% |
|
Kitisuru |
219,812 |
842 |
22.4% |
76.7% |
4.2% |
(1.6%) |
2.5% |
|
Lower Kabete |
162,459 |
496 |
18.4% |
91.0% |
3.1% |
(1.3%) |
1.7% |
|
Average |
192,801 |
796 |
19.0% |
83.6% |
4.3% |
(0.3%) |
4.0% |
|
B: Top 5 Upper Mid-End |
|||||||
|
Langata |
137,755 |
675 |
13.8% |
93.1% |
4.6% |
0.6% |
5.2% |
|
Loresho |
149,941 |
941 |
15.6% |
88.2% |
4.2% |
0.3% |
4.5% |
|
South B/C |
106,460 |
421 |
23.1% |
95.7% |
4.5% |
(0.5%) |
4.1% |
|
Runda Mumwe |
151,951 |
563 |
24.5% |
89.5% |
4.1% |
(0.2%) |
3.9% |
|
Lavington |
200,187 |
648 |
17.9% |
77.2% |
3.7% |
0.0% |
3.7% |
|
Average |
149,259 |
650 |
19.0% |
88.7% |
4.2% |
0.1% |
4.3% |
|
C: Top 5 Lower Mid-End |
|||||||
|
Athi River |
93,939 |
393 |
19.2% |
74.8% |
5.5% |
0.5% |
6.0% |
|
Syokimau/Mlolongo |
74,211 |
306 |
25.3% |
83.0% |
4.4% |
1.0% |
5.4% |
|
Thika |
66,778 |
458 |
17.4% |
79.4% |
5.5% |
(0.3%) |
5.2% |
|
Donholm/Komarock |
87,571 |
342 |
23.1% |
98.0% |
5.1% |
0.1% |
5.2% |
|
Ruiru |
92,178 |
407 |
17.8% |
80.4% |
6.1% |
(1.8%) |
4.2% |
|
Average |
82,935 |
381 |
20.6% |
83.1% |
5.3% |
(0.1%) |
5.2% |
|
|||||||
Source: Cytonn Research 2019
- Apartments Performance
Apartments recorded average total returns of 4.9%, 1.9% points lower than 6.8% in Q3’2018, largely attributable to sluggish growth in prices as price per SQM dropped from an average of Kshs 110,195 as at Q3’2018 to an average of Kshs 97,369 in Q3’2019. This is attributable to the increase in the supply of apartments and therefore, investors have had to reduce prices in order to attract clientele. However, in comparison to H1’2019, rental yields increased from an average of 4.9% in H1’2019 to 5.1% in Q3’2019 on account of improving occupancy rates.
The upper mid-end markets registered the highest returns to investors at 5.1% boosted by relatively high rental yields that came in at 5.2%. This is as these areas continue to attract relatively high rental rates, as they are popular with high-end clientele especially foreign expatriates. Areas such as Riverside, Westlands, and Kilimani are also boosted by the presence of amenities such as shopping facilities and good transport interconnectivity.
Lower mid-end suburbs registered the highest price drop of 0.4%. This is attributable to increased housing supply in areas such as Ngong Road and Langata, thus tight competition among developers to attract clientele. The areas, however, registered the highest average occupancy rates at 85.1% as they continue to attract the working population due to their proximity to key commercial nodes such as CBD, Kilimani and Upperhill.
(All Values in Kshs Unless Stated Otherwise)
|
Apartments Performance Q3’2019 |
|||||||
|
Location |
Price per SQM Q3'2019 |
Rent per SQM Q3'2019 |
Annual Uptake Q3'2019 |
Occupancy Q3'2019 |
Rental Yield Q3'2019 |
Annual Price Appreciation Q3'2019 |
Total Returns Q3'2019 |
|
A: Top 5 Upper Mid-End |
|||||||
|
Kileleshwa |
116,294 |
765 |
23.2% |
86.5% |
5.7% |
0.5% |
6.2% |
|
Westlands |
145,299 |
806 |
24.2% |
75.5% |
4.8% |
0.9% |
5.8% |
|
Loresho |
116,411 |
559 |
15.0% |
63.9% |
4.4% |
0.5% |
4.9% |
|
Parklands |
121,917 |
679 |
18.4% |
62.3% |
5.3% |
(1.0%) |
4.3% |
|
Kilimani |
119,276 |
863 |
25.3% |
75.9% |
5.8% |
(1.6%) |
4.1% |
|
Average |
123,839 |
734 |
21.2% |
72.8% |
5.2% |
(0.2%) |
5.1% |
|
|
|
|
|
|
|
|
|
|
B: Top 5 Lower Mid-End Suburbs |
|||||||
|
Upper Kabete |
80,883 |
447 |
25.5% |
82.0% |
5.4% |
(0.2%) |
5.2% |
|
South B/C |
99,201 |
406 |
24.0% |
93.3% |
4.7% |
0.5% |
5.2% |
|
Ngong Road |
97,288 |
571 |
22.6% |
72.2% |
5.0% |
(0.1%) |
5.0% |
|
Donholm & Komarock |
72,033 |
382 |
24.9% |
89.9% |
5.8% |
(1.3%) |
4.5% |
|
Langata |
110,659 |
503 |
19.1% |
88.0% |
5.0% |
(1.1%) |
3.9% |
|
Average |
95,126 |
462 |
23.2% |
85.1% |
5.2% |
(0.4%) |
4.7% |
|
|
|
|
|
|
|
|
|
|
C: Top 5 Lower Mid-End Satellite Towns |
|||||||
|
Ruaka |
98,979 |
507 |
20.4% |
73.9% |
4.9% |
0.8% |
5.7% |
|
Athi River |
62,423 |
369 |
17.3% |
74.3% |
4.4% |
0.6% |
5.0% |
|
Thindigua |
94,083 |
472 |
19.4% |
90.8% |
5.1% |
(0.4%) |
4.7% |
|
Syokimau |
65,046 |
280 |
22.6% |
89.4% |
4.9% |
(0.3%) |
4.5% |
|
Kitengela |
60,750 |
400 |
23.1% |
71.8% |
5.7% |
(1.2%) |
4.5% |
|
Average |
76,256 |
406 |
20.6% |
80.1% |
5.0% |
(0.1%) |
4.9% |
|
|||||||
Source: Cytonn Research 2019
Our outlook for the residential market remains neutral. We expect the current financial environment to continue exerting pressure on residential prices, and thus, we expect appetite for the rental market to continue growing, especially in the high-end and upper mid-end markets. We expect the lower mid-end markets to pick up on uptake as more investors shift focus to affordable housing, with opportunity being in areas such as Athi River, Thindigua and Ruaka as they continue to exhibit high demand from end buyers.
- Commercial Office Sector
The commercial office sector recorded a marginal decline in performance with rental yields declining by 0.1% points to 7.7% in Q3’2019 from 7.8% in H1’2019. The decline in rental yields was largely driven by a 0.5% points decline in occupancy rates to 81.0% in Q3’2019 from 80.5% recorded in H1’2019 an indication of a decline in uptake of office space attributed to minimal growth in private sector credit, leading to downsizing or business closures especially for small and medium-sized enterprises (SMEs).
Rental rates and asking prices remained stagnated during the period at Kshs 96 per SQFT and Kshs 12,638 per SQFT, respectively. The stagnation is mainly attributed to an oversupply of 5.2 mn SQFT office space as at 2018, as per our NMA Commercial Office Report 2019, which has created a bargaining chip for potential tenants, forcing developers and landlords to reduce or maintain prices and rents in order to remain competitive and attract occupants to their office spaces.
The table below highlights the performance of the commercial office sector in Nairobi in Q3’2019:
(All Values in Kshs Unless Stated Otherwise)
|
Summary of Commercial Office Performance in Nairobi 2018-2019 |
||||||||
|
Year |
Q1'2018 |
H1'2018 |
Q3'2018 |
Q4'2018 |
Q1’2019 |
H1’2019 |
Q3'2019 |
∆ Q4'2018/Q3'2019 |
|
Occupancy (%) |
80.5% |
84.6% |
87.3% |
83.3% |
82.4% |
81.0% |
80.5% |
(2.8%) points |
|
Asking Rents (Kshs/SQFT) |
98.0 |
102.0 |
102.0 |
102.0 |
100.3 |
96.6 |
96.0 |
(5.8%) |
|
Average Prices (Kshs/SQFT) |
12,718 |
12,527 |
12,202 |
12,573 |
12,574 |
12,637 |
12,638 |
0.5% |
|
Average Rental Yields (%) |
9.2% |
9.3% |
9.5% |
8.1% |
8.0% |
7.8% |
7.7% |
(0.4%) points |
|
• Occupancy rates declined by 2.8% points to 80.5% in Q3’2019 from 83.3% in FY’2018 attributed to the surplus of 5.2 mn SQFT office space as at 2018 |
||||||||
Source: Cytonn Research
In the sub-markets, Gigiri and Karen were the best-performing nodes in 2019, recording rental yields of 9.2% and 9.0%, respectively, attributable to the relatively high asking rents of Kshs 116.0 and Kshs 111.1 per SQFT, respectively, in comparison to average office market rates of Kshs 96.0 per SQFT. This is due to the higher-quality office space in the respective prime locations enabling the developers to charge premium rates.
Offices along Thika Road and Mombasa Road recorded the least rental yields at 6.6% and 5.7%, respectively, 1.1% points and 2.0% points lower than the market average of 7.7%. This was primarily driven by the low asking rents in the market of Kshs 87.9 and Kshs 72.8 per SQFT, respectively, attributable to lower-quality grade B and C offices in the areas and frequent traffic snarl-ups making them generally unattractive to firms.
The table below shows the performance of the commercial office sector in Nairobi in Q3’2019:
(All Values in Kshs Unless Stated Otherwise)
|
Nairobi Metropolitan Area (NMA) Commercial Office Submarket Performance 2018- Q3'2019 |
|||||||||||
|
Location/Node |
Price/SQFT Q3’ 2019 |
Rent/SQFT Q3' 2019 |
Occupancy Q3' 2019 (%) |
Rental Yield (%) Q3' 2019 |
Price/SQFT FY’ 2018 |
Rent/SQFT FY 2018 |
Occupancy FY’ 2018 (%) |
Rental Yield (%) FY 2018 |
∆ in Rent |
∆ in occupancy (% points) |
∆ in Rental Yield (% points) |
|
Gigiri |
13,833 |
116.0 |
79.6% |
9.2% |
13,833 |
141.0 |
88.3% |
10.5% |
(17.7%) |
(8.7%) |
(1.3%) |
|
Karen |
13,665 |
111.1 |
84.6% |
9.0% |
13,665 |
118.3 |
88.6% |
9.2% |
(6.1%) |
(4.0%) |
(0.2%) |
|
Parklands |
12,369 |
97.1 |
82.3% |
8.6% |
12,369 |
102.1 |
86.0% |
8.4% |
(4.9%) |
(3.7%) |
0.2% |
|
Westlands |
12,370 |
104.6 |
79.1% |
8.4% |
12,334 |
109.7 |
82.1% |
9.0% |
(4.6%) |
(3.0%) |
(0.6%) |
|
UpperHill |
12,397 |
98.0 |
81.5% |
7.6% |
12,431 |
99.8 |
80.7% |
7.9% |
(1.8%) |
0.8% |
(0.3%) |
|
Nrb CBD |
12,425 |
86.2 |
86.3% |
7.3% |
12,425 |
88.8 |
88.3% |
7.6% |
(3.0%) |
(2.0%) |
(0.3%) |
|
Kilimani |
12,680 |
90.8 |
81.2% |
7.2% |
12,680 |
98.9 |
88.3% |
8.0% |
(8.2%) |
(7.1%) |
(0.9%) |
|
Thika Rd |
12,600 |
87.9 |
80.9% |
6.6% |
12,600 |
86.3 |
81.5% |
6.7% |
1.8% |
(0.6%) |
(0.1%) |
|
Msa Road |
11,400 |
72.8 |
68.7% |
5.7% |
11,400 |
78.8 |
65.6% |
5.8% |
(7.6%) |
3.1% |
(0.3%) |
|
Average |
12,638 |
96.0 |
80.5% |
7.7% |
12,637 |
102.6 |
83.3% |
8.1% |
(5.8%) |
(2.8%) |
(0.4%) |
|
|||||||||||
Source: Cytonn Research 2019
The major highlights in the commercial office sector during the third quarter of the year included:
- Abbott, a US-based healthcare company, announced the opening of its first Kenyan office at The Watermark Business Park, in Karen. The office will serve as the organization’s headquarters for operations within East Africa. For more information, see our Cytonn Weekly #37/2019
- Kenya Ports Authority (KPA) announced plans to put up an office building in Mombasa with a total built-up area of 75,000 SQM. For more information, see our Cytonn Weekly #29/2019.
- Retail Sector
The Nairobi metropolitan area retail sector performance softened, recording a 1.0% points decline in rental yield to 8.0% in Q3’2019, from 9.0% in FY’2018. This is attributable to:
- Constrained spending power among consumers resulting from a tough financial environment,
- Retail space oversupply, which currently stands at 2.0 mn SQFT, which saw average occupancies drop by 9.2% points from 83.7% in Q3’2018 to 74.5% in Q3’2019. Property managers therefore reduced rental rates in addition to other innovative strategies such as offering rent-free grace periods of up to 6 months in a bid to attract tenants. This resulted in average rents declining by 6.2% to Kshs 167.0/ SQFT/month from Kshs 178.2/ SQFT/month in FY’2018. The performance of the retail sector in Nairobi over time is as shown below;
(All Values in Kshs Unless Stated Otherwise)
|
Retail Sector Performance Summary 2018/2019 |
|||||||||
|
Item |
Q3’ 2018 |
FY' 2018 |
Q3’ 2019 |
∆ Y/Y |
∆ Q3’2019 |
||||
|
Average Asking Rents (Kshs/SQFT) |
178.2 |
178.2 |
167.0 |
(6.7%) |
(6.2%) |
||||
|
Average Occupancy (%) |
83.7% |
79.1% |
74.5% |
(9.2%) |
(4.6%) points |
||||
|
Average Rental Yields |
9.4% |
9.0% |
8.0% |
(1.4%) |
(1.0%) points |
||||
|
|||||||||
Source: Cytonn Research 2019
In terms of submarket analysis in Nairobi, Westlands and Kilimani were the best performing retail nodes with average rental yields of 11.0% and 9.9%, respectively, due to premiums charged on rents in these nodes, as the areas are affluent neighborhoods hosting middle to high-end income earners with high consumer purchasing power.
Mombasa Road and Satellite towns recorded the lowest rental yields at 6.3% and 5.7%, respectively. The poor performance is attributable to low rental charges of Kshs 148/SQFT/month and Kshs 131/SQFT/month as a result of continued traffic congestion along Mombasa road and competition from informal retail space in Satellite towns.
A summary of the performance per node is as per the below table:
|
Summary of Nairobi’s Retail Market Performance Q3’ 2019 |
|||||||||
|
Location |
Rent Per SQFT Q3' 2019 |
Occupancy Q3' 2019 |
Rental Yield Q3' 2019 |
Rent Per SQFT FY' 2018 |
Occupancy FY' 2018 |
Rental Yield FY'2018 |
Q3’ 2019 ∆ in Rental Rates |
Q3’ 2019 ∆ in Occupancy (% points) |
Q3’ 2019 ∆ in Rental Yields (% points) |
|
Westlands |
208 |
84.6% |
11.0% |
219 |
82.2% |
12.2% |
(5.2%) |
2.4% |
(1.2%) |
|
Kilimani |
170 |
87.2% |
9.9% |
167 |
97.0% |
10.7% |
2.0% |
(9.8%) |
(0.8%) |
|
Ngong Road |
179 |
83.1% |
9.2% |
175 |
88.8% |
9.7% |
2.5% |
(5.7%) |
(0.5%) |
|
Karen |
208 |
77.0% |
9.1% |
225 |
88.8% |
11.0% |
(7.6%) |
(11.8%) |
(1.9%) |
|
Eastlands |
145 |
74.5% |
7.5% |
153 |
64.8% |
6.8% |
(5.3%) |
9.7% |
0.7% |
|
Thika Rd |
165 |
73.5% |
7.5% |
177 |
75.0% |
8.3% |
(6.5%) |
(1.5%) |
(0.8%) |
|
Kiambu Rd |
166 |
61.7% |
6.8% |
183 |
69.5% |
8.1% |
(9.3%) |
(7.8%) |
(1.3%) |
|
Mombasa Rd |
148 |
64.0% |
6.3% |
162 |
72.4% |
7.9% |
(8.6%) |
(8.4% |
(1.6%) |
|
Satellite Towns |
131 |
70.3% |
6.0% |
142 |
73.7% |
6.7% |
(7.5%0 |
(3.4%) |
90.7%) |
|
Grand Total |
167 |
74.5% |
8.0% |
178 |
79.1% |
9.0% |
(6.0%) |
(4.6%) |
(1.0%) |
|
|||||||||
Source: Cytonn Research 2019
Notable activities during the quarter included:
- Buffalo Mall, located in Naivasha, announced a net profit of Kshs 33 mn for the year ended June, as a result of Knight Frank’s revaluation of the property in June 2019 to Kshs 750.1 mn. The revaluation comes after announcements by Grit Real Estate Income Group, a Mauritius-based commercial real estate investments firm, of plans to divest from the mall where it has a 50.0% stake acquired in April 2016 for Kshs 459 mn. This translates to a negative IRR of 7.5%, should GRIT real estate offload their stake at the current market value, thus representing a loss to the firm. With the current economic environment, mall developers in Kenya have continued to introduce cautious measures such as rent reduction and rent-free grace periods in order to maintain clientele, which has seen malls like Buffalo mall, Two Rivers among others continue to post losses. Buffalo mall which was completed in 2015 has a lettable space of 80,484 SQFT (online sources), and therefore, the revaluation translates the mall’s value to Kshs 9,318 per SQFT. Assuming average rental rates of Kshs 79.0 per SQFT as per Cytonn’s 2018 Nakuru Investment Opportunity report, an investor stands to generate a rental yield of 10.2% at full occupancy. This is 4.4% points higher than Nakuru’s average rental yield as of 2018, which came in at 5.8%, and 2.2% points higher than the average Nairobi retail sector yield. At the average occupancy rates recorded by Nakuru malls of 73.8% as at 2018, the mall has a potential yield of 7.5%. We are therefore of the view that the property provides a good investment opportunity at the current market valuation,
- Shoprite opened its third store in City Mall Nyali, Mombasa, while local supermarket chain Naivas Supermarkets opened their latest outlet in Ongata Rongai, Kajiado County. For more, see Cytonn Weekly #28/2019
- South-African fashion retailer Woolworths also opened their eleventh flagship store in Kenya at the Sarit Center, taking up 22,500 SQFT of space. Woolworths has been on an expansion drive, opening five new stores in the last five years alone. The entry of strong tenants is an added advantage to Sarit center, which recently opened a new 300,000 SQFT wing, adding to the current 500,000 SQFT. The new wing comprises of retail space, larger conferencing and exhibition spaces, a multi-storey car parking silo and a roof top garden,
- Haltons, a local drugstore chain, also announced plans to open more branches countrywide, with a target of 30 branches by the end of the year. Haltons, the second biggest pharmacy chain in Kenya after Goodlife Pharmacy, was acquired by Ghana’s mPharma in March 2019. The planned expansion will be a boost to the retail sector as it means increased uptake of retail space,
- Quick Mart Limited and Tumaini Self Service Limited announced the commencement of a merger and business integration of the two companies. For analysis, see Cytonn Weekly #36/2019
- South African retailer, Choppies Supermarkets, announced plans to exit the Kenyan market, where it currently has 12 stores, following poor performance as a result of the growing competition in the sector from both international brands and the informal sector. For more, see Cytonn Weekly #36/2019
We expect reduced development activity of malls supply in 2019 due to the current oversupply of 2.0mn SQFT. We expect to see higher uptake of the current retail stock, boosted by continued interest in Kenya’s retail scene by international players and continued expansion by local retailers, which will cushion the sector’s market performance.
- Hospitality Sector
The hospitality sector continued to attract investment from both local and global players during the third quarter of the year as follows:
- Marriott International, an American multinational hotel chain, signed a franchise agreement with Aleph Hospitality, a Dubai-based hotel management company to add Bluewater Hotels located in Kisumu to its portfolio. The franchise that will operate under the name, “Protea Hotel by Marriott”. For more information, see our Cytonn Weekly #37/2019, and,
- Radisson Group began operation of its third hotel, Radisson Blu Hotel and Residence in Nairobi. The hotel is located at the Nairobi Arboretum area and brings to the hospitality market 122-keys. Please see our Cytonn Weekly #39/2019.
In addition to the above activities, hospitality facilities that came into the pipeline during the quarter include:
|
Hospitality Facilities Deal Pipeline Q3’2019 |
|||||
|
Hospitality Facility Name |
Brand/Developer |
No. of Rooms |
Location |
Status |
Year of Completion |
|
M Gallery Hotel Chain |
Accor Group |
105 |
Gigiri |
Planned |
2021 |
|
Sun Africa Serviced Apartments |
Sun Africa Hotels Group |
20 |
Hurlingham |
Planned |
Undisclosed |
|
Undisclosed |
Eighteen Seventy Lower Kabete Limited |
366 |
Westlands |
Planned |
Undisclosed |
|
Undisclosed |
ACME Dream Limited |
25 |
Embakasi |
Planned |
Undisclosed |
|
Diani Beef Beach Hotel |
- |
114 |
Mombasa |
Planned expansion |
Undisclosed |
During the quarter, PricewaterhouseCoopers (PWC) released the Hotels Outlook 2019-2023 Report. According to the report, the average hotel occupancy rate stood at 53.2% in 2018, 5.9% points increase from 47.3% in 2017. However, the Average Daily Rate (ADR) came in at USD 131, a 3.0% drop from USD 135 in 2017 attributable to a decline in room rates. The 2018 hotel performance was attributable to: (i) economic growth and security, which led to a drop in travel advisories making Kenya a desirable destination, (ii) increased air connectivity, and (iii) the Magical Kenya promotional campaign, which increased Kenya’s attractiveness especially to audiences such as United States, Europe, India, and China. Please see Cytonn Monthly- August 2019.
In terms of performance, we tracked the performance of serviced apartments in 7 nodes in the Nairobi Metropolitan area and compared with the performance in Q3’2018. From our research, serviced apartments recorded a marginal decline in performance with the average rental yield coming in at 6.4%, which is 0.3% points lower than 6.7% recorded in Q3’2018. We attribute this to a decline in occupancy rates, as a result of the decreased number of expatriates with the closing down of foreign firms given the current tough economic and operating environment, in addition to the growing competition from international hotels which have continued to expand their foothold in the Kenyan market and offer high quality hospitality facilities.
The performance was as follows:
(All Values in Kshs Unless Stated Otherwise)
|
Nairobi Metropolitan Area Serviced Apartments Performance Q3’2019 |
||||||||
|
Sub Market |
Monthly Charge per SM(Kshs) Q3'2019 |
Monthly Charge per SQM (Kshs) Q3'2018 |
Occupancy 2019 |
Occupancy 2018 |
Q3'2019 Rental Yield |
Q3'2018 Rental Yield |
% Rental Yield ∆ |
|
|
Westlands& Parklands |
4,035 |
2,519 |
63% |
62% |
8.7% |
7.0% |
1.8% |
|
|
Kileleshwa& Lavington |
3,352 |
2,369 |
70% |
79% |
8.2% |
5.7% |
2.4% |
|
|
Kilimani |
2,786 |
2,231 |
71% |
90% |
7.0% |
7.9% |
(0.9%) |
|
|
Limuru Road |
2,798 |
1,686 |
72% |
91% |
6.3% |
7.6% |
(1.3%) |
|
|
Upperhill |
2,314 |
2,333 |
79% |
60% |
6.3% |
7.4% |
(1.1%) |
|
|
Thika Road |
1,095 |
901 |
48% |
|
1.9% |
4.8% |
(3.0%) |
|
|
Average |
2,730 |
2,006 |
67% |
76% |
6.4% |
6.7% |
(0.3%) |
|
|
*We have estimated an average developer cost of Kshs 200,000-Kshs 231,000 per SQM depending on land prices and allowable plot ratios in the covered nodes in order to calculate yield · Westlands/Parklands area was the best performing node recorded a rental yield of 8.7%, attributed to its easy access from Nairobi CBD and Jomo Kenyatta International Airport (JKIA), proximity to business nodes such as Kilimani and Upperhill, presence of social amenities and also security being within the UN Blue zone and thus attractive to expatriates · Thika Road recorded the lowest rental yield at 1.9% and this we attribute to the unavailability of quality serviced apartments, in addition to traffic congestion along the Thika Super Highway thus making it unattractive to guests |
||||||||
Source: Cytonn Research
We retain a positive outlook for the hospitality sector in Kenya driven by (i) increased demand for accommodation and other hospitality services by both local and international guests, (ii) continued marketing efforts by the Kenya Tourism Board, (iii) improved security which has continued to enhance investor confidence in the Kenyan market, and (iv) improved flight operations and systems, which will make it easier and more convenient for travellers.
- Land Sector
The land sector in the Nairobi Metropolitan Area (NMA) recorded a 0.3% annual decline in the asking prices during the quarter, attributed to an overall slowdown in real estate investment activities. Despite the decline, satellite towns such as Ruiru and Limuru registered a 6.1% annual capital appreciation on average, attributed to the relatively high demand for land in these areas fuelled by the affordable housing initiative in addition to satellite towns acting as Nairobi’s dormitory towns with majority of the population moving away from the congested Central Business District.
The table below shows the performance of the sector during Q3’2019:
(All Values in Kshs Unless Stated Otherwise)
|
NMA Land Sector Q3'2019 Market Performance |
|||
|
Segments |
FY'2018 |
Q3'2019 |
Annualized Capital Appreciation |
|
Satellite Towns |
24.4 mn |
25.5 mn |
6.1% |
|
Nairobi Suburbs- Low Rise Residential Areas |
86.3 mn |
87.2 mn |
1.3% |
|
Nairobi Suburbs- High Rise Residential Areas |
117.1 mn |
117.3 mn |
0.3% |
|
Site and service schemes |
13.1 mn |
12.9 mn |
(1.9%) |
|
Nairobi Suburbs- Commercial Zones |
492.6 mn |
427.1 mn |
(5.4%) |
|
Average |
(0.3%) |
||
Source: Cytonn Research, 2019
- Satellite towns such as Athi River and Ruaka recorded a relatively high capital appreciation at 6.1% despite the overall market correction of 0.3%. This is attributed to; (i) The affordable housing initiative which has been a key focus sector by both the government and private sector players, (ii) high demand of land due to affordability in comparison to Nairobi’s suburbs, and (iii) improving infrastructure such as roads and sewerage systems. Ruaka and Limuru recorded the highest capital appreciation at 8.0% and 7.8%, respectively,
- Low-rise residential areas such as Karen recorded an average capital appreciation of 1.3%, attributable to the continued demand for housing, as they are relatively sparsely populated, are deemed favorable for families mainly as they enhance privacy, and are relatively affordable at an average asking land price of Kshs 87.2 mn, compared to high-rise areas at Kshs 117.3 mn per acre on average,
- High-rise areas recorded a marginal capital appreciation of 0.3% and this we attribute to the scarcity of development land and increased demand in these areas, as they are zoned for densification, thus high return on capital for investors. Kileleshwa recorded the highest capital appreciation at 1.6%, attributable to increased demand for property in the area, while Embakasi, which was the poorest performer, recorded a 6.0% decline attributable to congestion on trunk infrastructure making it unattractive for settlement and thus reduced development activity and demand for land,
- Serviced land in satellite towns recorded a 1.9% annual decline in asking prices, due to decreased demand as buyers are not willing to pay a premium for the services provided, thus opt for un-serviced land and provide the services for themselves. Syokimau- Mlolongo recorded the highest annual capital appreciation driven by the speculative tendencies brought about by the Standard Gauge Railway (SGR),
- Commercial zones such as Upperhill recorded a 5.4% correction in asking prices, attributed to the decreased demand for development land in the submarkets due to the existing oversupply of commercial office and retail space at of 5.2 mn SQFT and 2.0 mn SQFT, respectively.
The investment opportunity in the land sector lies in satellite town such as Ruiru, Ruaka and Utawala supported by the continued demand for development land in these areas thus, the relatively high capital appreciation of 8.0%, 7.8% and 7.1%, respectively.
Other highlights during the quarter:
- Nairobi City Council announced that it would cap the new land rates at 1.0% of the current value of the plots as opposed to using the 1980 valuation, where property owners pay land rates at 25.0% of the unimproved site value. The specific rates will be based on the current value of undeveloped land and the new fees will be effective on January 2020. For more information, see our Cytonn Weekly #30/2019, and,
- Investment firm Centum, through its real estate arm Centum Real Estate, signed a refinancing deal with Nedbank Corporate and Investment Bank (CIB), the Nedbank property finance division. The Kshs 6.5 bn from Nedbank, will allow the firm to consolidate the debt facilities for the Two Rivers development which is currently in its second phase. The company highlighted that it had experienced challenges in the sector due to limited access to credit occasioned by the capping of the interest rates. For more information, see our Cytonn Weekly #30/2019.
We expect growth in the land sector to be driven by the demand for development land especially with the affordable housing initiative, improving infrastructure and positive demographics.
- Statutory Reviews
Physical and Land Use Planning Act, 2019 came into effect on August 2019, repealing the Physical Planning Act, 1996. The act will regulate planning and prescribe the appropriate use of development land. The major amendments include:
- Clear definitions of commercial and industrial use, and a schedule of developments that require development permission,
- Public participation in the preparation of a county physical and land use development plan,
- The requirement of development permission prior to being granted a license for the commercial or industrial use or occupation of any building, and,
- Timelines with regard to commencement of a project after approval and completion of building works, set at three and five years, respectively.
We expect the act to have a positive impact on the real estate sector by holding developers accountable with specified timelines in planning and land use. However, it may impact the sector negatively through the introduction of new development levies by the respective County governments increasing the cost of construction and lead to an extension of project approval timelines as a result of public participation.
The Architectural Association of Kenya (AAK) in a recent letter to the Nairobi County Government expressed concern over the delay in the processing of construction permits by the County Governments. According to the letter, the backlog of construction permits amounts to 538 applications that are pending approval at various stages. To remedy the situation, the AAK proposed the regular monthly technical committee to be convened by the County Government to review the pending applications and rectification of the e-permit system that is currently inactive.
The delay in the approval of the permits continues to affect developers by prolonging project implementation timelines, which ultimately leads to increased development costs. We expect the resolution of the matter to put the various developers back on track with their respective projects and boost construction activity in the sector.
- Listed Real Estate
During the period, Stanlib Fahari I-REIT released their H1’2019 earnings, recording a 16.2% growth in net profit to Kshs 76.4 mn in H1’2019, from Kshs 65.8 mn in H1’2018. This translated to a growth in earnings to Kshs 0.42 per unit, from Kshs 0.36 per unit in H1’2018. Total income rose by 10.8% to Kshs 193.5 mn, from Kshs 174.6 mn in H1’2018, while net profit grew by 16.2% to Kshs 76.4 mn, from Kshs 65.8 mn in H1’2018. The performance was driven by a 26.3% growth in rental income to Kshs 170.7 mn, from Kshs 135.1 mn in H1’2018, as the REIT positively benefitted from rental income contribution as a result of increased occupancies by its properties, including the Grade A office, 67 Gitanga Place, which was acquired in May 2018. The REIT did not recommend an interim distribution of dividends for the period ended 30th June 2019. It was noted that a full distribution will be declared in line with the requirements of the REITs Regulations to distribute a minimum of 80% of distributable earnings within four months after the end of the financial year, which ends on 31st December 2019. The graph below compares the growth rate of total income, rental income, net profit and rental yield of investment property during the period:
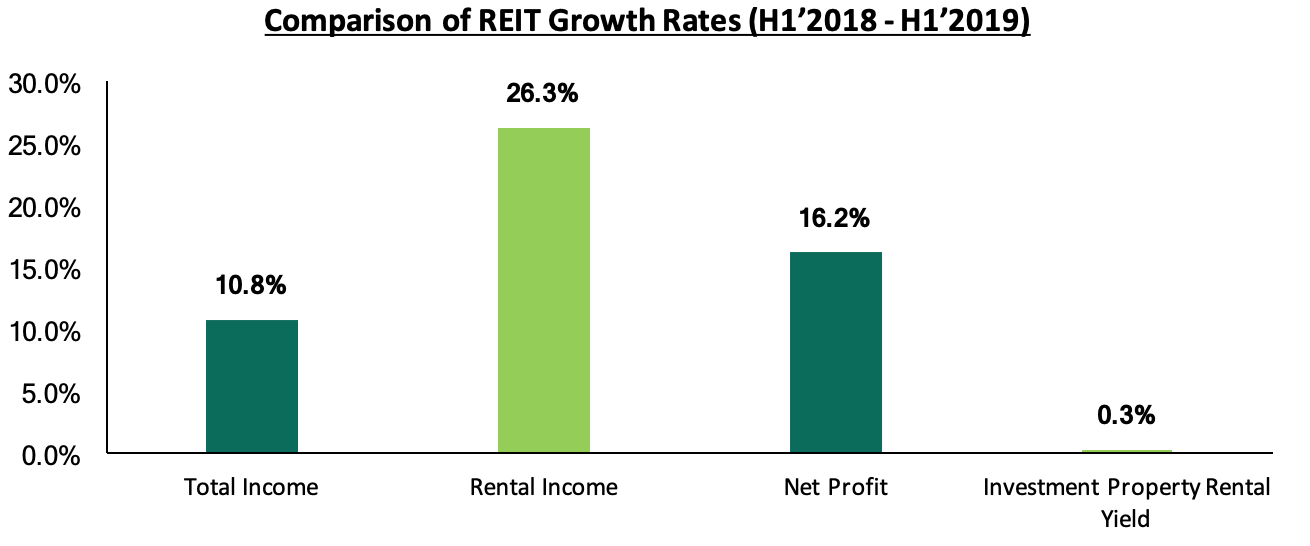
Source: Stanlib Fahari I-REIT
For a more comprehensive analysis on the REIT H1’2019 performance, see our Stanlib Fahari I-REIT Earnings Note - 2019.
During Q3’2019, the Stanlib’s Fahari I-REIT share price declined by 27.8% closing at Kshs 7.8 per share, from Kshs 10.8 per share at the beginning of the year. The REIT traded at an average unit price of Kshs 8.3 in Q3’2019, 58.5% lower than its listing price of Kshs 20.0 in November 2015. The instrument continues to trade in low prices and volumes, due to poor institutional framework in support for REITs and negative perception of the instrument by real estate investors.
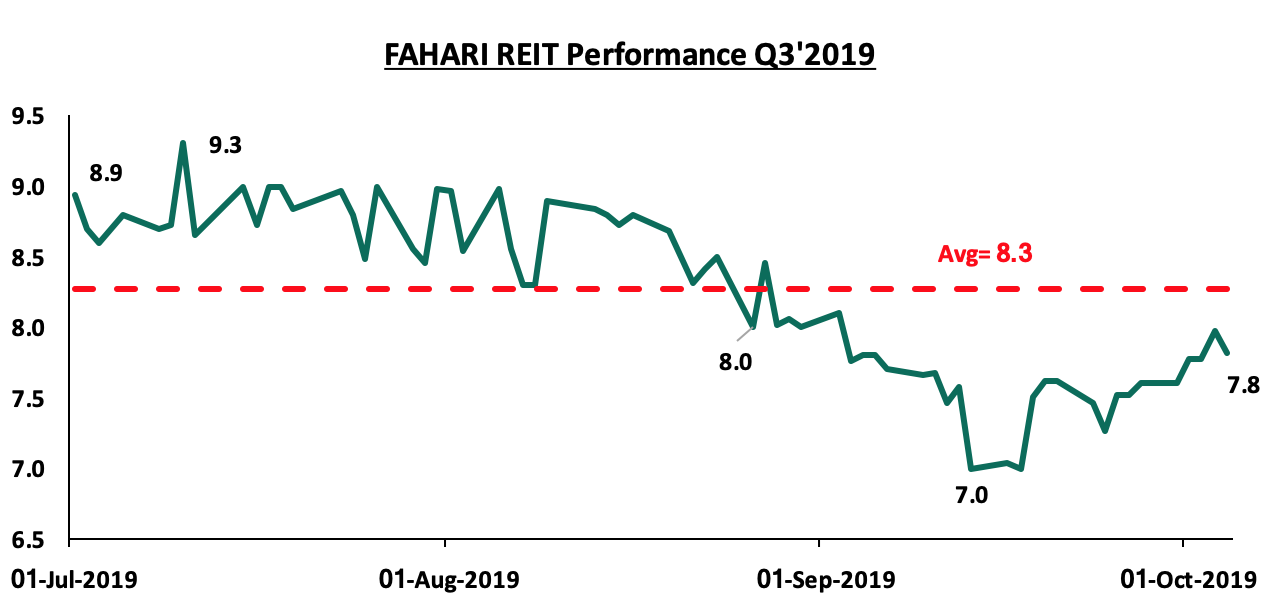
Our outlook for Stanlib’s listed real estate remains negative as the performance is constrained by the continued lack of investor appetite for the instrument.
Disclaimer: The views expressed in this publication are those of the writers where particulars are not warranted. This publication is meant for general information only and is not a warranty, representation, advice or solicitation of any nature. Readers are advised in all circumstances to seek the advice of a registered investment advisor.

- Talk to us
- Kenya
- P.O Box 20695 - 00200, Nairobi, Kenya
- Cell +254709101200
- Tel +254709101200
- WhatsApp +254741676635
- United States
- +254709101200
- DOWNLOAD OUR APP
-


- Kenya
- 8th Floor, Pinetree Plaza, Kaburu Drive, Ngong Road, Nairobi, Kenya
- USA
- Suite 1150, 1775 Eye Street NW, USA, Washington DC 20006, USA
- Investments
- High Yield
- Private Equity
- Real Estate
- Real Estate
- RiverRun Estates
- Cytonn Towers
- The Ridge
- Taraji Heights
- The Alma